. 2023 Apr;616(7955):123-131.
doi: 10.1038/s41586-023-05844-9. Epub 2023 Mar 29.

An atlas of genetic scores to predict multi-omic traits

Affiliations

An atlas of genetic scores to predict multi-omic traits

Yu Xu et al. Nature. 2023 Apr.

Abstract

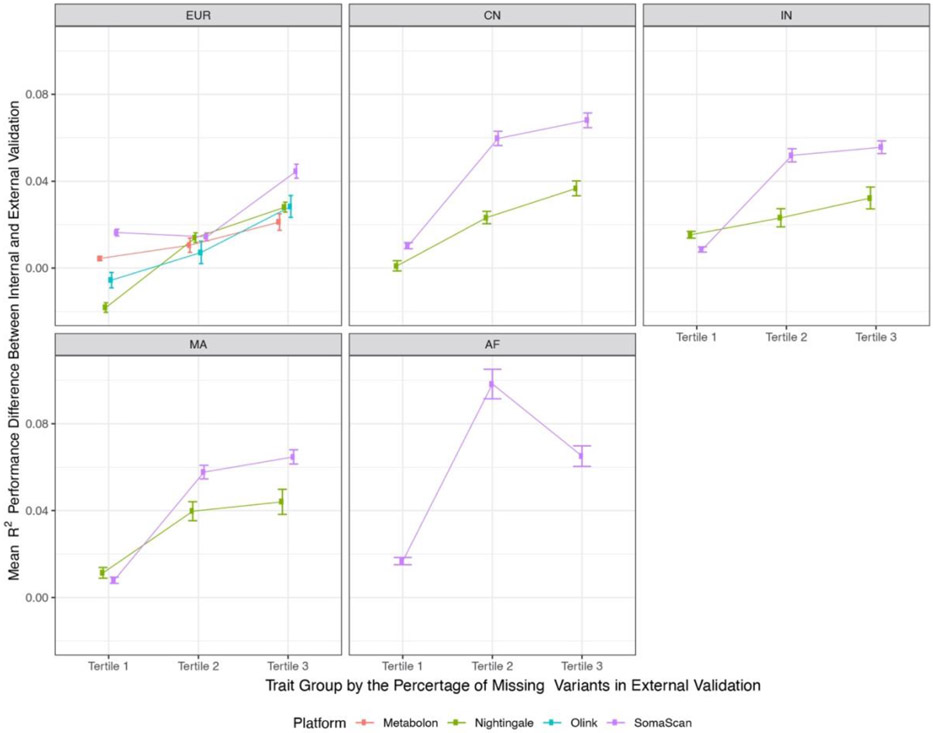
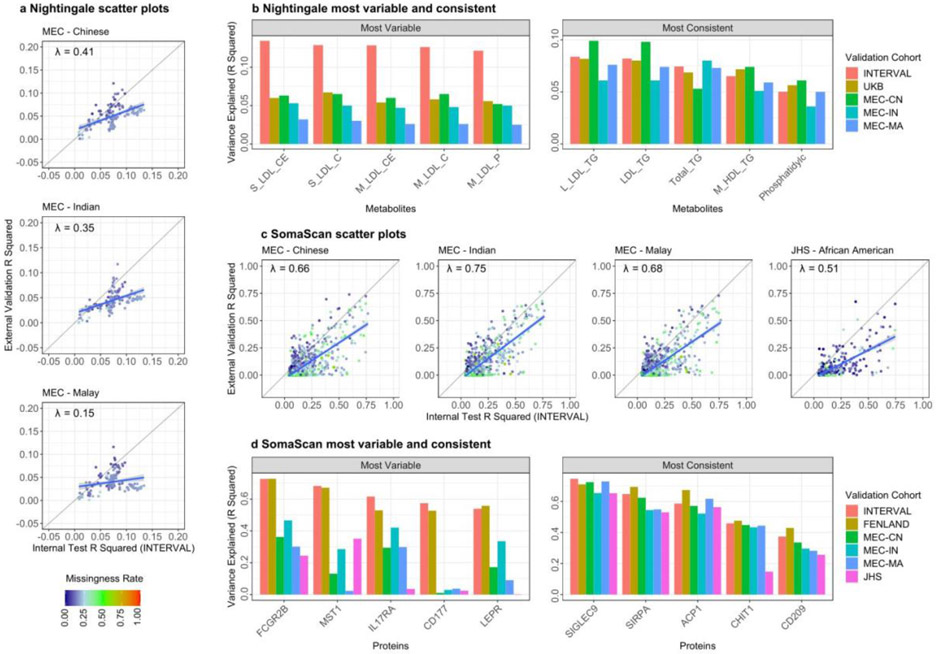
The use of omic modalities to dissect the molecular underpinnings of common diseases and traits is becoming increasingly common. But multi-omic traits can be genetically predicted, which enables highly cost-effective and powerful analyses for studies that do not have multi-omics1. Here we examine a large cohort (the INTERVAL study2; n = 50,000 participants) with extensive multi-omic data for plasma proteomics (SomaScan, n = 3,175; Olink, n = 4,822), plasma metabolomics (Metabolon HD4, n = 8,153), serum metabolomics (Nightingale, n = 37,359) and whole-blood Illumina RNA sequencing (n = 4,136), and use machine learning to train genetic scores for 17,227 molecular traits, including 10,521 that reach Bonferroni-adjusted significance. We evaluate the performance of genetic scores through external validation across cohorts of individuals of European, Asian and African American ancestries. In addition, we show the utility of these multi-omic genetic scores by quantifying the genetic control of biological pathways and by generating a synthetic multi-omic dataset of the UK Biobank3 to identify disease associations using a phenome-wide scan. We highlight a series of biological insights with regard to genetic mechanisms in metabolism and canonical pathway associations with disease; for example, JAK-STAT signalling and coronary atherosclerosis. Finally, we develop a portal ( https://www.omicspred.org/ ) to facilitate public access to all genetic scores and validation results, as well as to serve as a platform for future extensions and enhancements of multi-omic genetic scores.


Figures

Extended Data Figure 1:
Extended Data Figure 1:. Schematic framework for the development and validation of multi-omic genetic scores.
This figure presents the overall study design for the development of genetic scores for multi-omic traits across five platforms (Nightingale, Metabolon, Olink, SomaScan and RNAseq) using INTERVAL data as well as their validation in seven external cohorts of multiple ancestries (European, Asian-Chinese, Asian-Malay, Asian-Indian and African American).
Extended Data Figure 2:
Extended Data Figure 2:. R2 performance comparison between Bayesian ridge, LDpred2, P+T for Metabolon traits in external validation (INTERVAL withheld set).
This figure compares the R2 performance between BR (on the set of genome-wide variants with p-value < 5×10⁻⁸; x-axis) and LDpred2 (Hapmap3 variant set), and between BR and P+T (variant sets of two p-value thresholds: 5×10⁻⁸ and 1×10⁻³) for 20 randomly selected Metabolon traits in external validation (INTERVAL withheld set; Methods). P-values in the GWAS for omic traits were derived by t-test in linear regression and all tests were two-sided.
Extended Data Figure 3:
Extended Data Figure 3:. Distribution of the number of variants in the genetic scores and the correlations between performance (R2) of genetic scores and the number of variants comprising the score.
The density plots show the distribution of the number of variants comprising the genetic scores at each platform. The scatter plots show the change of R2 score in the internal validation by the number of variants in the genetic score model.
Extended Data Figure 4:
Extended Data Figure 4:. Validation of genetic scores in external European cohorts.
The scatter plots compare the spearman correlation scores between internal validation and external validation with a European cohort on each platform, in which points are coloured by the variant missingness rate in the external cohort and the blue line shows the linear models fitting the data points. This analysis included all the developed genetic scores in this study.
Extended Data Figure 5:
Extended Data Figure 5:. Validation performance change of genetic scores by their variant missing rates in external cohorts of different ancestries.
External validation results in European cohorts were merged in each platform to increase the statistical power in this analysis, which include NSPHS and ORCADES validations for Olink, and ORCADES and VIKINGS validations for Nightingale. Note that INTERVAL withheld subset validations and UKB validation for Nightingale traits were excluded in this analysis due to there is no or nearly no variant missingness in these external cohorts. Validation results in each platform were ranked by their variant missing rate of genetic score models in the external cohort and grouped into tertiles, where variant missing rate is the number of variants missing in the validation cohort / the total number of variants in the genetic score. This figure presents the mean and standard error (SE) of R2 performance change of genetic scores between internal and external validation across tertiles of validation results. The analysis included validation results of 2,129 SomaScan, 603 Olink, 455 Metabolon and 423 Nightingale traits (traits can be overlapped for the same platform across multiple validation cohorts) for European (EUR); 2,047 SomaScan and 139 Nightingale traits for Chinese (CN), Indian (IN) and Malay (MA); 820 SomaScan traits for African American (AF).
Extended Data Figure 6:
Extended Data Figure 6:. Performance (R2) of genetic scores for Nightingale (a) and SomaScan (b) in external cohorts of various ancestries relative to R2 in internal validation (INTERVAL).
Transferability was only tested if the genetic score had a significant (two-sided t-test; Bonferroni corrected p-value < 0.05 for all the 17,227 omic traits tested) association with the directly measured molecular trait in internal validation (n = 1631, 7471, 964, 635 and 827 for Metabolon, Nightingale, Olink, SomaScan and RNAseq traits respectively). This resulted in 137, 136 Nightingale metabolic traits for UKB (n = 98,245 participants) and MEC (Chinese, n = 1,067; Indian, n = 654; Malay, n = 634) respectively and 949, 1052, 378 SomaScan proteins for FENLAND (n = 8,832), MEC (Chinese, n = 645; Indian, n = 564; Malay, n = 563) and JHS (n = 1,852). Violin plots show distributions of the ratio of R2 values. Black points show mean values and error bars are standard errors.
Extended Data Figure 7:
Extended Data Figure 7:. Performance (R2) of genetic scores between longitudinal samples and across ancestries in the MEC cohort.
Paired samples include a baseline and a revisit sample from each individual run on SomaScan and Nightingale for MEC Chinese (N=403 and 721 individuals), MEC Indian (N= 356 and 376) and MEC Malay (N=353 and 363). Blue lines denote linear models fitted to each set of data points and the shaded areas represent 95% confidence intervals where applicable. There is no Nightingale genetic scores with a R2 > 0.15 in both internal and MEC validation, so (a, b, c) only show R2 in the range of [0, 0.15] for clarity. The sub-box plots at the right bottom of (d, e, f) show the validation results of these traits with baseline validation performance (R2) between 0 and 0.025 in each ancestry.
Extended Data Figure 8:
Extended Data Figure 8:. Coverage analysis for blood proteins in the lowest-level pathways.
This analysis looked at all the lowest-level pathways of super-pathways curated at Reactome. Where at least one protein genetic score are included in the entities of a lowest-level pathway, we consider this pathway is covered by proteins of this study. This figure shows the percentage of the lowest-level pathways a group of proteins (by R2 in internal validation) covered among all the lowest-level pathways of each super-pathway.
Extended Data Figure 9:
Extended Data Figure 9:. Key features of OmicsPred portal for accessing genetic scores of multi-omic traits.
a, Organization of genetic scores on the portal. b, Example of how biomolecular traits and their genetic score-related information can be explored. c, Example of how summary statistics of training and validation cohorts are presented. d, Example of how validation results and genetic score models can be downloaded. e, Example of how validation results and trait-related information can be visualized.
Figure 1:
Figure 1:. Performance of multi-omic genetic scores in internal validation.
The variance explained in the measured biomolecular trait (R2) by the genetic score is assessed in the internal validation set of INTERVAL (Methods). Pie charts reflect the number of genetic scores in a particular R2 range.
Figure 2:
Figure 2:. External validation of genetic scores in cohorts of European ancestry.
Comparisons of R2 in internal validation and external validation for each omic platform, for genetic scores with Bonferroni-adjusted p-value < 0.05 in internal validation (two-sided t-test; correcting for 17,227 omic traits). Data points coloured by variant missingness rate in the external cohort. Blue lines show fitted linear models and λ are model slopes. Concentric circles show number of genetic scores in different ranges of R2 in internal validation (inner ring) and external validation (outer ring).
Figure 3:
Figure 3:. Transferability of genetic scores to Asian and African American ancestries.
a, c, Performance comparison between internal validation and external validation in non-European ancestries for (a) Nightingale and (c) SomaScan genetic scores. Transferability was tested for genetic scores with Bonferroni-adjusted p-value < 0.05 in internal validation (two-sided t-test; correcting for 17,227 omic traits). Data points are coloured by variant missingness rate in the external cohort. b, d, R2 of genetic scores for (b) Nightingale and (d) SomaScan with the five most variable or five most consistent for prediction in multi-ancestry validation, as quantified by mean absolute difference in R2 for genetic scores with Nightingale R2 > 0.05, SomaScan R2 > 0.30 in internal validation.
Figure 4:
Figure 4:. Applications of genetic scores of multi-omic traits.
a, Genetic control of Reactome super-pathways using SomaScan and Olink genetic scores of varying R2 in internal validation (Methods). b, Phenome-wide association study in UK Biobank. Stacked barplots show the number of detected significant associations by PheCode category of disease and omic platform (two-sided Wald test and FDR-corrected p-value < 0.05 for 11,576 tested traits). c, Strength of associations by category of disease and omic platform. Association with the lowest p-value for each disease category is labelled.
Figure 5:
Figure 5:. JAK/STAT and Wnt signalling pathways.
a, c, Pathway diagrams for (a) JAK/STAT and (c) Wnt signalling. Nodes coloured based on hazard ratio (HR) of the genetic score for (a) coronary artery disease (CAD) and (c) hypothyroidism. Nodes are white if there is not a corresponding genetic score. The most significant HR across omic platforms is used at each node. Nodes are bold if the genetic score had FDR-adjusted p-value < 0.05 (two-sided Wald test and correcting for 11,576 tested traits). b, d, Forest plots of FDR-significant HRs for (b) CAD (n = 28,854 cases and 390,159 controls) and (d) hypothyroidism (n = 21,871 cases and 404,440 controls) for genetic scores in (b) JAK/STAT or (d) Wnt signalling. e, Forest plot of HRs and 95% confidence intervals for the genetic score of USP25 (SomaScan) across multiple diseases.

Comment in

References

    1. Barbeira AN et al. Exploring the phenotypic consequences of tissue specific gene expression variation inferred from GWAS summary statistics. Nat. Commun 9, 1–20 (2018). - PMC - PubMed
    1. Moore C et al. The INTERVAL trial to determine whether intervals between blood donations can be safely and acceptably decreased to optimise blood supply: study protocol for a randomised controlled trial. Trials 15, 363 (2014). - PMC - PubMed
    1. Bycroft C et al. The UK Biobank resource with deep phenotyping and genomic data. Nature 562, 203–209 (2018). - PMC - PubMed
    1. Ritchie SC et al. Integrative analysis of the plasma proteome and polygenic risk of cardiometabolic diseases. Nat. Metab 3, 1476–1483 (2021). - PMC - PubMed
    1. Lambert SA et al. The Polygenic Score Catalog as an open database for reproducibility and systematic evaluation. Nature Genetics vol. 53 420–425 (2021). - PMC - PubMed

Publication types

MeSH terms