. 2023 Apr;616(7955):143-151.
doi: 10.1038/s41586-023-05869-0. Epub 2023 Mar 29.

Spatial multiomics map of trophoblast development in early pregnancy

Affiliations

Spatial multiomics map of trophoblast development in early pregnancy

Anna Arutyunyan et al. Nature. 2023 Apr.

Abstract

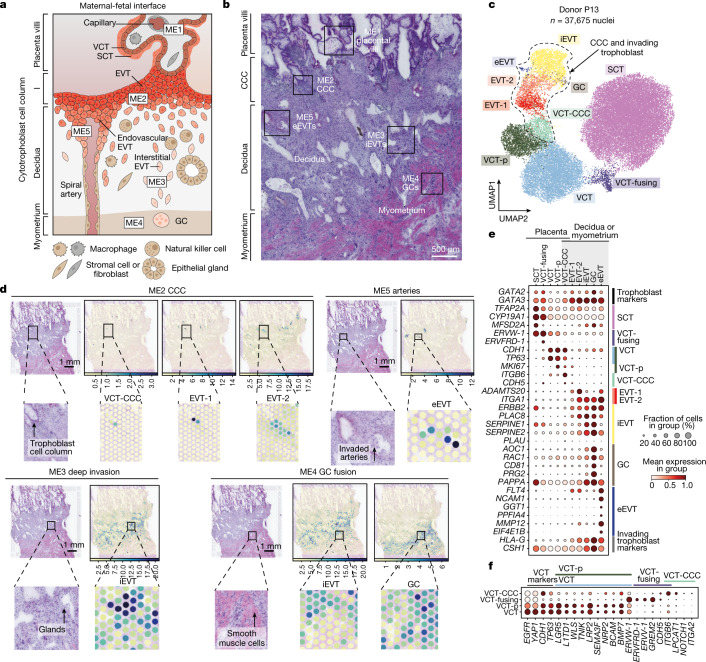
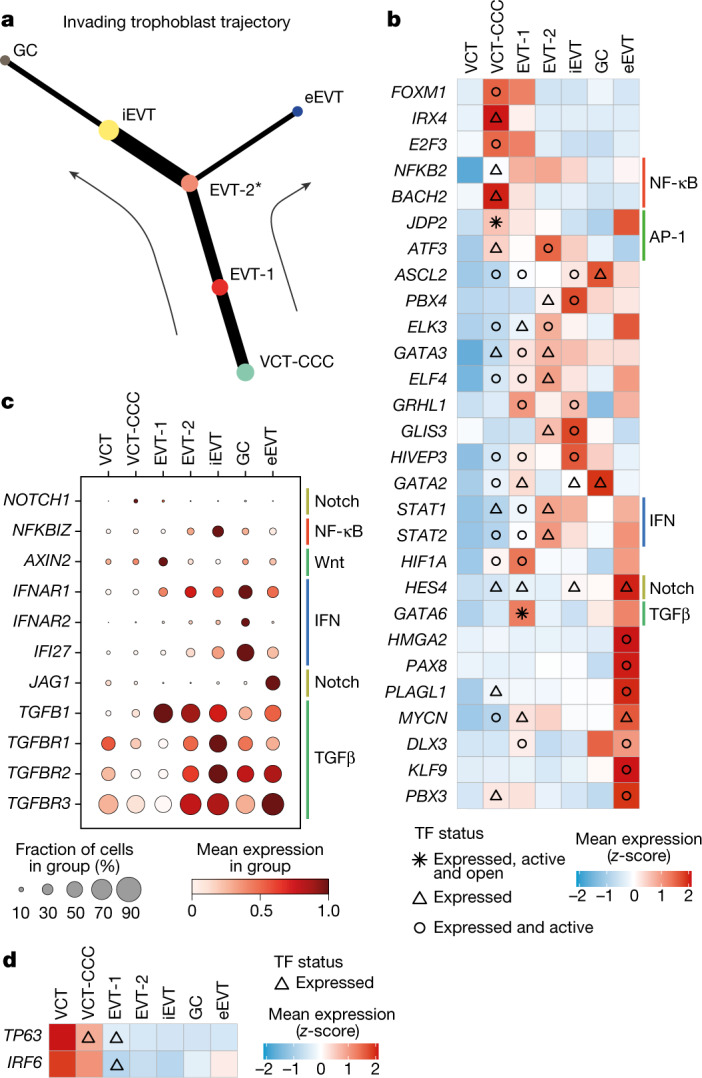
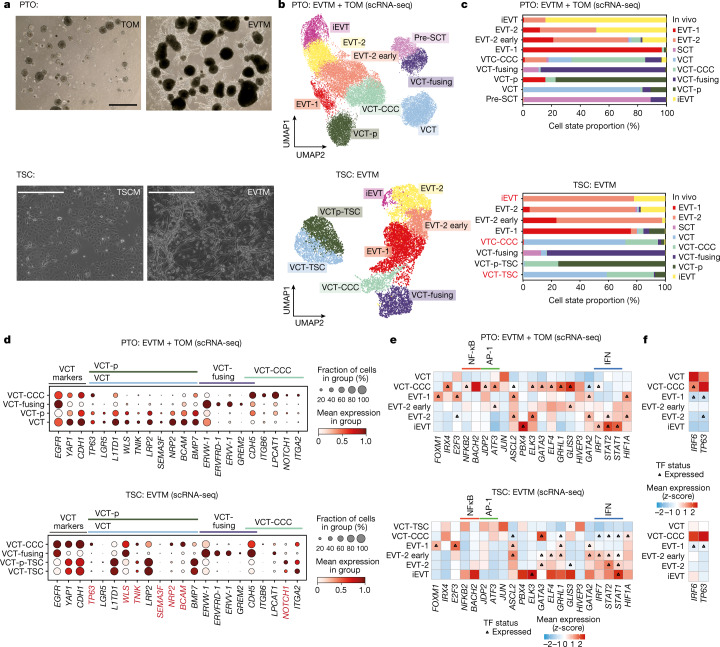
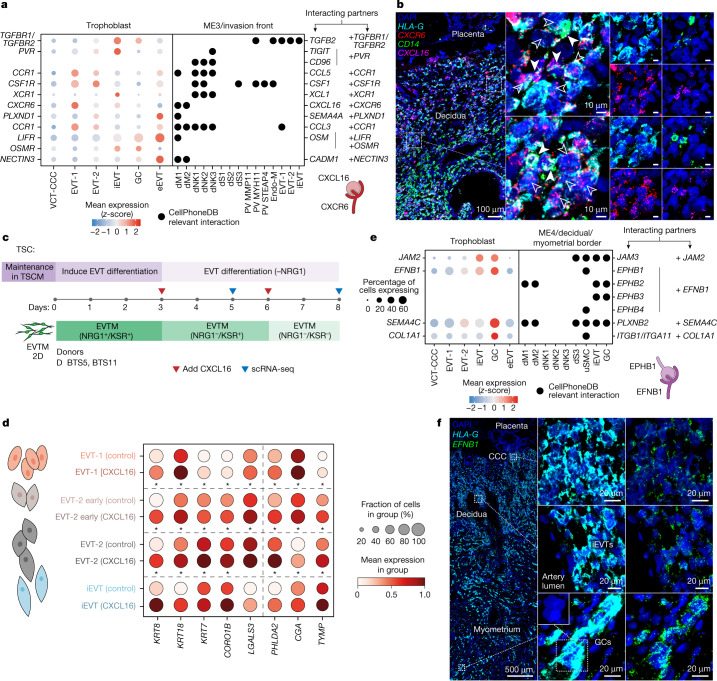
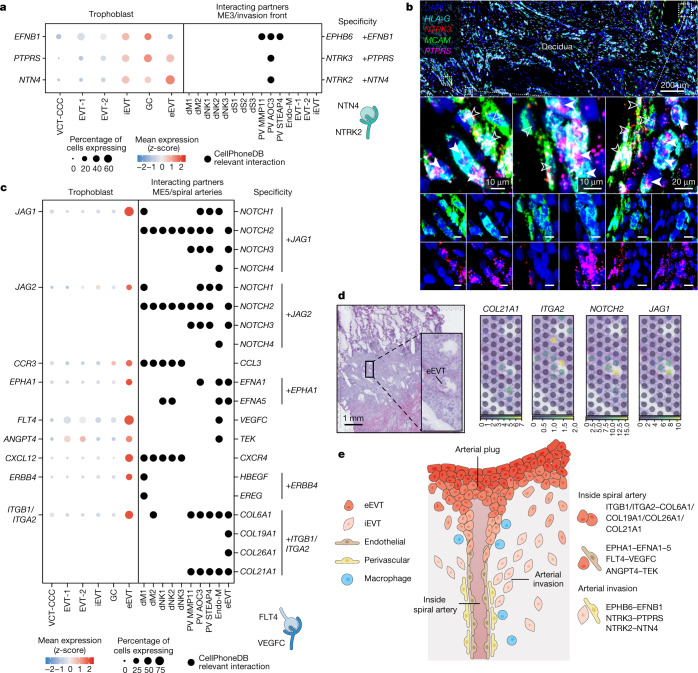
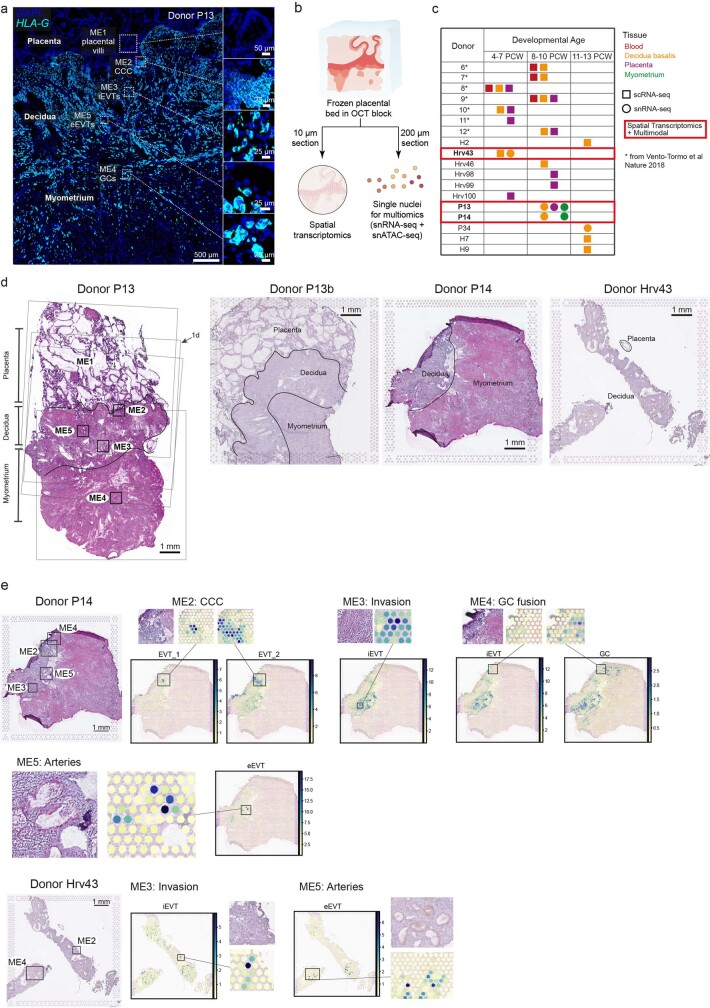
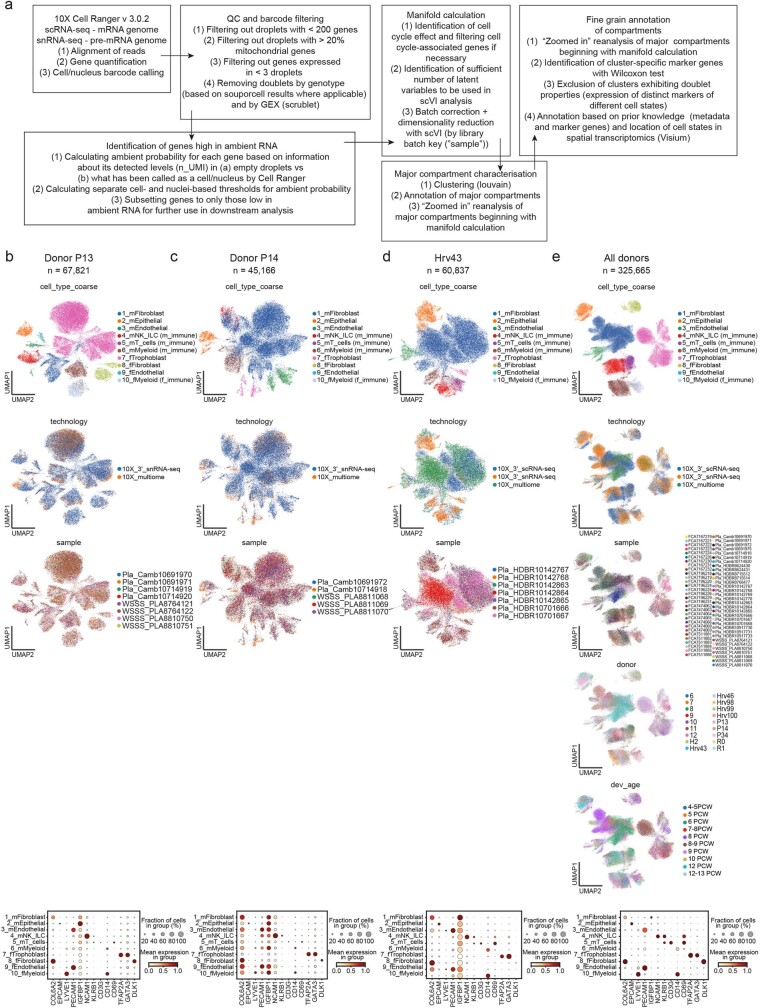
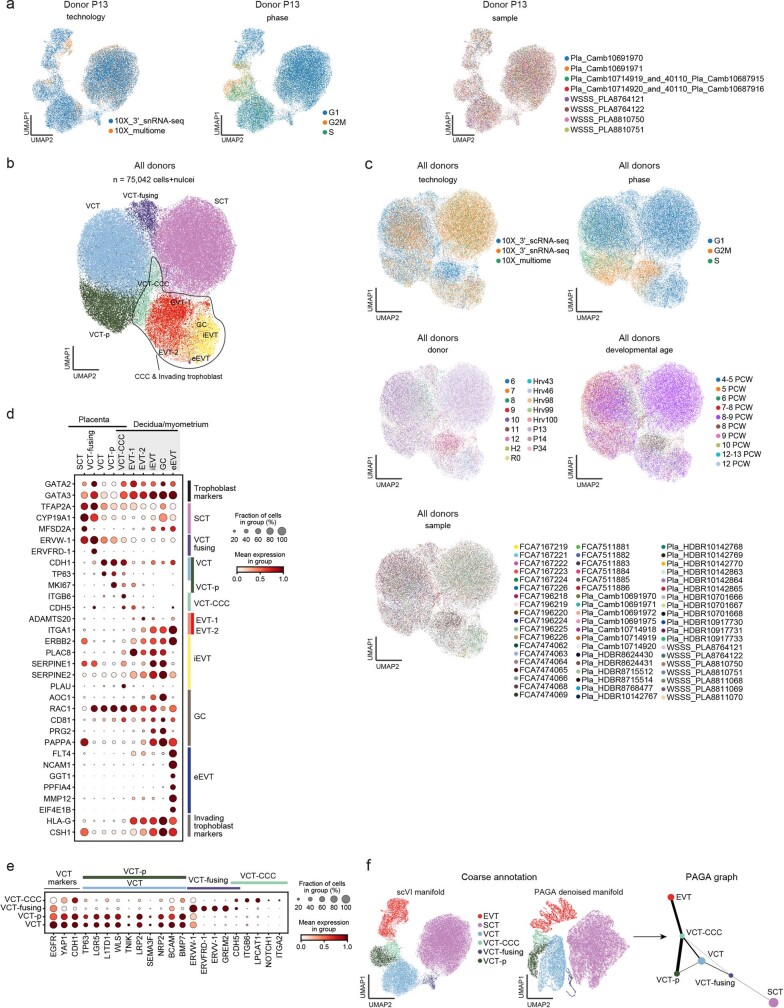
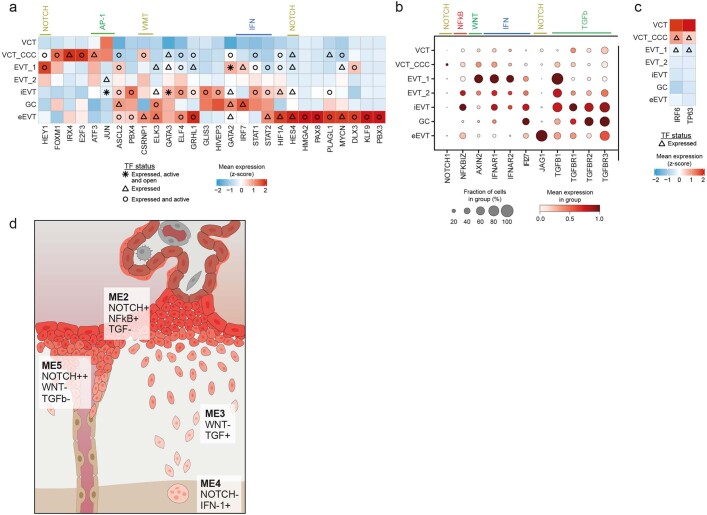
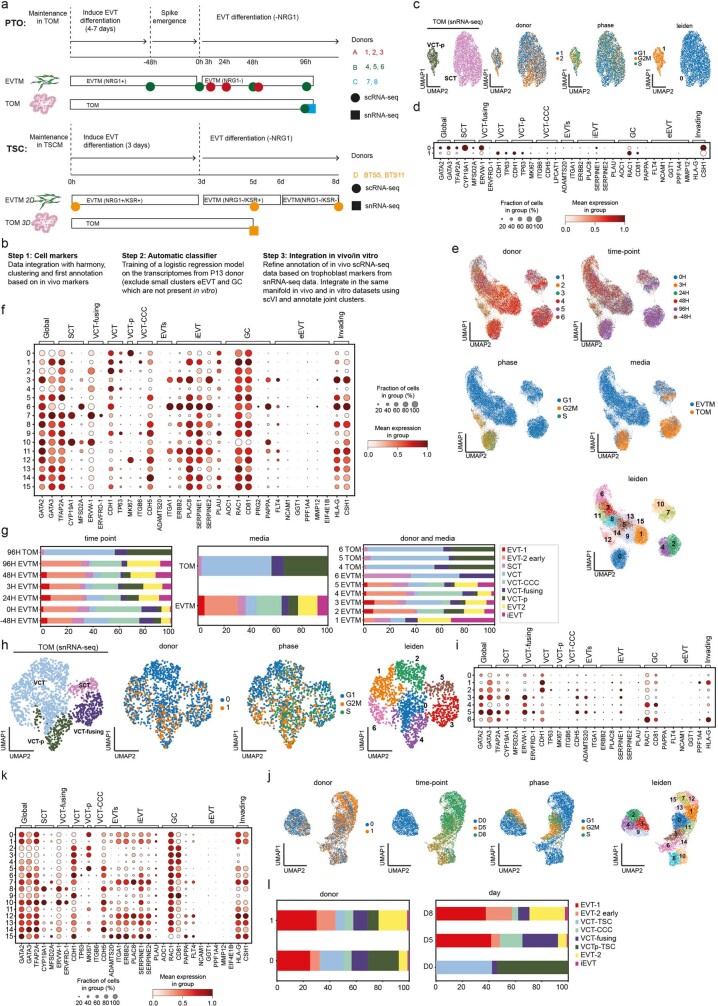
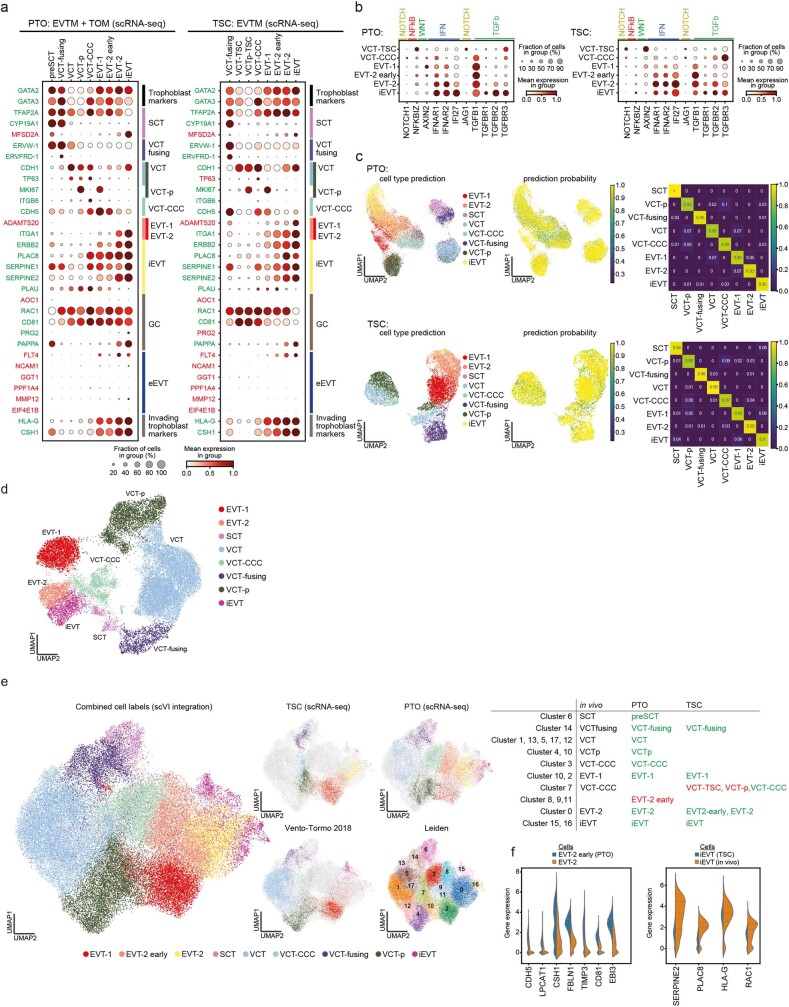
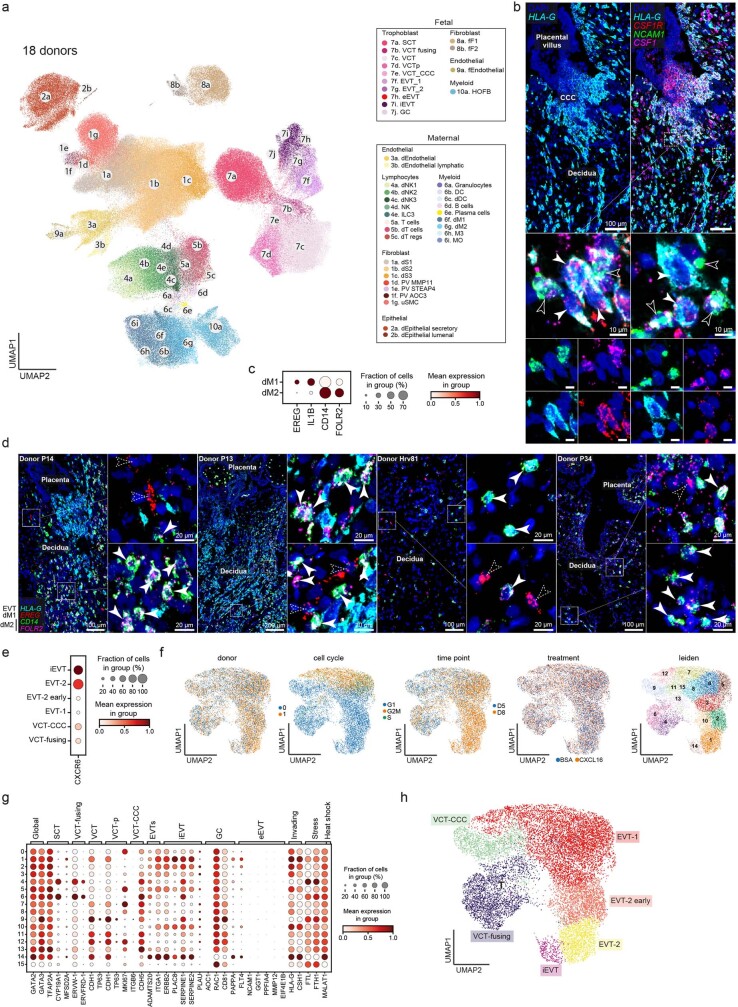
The relationship between the human placenta-the extraembryonic organ made by the fetus, and the decidua-the mucosal layer of the uterus, is essential to nurture and protect the fetus during pregnancy. Extravillous trophoblast cells (EVTs) derived from placental villi infiltrate the decidua, transforming the maternal arteries into high-conductance vessels1. Defects in trophoblast invasion and arterial transformation established during early pregnancy underlie common pregnancy disorders such as pre-eclampsia2. Here we have generated a spatially resolved multiomics single-cell atlas of the entire human maternal-fetal interface including the myometrium, which enables us to resolve the full trajectory of trophoblast differentiation. We have used this cellular map to infer the possible transcription factors mediating EVT invasion and show that they are preserved in in vitro models of EVT differentiation from primary trophoblast organoids3,4 and trophoblast stem cells5. We define the transcriptomes of the final cell states of trophoblast invasion: placental bed giant cells (fused multinucleated EVTs) and endovascular EVTs (which form plugs inside the maternal arteries). We predict the cell-cell communication events contributing to trophoblast invasion and placental bed giant cell formation, and model the dual role of interstitial EVTs and endovascular EVTs in mediating arterial transformation during early pregnancy. Together, our data provide a comprehensive analysis of postimplantation trophoblast differentiation that can be used to inform the design of experimental models of the human placenta in early pregnancy.


Conflict of interest statement

S.A.T. has received remuneration for consulting and scientific advisory board work from Genentech, Biogen, Roche and GlaxoSmithKline as well as Foresite Labs over the past three years. O.S. is a paid scientific advisory board member of Insitro Inc.

Figures

Fig. 1
Fig. 1. Trophoblast cell states in the early maternal–fetal interface.
a, Schematic representation of the maternal–fetal interface during the first trimester of human pregnancy. b, Histological overview (haematoxylin and eosin (H&E) staining) of the implantation site of donor P13 (approximately 8–9 PCW) (n = 1). Black outlines indicate trophoblast microenvironments in space. c, Uniform manifold approximation and projection (UMAP) plot of snRNA-seq of donor P13 trophoblast nuclei in the maternal–fetal interface (n = 37,675 nuclei) coloured by cell state. d, Overview of spatial locations of invading trophoblast cell states in Visium spatial transcriptomics data of a section of donor P13 tissue (the position of the capture area is indicated with an arrow in Extended Data Fig. 1d). Spot colour indicates cell state density computed by cell2location, which is the number of cells of a given cell state in a Visium spot. Invading trophoblast cell states are grouped on the basis of the spatial microenvironment that they represent. e, Dot plots showing normalized, log-transformed and variance-scaled expression of genes (y-axis) characteristic of trophoblast cell states (x-axis) in donor P13 snRNA-seq data. f, Dot plots showing normalized, log-transformed and variance-scaled expression of genes (x-axis) characteristic of villous cytotrophoblast (y-axis) in donor P13 snRNA-seq data.
Fig. 2
Fig. 2. Transcription factors that are active during EVT invasion.
a, Representative tree of EVT differentiation trajectory inferred by StOrder (Methods). The tree shown is inferred with α = 0.4 and β = 0.5 for snRNA-seq and spatial transcriptomics data from donors P13 (5 capture areas), P14 (2 capture areas) and Hrv43 (1 capture area). Tree edge thickness is proportional to connectivity (joint measure inferred from snRNA-seq data and spatial transcriptomics data) between two cell types connected by that edge. The asterisk indicates the bifurcation point. b, Heat map showing z-scores of normalized, log-transformed and scaled expression of transcription factor (TF) genes upregulated during trophoblast invasion in donor P13 snRNA-seq data. The x-axis indicates cell state, the y-axis lists transcription factors. Differential expression (upregulated genes) is tested along the invading trophoblast trajectory (as shown in a) in a retrograde manner using the limma approach (false discovery rate (FDR) < 0.05, with Bonferroni correction for multiple hypotheses testing). Coloured bars to the right of heat map indicate members of selected pathways. IFN, interferon. c, Dot plot showing normalized, log-transformed and variance-scaled expression of genes (x-axis) of signalling molecules upregulated in EVT (y-axis) in donor P13 snRNA-seq data. d, Heat map showing z-score of normalized, log-transformed and variance-scaled expression of transcription factors (x-axis) downregulated during trophoblast invasion in P13 in trophoblast states (y-axis). Differential expression (downregulated genes) is tested along invading trophoblast trajectory (as shown in a) in a retrograde manner using the limma approach (FDR < 0.05, with Bonferroni correction for multiple hypotheses testing).
Fig. 3
Fig. 3. Benchmark of EVTs derived from primary-derived trophoblast organoids and TSCs.
a, Top, phase-contrast images of PTOs plated in a Matrigel droplet and exposed to TOM or EVTM. Scale bar, 1 mm. Representative image of n = 6 experiments. Below, phase-contrast images of TSCs exposed to TSCM or EVTM. Scale bar, 400 μm. Representative image of n = 2 experiments. b, UMAP plot of PTO (n = 26,852 cells) and TSC (n = 9957 cells) scRNA-seq data coloured by cell state. Annotation was performed as indicated in Extended Data Fig. 9b. c, Bar plot representing the proportion (%) of cell states assigned to the in vitro cell states (defined by markers) using a logistic regression classifier trained on the in vivo data. Red text indicates cell states that differ between the annotations given by the logistic regression classifier and the ones given by the expression of canonical markers. d, Dot plot showing normalized, log-transformed and variance-scaled expression of genes (x-axis) characteristic of VCT y-axis in PTOs (top) and TSCs (bottom). Red text indicates genes that differ from the in vivo observed expression pattern. e, Heat map showing z-scores of normalized, log-transformed and variance-scaled expression of transcription factor genes that are known to be upregulated in in vivo trophoblast invasion (see Fig. 2b). The y-axis indicates cell state and the x-axis shows transcription factor genes. f, Heat map showing z-scores of normalized, log-transformed and variance-scaled expression of transcription factor genes that are known to be downregulated in in vivo trophoblast invasion.
Fig. 4
Fig. 4. Predicted ligand–receptor interactions during EVT invasion.
a, Left, dot plot showing z-score of normalized, log-transformed and variance-scaled gene expression of selected receptors (y-axis) that are upregulated in EVT-1, EVT-2 and/or iEVT (ME3) (x-axis). Right, dot plot showing the presence of selected ligands (y-axis) in cells present in ME3 (invasion front; x-axis). Differential expression as in Extended Data Fig. 8a. Schematic in bottom right represents select ligand–receptor interactions. b, Left, high-resolution multiplexed smFISH of placenta–decidua interface showing HLA-G (EVT) and CD14 (decidual macrophage), and CXCL16 and its cognate receptor CXCR6. Dashed outlines indicate areas shown magnified on the right. Centre, filled and unfilled arrows indicate neighbouring CXCL16-expressing decidual macrophages and CXCR6-expressing EVTs, respectively. Images are representative of two donors. c, Schematic representation of the EVT differentiation experimental design, indicating time points and biological replicates in TSC models (n = 2 donors). d, Dot plot showing normalized, log-transformed and variance-scaled expression of genes (x-axis) that are significantly upregulated (limma, FDR < 0.05, with Bonferroni correction for multiple hypotheses testing) in the EVT subsets upon exposure to CXCL16 compared with control. e, Left, dot plot showing z-score of normalized, log-transformed and variance-scaled gene expression of selected receptors (y-axis) that are upregulated in GC (ME4) (x-axis). Right, dot plot showing the presence (y-axis) of selected ligands in cells present in ME4 (decidual–myometrial border; x-axis). Differential expression as in Extended Data Fig. 8a. Schematic in bottom right represents select ligand–receptor interactions. f, High-resolution multiplexed smFISH of the placenta–decidua interface showing HLA-G and EFNB1, demonstrating that expression of EFNB1 is present throughout EVTs, including iEVTs, and higher in GCs. The inset (bottom centre) illustrates the multinucleated nature of GCs. Images representative of two donors. dM, decidual macrophages; dS, decidual stromal cells; endo-M, maternal endotheial cells; PV, perivascular.
Fig. 5
Fig. 5. Predicted ligand–receptor interactions modulating uterine arterial transformation.
a, Left, dot plot showing z-score of normalized, log-transformed and variance-scaled gene expression of selected receptors (y-axis) that are upregulated in iEVT (x-axis). Right, dot plot showing the presence of selected ligands (y-axis) in cells present in ME3 (invasion front; x-axis). Differential expression as in Extended Data Fig. 8a. b, Top, high-resolution smFISH of decidua stained for HLA-G and MCAM (PV marker), and NTRK3 and its receptor PTPRS. Dashed outlines indicate areas that are shown magnified below. Middle and bottom, filled and unfilled arrows indicate neighbouring PTPRS-expressing EVTs and NTRK3-expressing dNK cells, respectively. Images are representative of three donors. c, Left, dot plot showing z-score normalized, log-transformed and variance-scaled gene expression of selected receptors (y-axis) that are upregulated in eEVT (y-axis). In the case of a complex, the expression corresponds to the least expressed subunit of the complex (ITGB1). Right, dot plot showing the presence of selected ligands (y-axis) in cells present in ME5 (spiral arteries; x-axis). Differential expression as in Extended Data Fig. 8a. d, Overview of spatial locations of invading trophoblast cell states in Visium spatial transcriptomics data of a representative section of donor P13 tissue. The position of the capture area is indicated with an arrow in Extended Data Fig. 1d. Spot colour indicates cell state densities computed by cell2location as the number of cells of a given cell state in a Visium spot. e, Schematic representation of the spiral arteries in the first trimester of human pregnancy, highlighting the novel interactions between PV–iEVT, endothelial–eEVT, and eEVT–eEVT.
Extended Data Fig. 1
Extended Data Fig. 1. Spatial transcriptomics of human placental bed.
a: High-resolution imaging of a section of the placenta-decidua interface stained by in situ hybridization (smFISH) for HLA-G, illustrating the depth of invasion of EVTs into the uterus (n = 1). Magnified insets (dashed squares) highlight the HLA-G-negative placental villi, and HLA-G+ EVTs emerging from the CCC to invade the decidua and myometrium. b: Overview of experimental design of the study. c: Cohort composition split by gestational age window (post-conceptional weeks, PCW) representing tissues sampled from each donor and performed assays. Highlighted in red rectangles are the three donors whose tissues have been additionally profiled with spatial transcriptomics (Visium) and multiome assays. d: Histological overview (H&E staining) of donors P13, P14 and Hrv43 tissues with annotations of tissue regions. For the implantation site of donor P13 (~ 8-9 PCW, left); black squares (small) indicate trophoblast microenvironments in space; faint grey squares (large) indicate positioning of tissue on Visium spatial transcriptomics capture areas; arrow indicates representative Visium section further explored in Fig. 1d. For Visium, P13 (n = 5 feature areas, 4 consecutive slides with overlapping positions and 1 slide from an additional tissue block - P13b), P14 (n = 2 feature areas, consecutive slides with same position), Hrv43 (n = 1 feature area). e: Cell state locations (derived with cell2location) in representative Visium sections of donors P14 and Hrv43 highlighting relevant spatial trophoblast microenvironments. Spot colour indicates cell state densities computed by cell2location as the number of cells of a given cell state in a Visium spot. Cytotrophoblast cell column (CCC), extravillous trophoblast (EVT), interstitial EVT (iEVT), giant cells (GC), endovascular EVT (eEVT), single-cell RNA sequencing (scRNA-seq), single-nuclei RNA sequencing (snRNA-seq), microenvironment (ME), Hematoxylin and Eosin (H&E).
Extended Data Fig. 2
Extended Data Fig. 2. scRNA-seq and snRNA-seq data quality control and data analysis overview.
a: Overview of the computational pipeline implemented for analysis of in vivo scRNA-seq and snRNA-seq data. Data integrated with scVI. be: (top) UMAP (uniform manifold approximation and projection) scatterplots of donors P13 (n = 67,821 nuclei), P14 (n = 45,166 nuclei), Hrv43 (n = 60,837 nuclei and cells) and all donors’ (n = 325,665 nuclei and cells, m = 18 donors) scRNA-seq and snRNA-seq data (b-e respectively) for all recovered cell states, coloured by coarse grain compartment annotation and metadata labels: assay, sample (10X library), donor and developmental age. (bottom) Dot plots show normalised, log-transformed and variance-scaled expression of genes characteristic of coarse grain compartment (X-axis) in donors profiled (Y-axis). Single-cell RNA sequencing (scRNA-seq), single-nuclei RNA sequencing (snRNA-seq), maternal (m), fetal (f), natural killer (NK), innate lymphocytes (ILC), single-cell RNA sequencing (scRNA-seq), single-nuclei RNA sequencing (snRNA-seq).
Extended Data Fig. 3
Extended Data Fig. 3. snRNA-seq and scRNA-seq trophoblast data analysis overview.
a: UMAP (uniform manifold approximation and projection) scatterplots of donor P13 snRNA-seq data (n = 37,675 nuclei) for all trophoblast cell states coloured by (from left to right) assay, cell cycle phase of the nuclei and sample (10X library). Please note: bioinformatics analyses used cannot distinguish between G0 and G1. b: UMAP scatterplot of integrated snRNA-seq and scRNA-seq of all donors’ (n = 75,042 nuclei and cells, m = 17 donors with trophoblast present) trophoblast cell states in the maternal-fetal interface coloured by cell state. c: UMAP scatterplots of all donors’ scRNA-seq and snRNA-seq data for all donors’ (n = 75,042 nuclei and cells, m = 17 donors with trophoblast present) trophoblast cell states coloured by assay, sample (10X library), cell cycle phase of the cells/nuclei, donor and developmental age. d: Dot plot showing normalised, log-transformed and variance-scaled expression of genes (Y-axis) characteristic of trophoblast cell states (X-axis) in all donors (m = 17 donors with trophoblast present). e: Dot plot showing normalised, log-transformed and variance-scaled expression of genes (X-axis) characteristic of VCT cell states (Y-axis) in all donors (m = 17 donors with trophoblast present). f: Results of PAGA trajectory inference of all trophoblast cell states in donor P13 snRNA-seq data. (left) main manifold, center: denoised PAGA manifold, (right) PAGA reconstruction of putative trajectory tree for all trophoblast cell states. For the purpose of this analysis all EVTs have been united in annotation under the ‘EVT’ label. Syncytiotrophoblast (SCT), villous cytotrophoblast (VCT), cytotrophoblast cell column (CCC), proliferative (p), extravillous trophoblast (EVT), interstitial EVTs (iEVTs), giant cells (GC), endovascular EVT (eEVT), single-cell RNA sequencing (scRNA-seq), single-nuclei RNA sequencing (snRNA-seq).
Extended Data Fig. 4
Extended Data Fig. 4. Analysis of extravillous trophoblast invasion trajectory using stOrder.
a: Schematic overview of StOrder approach representing the workflow of joint cell differentiation trajectory inference from gene expression and spatial transcriptomics data (See methods). b: (Left) Main UMAP (uniform manifold approximation and projection) scatterplot and (right) denoised manifold used for PAGA trajectory inference of all trophoblast cell states in donor P13 single-nuclei RNA sequencing (snRNA-seq) data. c: PAGA reconstruction of putative trajectory tree for all extravillous trophoblast cell states. This corresponds to the trajectory tree inferred by stOrser with α = 1, β = 1 parameters from donor P13 snRNA-seq data and spatial transcriptomics data of donors P13 (5 capture areas), P14 (2 capture areas) and Hrv43 (1 capture area). d: Heatmap of binary success matrix of stOrder approach for pairs of (α,β), values (along Y and X axes, respectively). Assigned matrix value is 1 if a tree of correct topology has been reconstructed for that pair of (α,β) values, and 0 if no tree of correct topology was reconstructed. e: Reconstruction of putative invading trophoblast trajectory tree based solely on spatial data inferred by stOrder with α = 0, β = 1 parameters from donor P13 snRNA-seq data and spatial transcriptomics data of donors P13 (5 chips), P14 (2 chips) and Hrv43 (1 chip). Villous cytotrophoblast (VCT), cytotrophoblast cell column (CCC), extravillous trophoblast (EVT), interstitial EVTs (iEVTs), giant cells (GC), endovascular EVT (eEVT).
Extended Data Fig. 5
Extended Data Fig. 5. Analysis of extravillous trophoblast invasion trajectory using Slingshot.
a: Minimum spanning tree of donor P13 trophoblast single-nuclei RNA sequencing (snRNA-seq) data computed by Slingshot, visualised on the UMAP (uniform manifold approximation and projection) embedding of P13 donor trophoblast cells from Fig. 1c (n = 37,675 nuclei). Bigger black dots indicate trophoblast states. Smaller dots’ colour indicates pseudotime. b: Heatmap showing normalised and log-transformed expression values of the 567 genes associated with trophoblast pseudotime, estimated with tradeSeq (p-value < 1x10⁻⁶ and mean LogFC > 0.5). Cells in rows are sorted according to the predicted pseudotime. Genes are sorted according to the trophoblast state where gene expression peaks. Marker genes are highlighted. Syncytiotrophoblast (SCT), villous cytotrophoblast (VCT), cytotrophoblast cell column (CCC), extravillous trophoblast (EVT), interstitial EVTs (iEVTs), giant cells (GC), endovascular EVT (eEVT).
Extended Data Fig. 6
Extended Data Fig. 6. Histological characterisation of eEVTs.
a: Estimated amount of mRNA computed by cell2location (colour intensity) contributed by each cell population to each spot (colour) shown over the hematoxylin and eosin (H&E) image of donor P13 implantation site (n = 1). b: (Top) High-resolution imaging of sections of the placenta-decidua interface from two donors (n = 2, donor ID is indicated in each panel), stained by multiplexed single molecule fluorescence in situ hybridization (smFISH) for HLA-G and NCAM1; dashed squares indicate areas shown magnified below. (Middle) magnified insets highlight an artery containing aggregating eEVTs (left) and cytotrophoblast cell columns; in the latter, solid arrows indicate sporadic nascent NCAM1+ cells shown magnified below (bottom). c: Expression of NCAM1 (marker of eEVT) with IHC in first-trimester decidual tissue. Nuclei are counterstained with hematoxylin. Representative images from three different donors (n = 3).
Extended Data Fig. 7
Extended Data Fig. 7. Multimodal analysis of extravillous trophoblast invasion.
a: Overview of the computational pipeline implemented for analysis of multimodal data. b-c: UMAP (uniform manifold approximation and projection) scatterplot of multimodal snATAC-seq data from donors P13, P14 and Hrv43 (n = 52,798 nuclei) coloured by cell state (b), donor, sample (10X library) or unbiased clustering labels (c). Data is annotated based on the corresponding single-nuclei RNA sequencing (snRNA-seq) cell state assignment. d: UMAP scatterplot of integrated multimodal single-nuclei ATAC sequencing (snATAC-seq) data for trophoblast only from donors P13, P14 and Hrv43 (n = 7449 nuclei) coloured by cell state, donor and sample (10X library). e: UMAP scatterplot of multiome (snRNA-snATACseq) data of invading trophoblast cells from donor P13 (n = 1605 nuclei) coloured by cell state. The manifold is calculated based on dimensionality reduction performed by MEFISTO (model with n = 9 factors). f: (Left) UMAP scatterplot of multiome (snRNA-snATACseq) data of invading trophoblast cells from donor P13 (n = 1605 nuclei) coloured by sample. The manifold is calculated based on dimensionality reduction performed by MEFISTO (model with n = 9 factors). (Right) Scatterplot of UMAP coordinates obtained from the RNA expression data that were used as covariates for MEFISTO, coloured by cell state. g: Heatmap representing percentage of variance explained by each MEFISTO factor in each data modality. h: Smoothness along differentiation estimated with MEFISTO. i: UMAP scatterplot of multiome (snRNA-snATACseq) data of invading trophoblast cells from donor P13 (n = 1605 nuclei) coloured by cell cycle phase and MEFISTO factor values for important selected factors. j: Spearman’s rank correlation coefficients of each latent factor learned with MEFISTO and the number of genes per counts in snATAC-seq data (multiome). k: Gene set (RNA) enrichment analysis overview of MEFISTO factor 2 using two-sided parametric t-test, FDR is used to rank gene sets. l: Peak set (ATAC) enrichment analysis overview of MEFISTO factor 10 using two-sided parametric t-test, FDR is used to rank peak sets. Villous cytotrophoblast (VCT), cytotrophoblast cell column (CCC), proliferative (p), extravillous trophoblast (EVT), interstitial EVTs (iEVTs), giant cells (GC), endovascular EVT (eEVT), dendritic cells (DC), lymphatic (l), maternal (m), fetal (f) Hofbauer cells (HOFB), innate lymphocytes (ILC), macrophages (M), monocytes (MO), natural killer (NK), perivascular (PV), decidual (d), epithelial (epi), stromal (S), fibroblasts (F), uterine smooth muscle cells (uSMC).
Extended Data Fig. 8
Extended Data Fig. 8. Transcription factors active in extravillous trophoblast cell states (all donors).
a: Heatmap showing z-score of normalised, log-transformed and variance-scaled expression of transcription factors (TFs) upregulated during trophoblast invasion in all donors (n = 17 donors with trophoblast present). Y-axis indicates cell state, X-axis lists TFs. Differential expression (upregulated genes) is tested along invading trophoblast trajectory (as shown in Fig. 2a) in a retrograde manner using limma approach (FDR < 0.05, with Bonferroni correction for multiple hypotheses testing. b: Dot plot showing normalised, log-transformed and variance-scaled expression of genes (X-axis) of signalling molecules upregulated in EVT (Y-axis) in all donors (n = 17 donors with trophoblast present). c: Heatmap showing z-score of normalised, log-transformed and scaled expression of TFs downregulated during trophoblast invasion in all donors (n = 17 donors with trophoblast present). Y-axis indicates cell state, X-axis lists TFs. Differential expression (downregulated genes) is tested along invading trophoblast trajectory (as shown in Fig. 2a) in a retrograde manner using limma approach (FDR < 0.05, with Bonferroni correction for multiple hypotheses testing). d: Schematic representation of signalling pathways in distinct spatial microenvironments. Villous cytotrophoblast (VCT), cytotrophoblast cell column (CCC), extravillous trophoblast (EVT), interstitial EVTs (iEVTs), giant cells (GC), endovascular EVT (eEVT), microenvironment (ME), transcription factors (TFs).
Extended Data Fig. 9
Extended Data Fig. 9. scRNA-seq and snRNA-seq data quality control and analysis overview of the trophoblast in vitro models.
a: Schematic representation of the extravillous trophoblast (EVT) differentiation experimental design, indicating time points and biological replicates in both primary trophoblast organoids (PTO, n = 6 scRNA-seq and n = 2 for snRNA-seq) and trophoblast stem cell (TSC, n = 2 for both scRNA-seq and snRNA-seq) models. b: Diagram showing the annotation of the in vitro models. Firstly, we analysed the datasets in four separate manifolds and annotated each of the cell states based on canonical markers. Secondly, we projected the trophoblast in vivo reference data onto the in vitro trophoblast subsets by building a logistic regression classifier that we trained on P13 snRNA-seq in vivo dataset. We excluded eEVT and GC cells as these are scarcely represented and our marker data show they are not present in the in vitro cultures. Thirdly, we integrated scRNA-seq data from in vivo and in vitro conditions using scVI, and used this manifold to calculate differentially expressed genes (DEG) amongst subsets. c: UMAP (uniform manifold approximation and projection) scatterplots of snRNA-seq (n = 3928 nuclei) of PTOs coloured by cell state, donor (n = 2 donors), cell cycle phase and unbiased clustering using leiden. Sample integration was performed with Harmony. d: Dot plot showing normalised, log-transformed and variance-scaled expression of genes (X-axis) of main trophoblast subsets (Y-axis) in each of the clusters identified by unbiased clustering (a) in snRNA-seq of primary trophoblast organoids (PTOs). e: UMAP scatterplots of scRNA-seq of PTOs derived from n = 6 donors and coloured by donor, time-point, cell cycle phase, media cultured and unbiased clustering using leiden. f: Dot plot showing normalised, log-transformed and variance-scaled expression of genes (X-axis) of main trophoblast subsets in each of the clusters identified by unbiased clustering (c) in scRNA-seq of PTOs (Y-axis). g: Bar plots showing the proportion (%) of final cell states identified in data of each time point (left), media (center) and donor (right) for PTOs scRNA-seq. h: UMAP scatterplots of snRNA-seq (n = 1563 nuclei) of trophoblast organoids from trophoblast stem cells (TSC) coloured by cell state, donor, cell cycle phase and unbiased clustering using leiden. Sample integration was performed with Harmony. i: Dot plot showing normalised, log-transformed and variance-scaled expression of genes (X-axis) of main trophoblast subsets (Y-axis) in each of the clusters identified by unbiased clustering (f) in snRNA-seq of trophoblast stem cells (TSC). j: UMAP scatterplots of scRNA-seq of EVT derived from TSC coloured by donor, time-point, cell cycle phase and unbiased clustering using leiden. k: Dot plot showing normalised, log-transformed and variance-scaled expression of genes (X-axis) of main trophoblast subsets in each of the clusters identified by unbiased clustering (j) in scRNA-seq of trophoblast stem cells (TSC) (Y-axis). l: Bar plots showing the proportion (%) of final cell states identified in each donor’s data (left) and time-point (right) for TSCs scRNA-seq. Trophoblast organoid media (TOM), syncytiotrophoblast (SCT), villous cytotrophoblast (VCT), cytotrophoblast cell column (CCC), proliferative (p), extravillous trophoblast (EVT), EVT media (EVTM), interstitial EVT (iEVT), giant cells (GC), endovascular EVT (eEVT), single-cell RNA sequencing (scRNA-seq), single-nuclei RNA sequencing (snRNA-seq).
Extended Data Fig. 10
Extended Data Fig. 10. Annotation and benchmark of trophoblast in vitro models.
a: Dot plots showing normalised, log-transformed and variance-scaled expression of genes (Y-axis) characteristic of trophoblast cell states (X-axis) in primary trophoblast organoids (PTO, left) and trophoblast stem cell (TSC, right) models. Marked in red are genes that differ from the in vivo observed expression pattern. b: Dot plot showing normalised, log-transformed and variance-scaled expression of genes (X-axis) of signalling molecules known to be upregulated in in vivo trophoblast invasion plotted in trophoblast organoids (Y-axis). c: UMAP (uniform manifold approximation and projection) scatterplot of PTO single-cell RNA sequencing (scRNA-seq data, n = 26,853 cells) coloured by predicted cell state (top left) and probability (top center) according to our logistic regression model. Only in vivo data from donor P13 (snRNA-seq) was considered for the training. Confusion matrix with predictions on test set based on common features with PTO (Top right). UMAP scatterplot of TSC scRNA-seq data (n = 9957 cells) coloured by predicted cell state (bottom left) and probability (bottom center) according to our logistic regression model. Only in vivo data from donor P13 (snRNA-seq) was considered for the training. Confusion matrix with predictions on test set based on common features with TSC (Bottom right). d: UMAP scatterplot of scRNA-seq data (n = 23,519 cells) from re-annotated using markers from Fig. 1e. e: (Left and center) Integrated manifold (in vivo and in vitro) using scVI and coloured by cell state and specific conditions. Integration is performed with scVI. (Top right) Table displaying organoid-independent annotation for each scVI-integrated cluster. Organoid annotation matching in vivo labels displayed in green, discordant annotation in red. f: Violin plot showing normalised and log-transformed expression of differentially expressed genes (DEGs, limma, FDR < 0.05, with Bonferroni correction for multiple hypotheses testing) when comparing early EVT-2 in PTO vs in vivo EVT-2. (Right) Violin plot showing normalised and log-transformed expression of DEG when comparing iEVT in TSC vs in vivo iEVT. Primary trophoblast organoids (PTO), trophoblast stem cells (TSC), trophoblast organoid media (TOM), syncytiotrophoblast (SCT), villous cytotrophoblast (VCT), cytotrophoblast cell column (CCC), proliferative (p), extravillous trophoblast (EVT), interstitial EVT (iEVT), giant cells (GC), endovascular EVT (eEVT).
Extended Data Fig. 11
Extended Data Fig. 11. Predicted interactions between trophoblast and maternal immune cells.
a: UMAP (uniform manifold approximation and projection) scatterplot of single-cell RNA sequencing (scRNA-seq) and single-nuclei RNA sequencing (snRNA-seq) data of the 18 donors described in Extended Data Fig. 1c of the maternal-fetal interface (n = 325,665 cells and nuclei) coloured by cell state. Integration was performed with scVI. b: (Left) High-resolution imaging of a section of the placenta-decidua interface stained by smFISH for HLA-G, highlighting EVTs invading the decidua from the CCC. (Right) multiplexed co-staining with NCAM1 (dNK marker), CSF1 and cognate receptor CSF1R; dashed squares indicate areas shown magnified to right. (Bottom) solid and outlined arrows indicate neighbouring CSF1R-expressing EVTs and CSF1-expressing dNK cells, respectively. Representative image of samples from three donors. c: Dot plot showing normalised, log-transformed and variance-scaled gene expression of macrophage markers (X-axis) in data from (a) (Y-axis). d: High-resolution imaging of the placenta-decidua interface stained by multiplexed smFISH for HLA-G (EVTs), EREG (dM1), and CD14 and FOLR2 (dM2) for n = 4 donors (donor ID is specified in each panel). e: Dot plot showing normalised, log-transformed and variance-scaled expression of CXCR6 (X-axis) on the EVT subsets present in TSC (n = 2). f: UMAP scatterplots of scRNA-seq of TSC (CXCL16 and BSA conditions) coloured by donor, cell cycle phase, time point, treatment and unbiased clustering using leiden (n = 2). g: Dot plot showing normalised, log-transformed and variance-scaled expression of marker genes of the main trophoblast subsets (X-axis) in cell clusters defined in (f) (Y-axis) from the integrated manifold of CXCL16 and BSA conditions in trophoblast stem cell (TSC) scRNA-seq (n = 2). h: UMAP scatterplot of scRNA-seq of TSC coloured by cell state (n = 2). Villous cytotrophoblast (VCT), cytotrophoblast cell column (CCC), proliferative (p), extravillous trophoblast (EVT), interstitial EVTs (iEVTs), giant cells (GC), endovascular EVT (eEVT), dendritic cells (DC), lymphatic (l), maternal (m), fetal (f), Hofbauer cells (HOFB), innate lymphocytes (ILC), macrophages (M), monocytes (MO), natural killer (NK), perivascular (PV), decidual (d), epithelial (epi), stromal (S), fibroblasts (F), uterine smooth muscle cells (uSMC), bovine serum albumin (BSA).
Extended Data Fig. 12
Extended Data Fig. 12. Interactions between trophoblast and perivascular (PV) cells.
a: Dot plot showing normalised, log-transformed and variance-scaled expression of perivascular (PV) cell state markers. b: UMAP (uniform manifold approximation and projection) scatterplot of scRNA-seq of PV cells (n = 2768 cells) coloured by the scaled gene expression of PV cell state markers. c: (Top) High-resolution imaging of adjacent sections of maternal-fetal interface stained by multiplexed smFISH for three gene panels, from two donors. Dashed squares indicate areas shown magnified underneath (middle and below), highlighting PV1-AOC3, PV1-STEAP4, and PV2-MMP11 cells expressing each of their three respective marker genes. Solid arrows indicate relatively sparse PV1-STEAP4 cells in second and fifth columns. d: (Top) High-resolution imaging of a section of decidua stained by smFISH for HLA-G (EVTs) multiplexed with MYH11, FNDC1, and NTRK2 (PV1-AOC3); dashed squares indicate areas shown magnified below. (Middle) solid and outlined arrows indicate neighbouring PV1-AOC3 cells expressing NTRK2 and EVTs, respectively. Representative image of samples from two donors. e: (Left) High-resolution imaging of a section of decidua stained by multiplexed smFISH for HLA-G, NCAM1, and CXCL12. Dashed squares highlight arteries containing HLA-G+ NCAM1+ eEVTs expressing CXCL12, shown magnified to right. Representative image of samples from two donors.

Comment in

References

    1. Pijnenborg R, Vercruysse L, Hanssens M. The uterine spiral arteries in human pregnancy: facts and controversies. Placenta. 2006;27:939–958. doi: 10.1016/j.placenta.2005.12.006. - DOI - PubMed
    1. Brosens I, Pijnenborg R, Vercruysse L, Romero R. The ‘great obstetrical syndromes’ are associated with disorders of deep placentation. Am. J. Obstet. Gynecol. 2011;204:193–201. doi: 10.1016/j.ajog.2010.08.009. - DOI - PMC - PubMed
    1. Turco MY, et al. Trophoblast organoids as a model for maternal–fetal interactions during human placentation. Nature. 2018;564:263–267. doi: 10.1038/s41586-018-0753-3. - DOI - PMC - PubMed
    1. Haider S, et al. Self-renewing trophoblast organoids recapitulate the developmental program of the early human placenta. Stem Cell Rep. 2018;11:537–551. doi: 10.1016/j.stemcr.2018.07.004. - DOI - PMC - PubMed
    1. Okae H, et al. Derivation of human trophoblast stem cells. Cell Stem Cell. 2018;22:50–63.e6. doi: 10.1016/j.stem.2017.11.004. - DOI - PubMed

Publication types

MeSH terms

Substances