. 2023 Apr;616(7956):339-347.
doi: 10.1038/s41586-023-05891-2. Epub 2023 Mar 29.

Ornithine aminotransferase supports polyamine synthesis in pancreatic cancer

Affiliations

Ornithine aminotransferase supports polyamine synthesis in pancreatic cancer

Min-Sik Lee et al. Nature. 2023 Apr.

Abstract

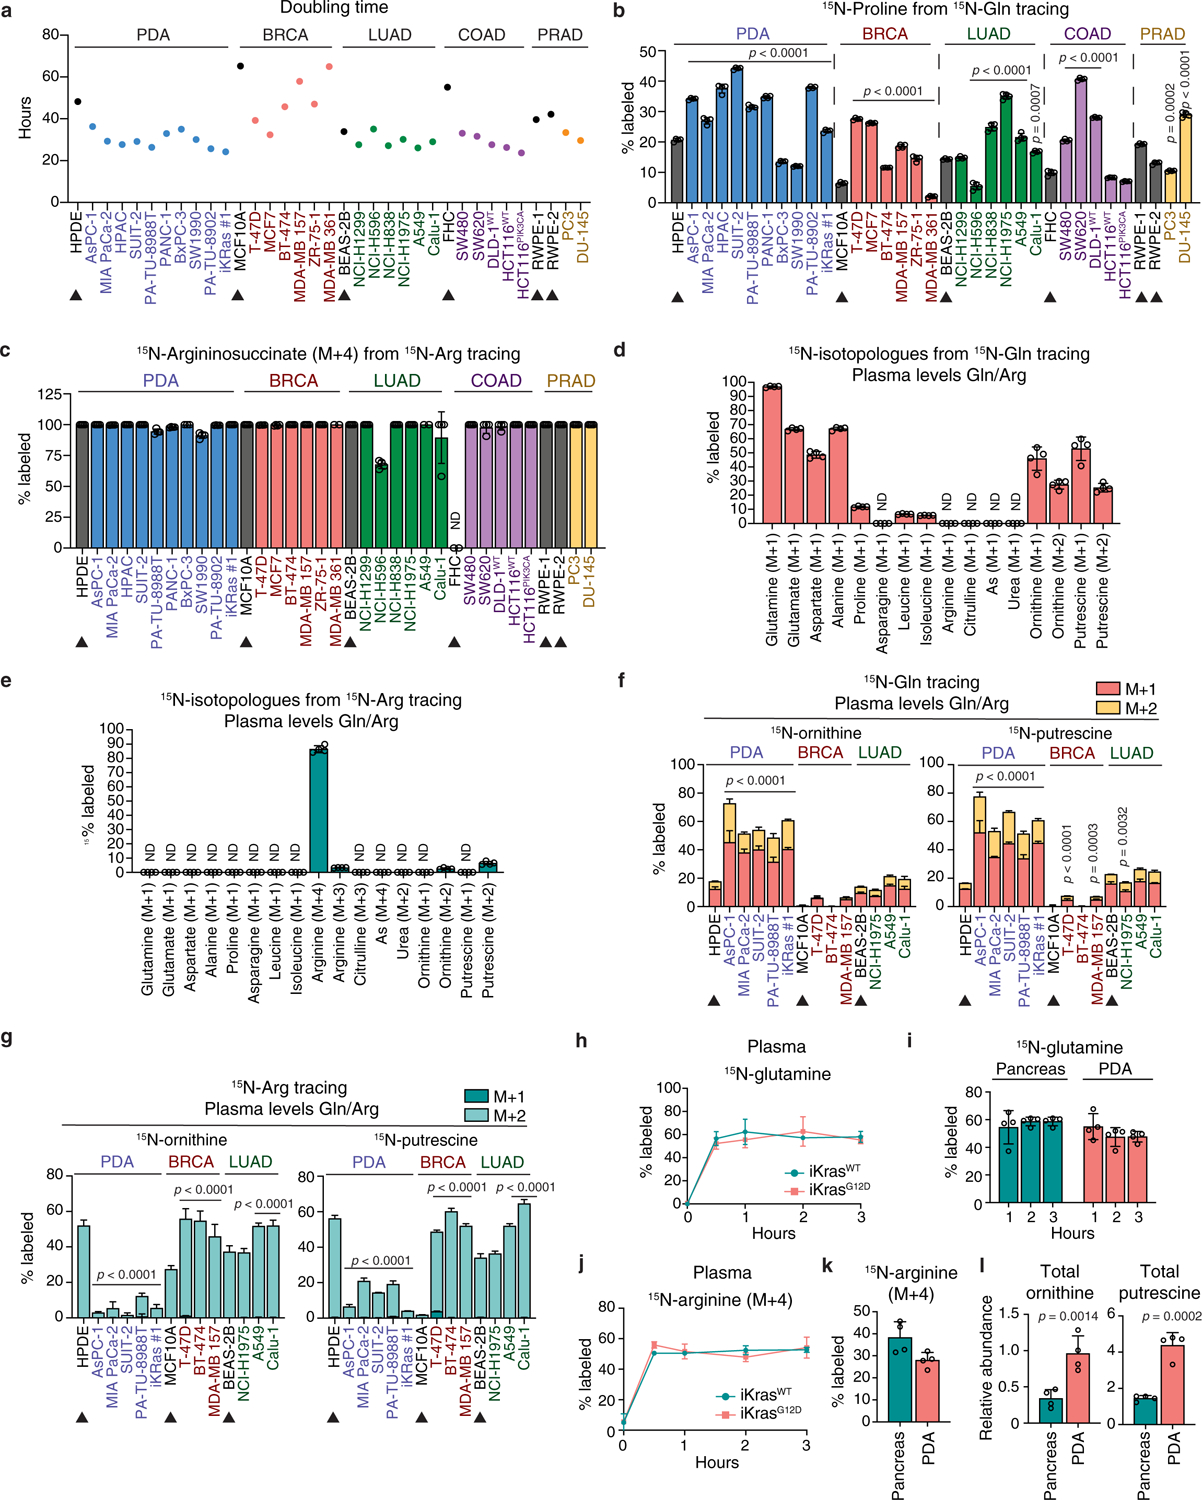
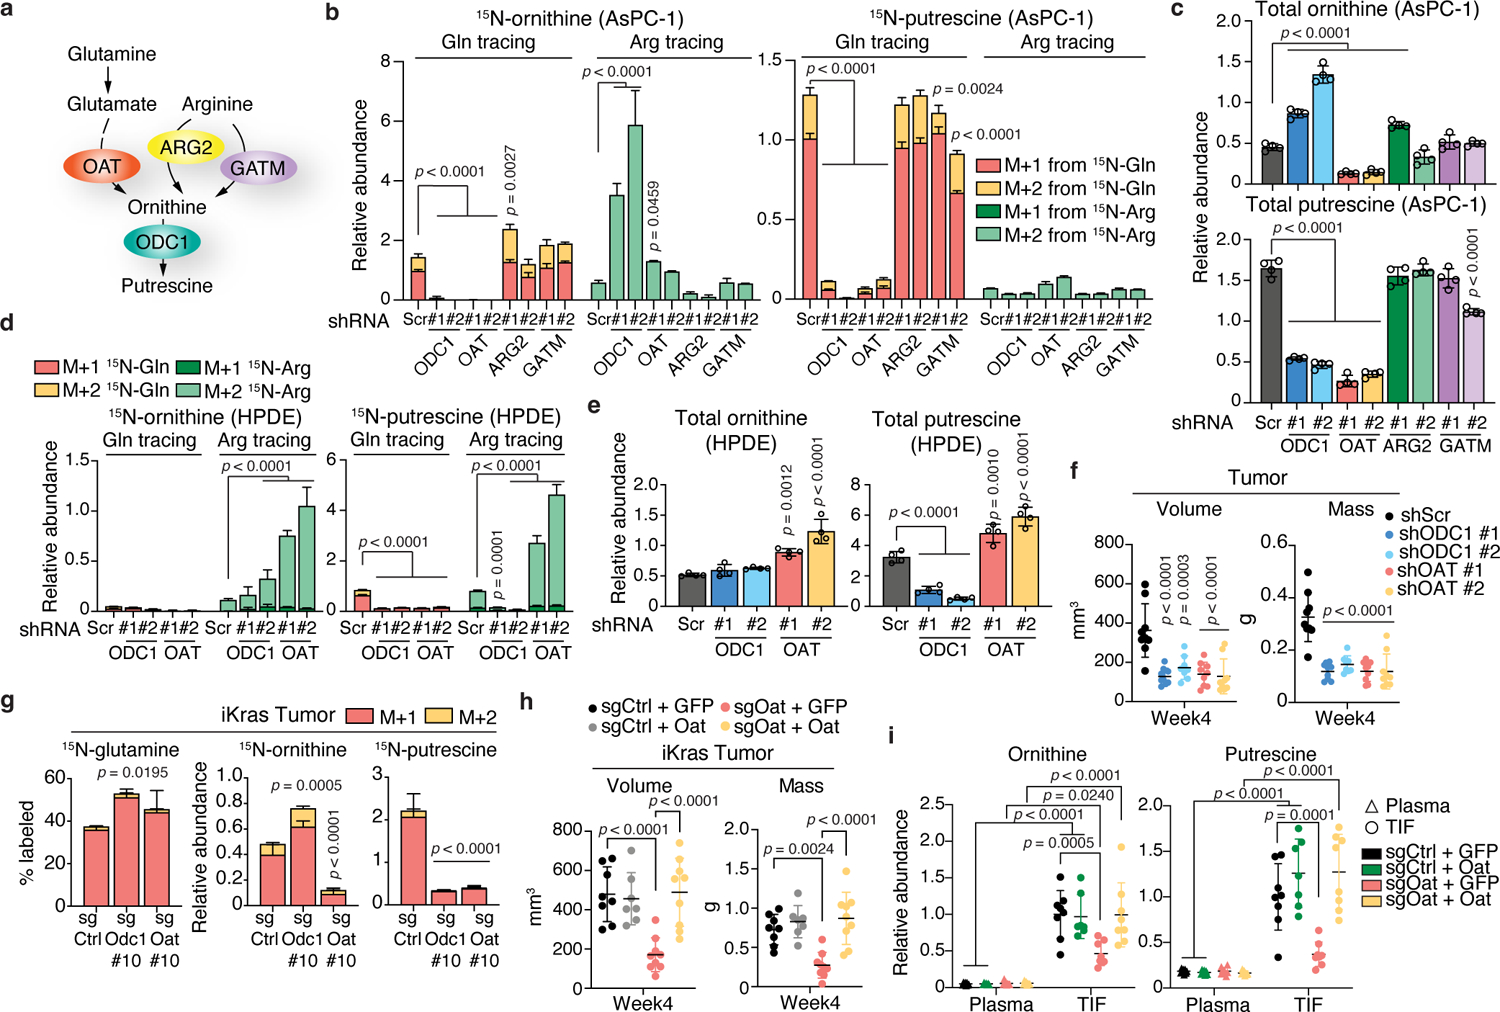
There is a need to develop effective therapies for pancreatic ductal adenocarcinoma (PDA), a highly lethal malignancy with increasing incidence1 and poor prognosis2. Although targeting tumour metabolism has been the focus of intense investigation for more than a decade, tumour metabolic plasticity and high risk of toxicity have limited this anticancer strategy3,4. Here we use genetic and pharmacological approaches in human and mouse in vitro and in vivo models to show that PDA has a distinct dependence on de novo ornithine synthesis from glutamine. We find that this process, which is mediated through ornithine aminotransferase (OAT), supports polyamine synthesis and is required for tumour growth. This directional OAT activity is usually largely restricted to infancy and contrasts with the reliance of most adult normal tissues and other cancer types on arginine-derived ornithine for polyamine synthesis5,6. This dependency associates with arginine depletion in the PDA tumour microenvironment and is driven by mutant KRAS. Activated KRAS induces the expression of OAT and polyamine synthesis enzymes, leading to alterations in the transcriptome and open chromatin landscape in PDA tumour cells. The distinct dependence of PDA, but not normal tissue, on OAT-mediated de novo ornithine synthesis provides an attractive therapeutic window for treating patients with pancreatic cancer with minimal toxicity.


Conflict of interest statement

S.K.D. received research funding unrelated to this project from Eli Lilly and Company, Novartis Pharmaceuticals, Genocea, and Bristol-Myers Squibb and is a founder, science advisory board member (SAB) and equity holder in Kojin. M.M.-K. has served as a compensated consultant for AstraZeneca, BMS, Sanofi and Janssen Oncology and has received loyalties from Elsevier, all unrelated to the current work.

Figures

Extended Data Fig. 1 |
Extended Data Fig. 1 |. PDA favors the use of glutamine over arginine for polyamine synthesis.
a, Schematic depicting all 3 pathways leading to synthesis of the polyamine precursor ornithine: De novo ornithine synthesis (DNS) via OAT in red, urea cycle via ARG2 in yellow and creatine synthesis via GATM in purple. ARG, arginase; ASL, argininosuccinate lyase; ASS1, argininosuccinate synthase 1; CPS1, carbamoyl-phosphate synthase 1; GAMT, guanidinoacetate N-methyltransferase; GATM, glycine amidinotransferase; GLS, glutaminase; GSA, glutamate-γ-semialdehyde; α-KG, α-ketoglutarate; NOS, nitric oxide synthase; OAA, oxaloacetate; OAT, ornithine aminotransferase; ODC1, ornithine decarboxylase 1; OTC, ornithine transcarbamoylase; P5C, pyrroline-5-carboxylate; P5CS, pyrroline-5-carboxylate synthase (product of ALDH18A1 gene or aldehyde dehydrogenase 18 family member A1); P5CDH, pyrroline-5-carboxylate dehydrogenase (product of ALDH4A1 gene or aldehyde dehydrogenase 4 family member A1); PRODH, proline dehydrogenase 1; PYCR, pyrroline-5-carboxylate reductase; SMS, spermine synthase; SRM, spermidine synthase. b, c, Schematics tracing the fates of 15N-(amine) of glutamine (b) or all 4 nitrogens of 15N4-arginine (c) into ornithine and polyamine synthesis (left), or the urea cycle (right). Circles in White: 12C; in Red (b) or Green (c): 15N; in Gray: 14N; in Black: 14N when the urea cycle is off, as in PDA cells in vitro, but 15N when the urea cycle is on, as in PDA tumors in vivo. Thicker arrows indicate enhanced flux into DNS and polyamine synthesis (b) or into generation of argininosuccinate, urea, ornithine and polyamines (c). d, Percent 15N-labeled metabolites in AsPC-1 cells fed 15N-(amine)Gln for 24 h. n = 6 biological replicates. e, Percent 15N-labeled metabolites in AsPC-1 cells fed 15N4-Arg for 24 h. Consistent with urea cycle inactivity, only 15N4-Arg-derived citrulline (M+3), the result of nitrogen oxide synthase (NOS) activity, but not citrulline (M+2), product of ornithine transcarbamoylase (OTC) in the urea cycle, was detected (see schematic in c). Furthermore, arginine-derived 15N-argininosuccinate (As, M+4) but not (M+2) was detected, indicating reverse argininosuccinate lyase (ASL) reaction, rather than transfer of 15N from citrulline via argininosuccinate synthetase (ASS1) in the urea cycle (see schematic in c). n = 4 biological replicates. f, g, Percent labeled 15N-ornithine (f) and 15N-putrescine (g) in 29 cancer cell lines representing 5 cancer types (PDA; BRCA: breast carcinoma; LUAD, COAD and PRAD: adenocarcinomas of the lung, colon and prostate, respectively) with tissue-matched normal cell lines, indicated by arrowheads, that were fed 15N4-Arg for 24 h. n = 4 biological replicates per cell line. h, i, Relative abundance of 15N-labeled ornithine (h) or 15N-labeled putrescine (i) normalized to 15N-labeled glutamate in cell lines fed 15N-(amine)Gln for 24 h, as described in Fig. 1b, c. n = 4 biological replicates. M+1 and M+2 indicate a mass shift of 1 or 2 nitrogens, respectively. Data represent the mean ± s.d. p-values were obtained by one-way ANOVA, followed by Tukey test. Stars indicate statistical significance between each cancer cell line and its tissue-matched normal cell line/s. Data are representative of six (d), three (e) or two (f-i) independent experiments.
Extended Data Fig. 2 |
Extended Data Fig. 2 |. Enhanced de novo ornithine synthesis is a distinct feature of PDA.
a, Doubling times of cell lines in Fig. 1b, c. n = 8 biological replicates. b, Percent labeled 15N-proline in 15N-(amine)Gln-fed cells from Fig. 1b, c. n = 4 biological replicates. c, Percent labeled 15N-argininosuccinate (M+4) in 15N4-Arg-fed cells described in Extended Data Fig. 1f, g. n = 4 biological replicates. d, e, Percent 15N-labeled metabolites in AsPC-1 cells fed for 24 h, either 650 μM 15N-(amine)Gln (d) or 64 μM 15N4-Arg (e) in the presence of 64 μM unlabeled arginine (d) or 650 μM unlabeled glutamine (e). These amino acid concentrations reflect levels found in human plasma. n = 4 biological replicates. f, g, Percent labeled 15N-ornithine and 15N-putrescine in 11 cancer cell lines representing 3 cancer types (PDA; BRCA: breast carcinoma; LUAD, lung adenocarcinoma) with tissue-matched normal cell lines (arrowheads), that were fed 15N-(amine)Gln (f) or 15N4-Arg (g) and maintained for 24 h in plasma glutamine and arginine levels as described in d, e. n = 4 biological replicates. h, i, 15N enrichment in plasma glutamine (h) and percent 15N-labeled glutamine in normal pancreas or PDA tumors (i) derived from tumor-bearing iKrasG12D mice and non-tumor-bearing iKrasWT mice treated with Dox (2g l−1 drinking water) for 3 weeks prior to infusion with 15N-(amine)Gln for 1, 2 or 3 hours as described in Fig. 1e–g. n = 4 mice per group. j, 15N enrichment in plasma arginine of iKras mice described in Fig. 1g, that were treated with Dox for 3 weeks prior to infusion with 15N4-Arg for 3 h. n = 4 mice per group. k, l, Percent 15N-labeled arginine (k) and relative abundance of total ornithine and putrescine (l) in normal pancreas or PDA tumors derived from either control or tumor-bearing mice described in Fig. 1g, that were infused with 15N4-Arg for 3 h. n = 4 mice per group. Data represent the mean ± s.d. p-values were obtained by one-way (b, c, f, g) or two-way (h-j) ANOVA, followed by Tukey test, or unpaired two-tailed t-test (k, l). In b, f, g, statistical significance is for each cancer cell line vs. its tissue-matched normal cell line/s. In a-g, data are representative of two independent experiments.
Extended Data Fig. 3 |
Extended Data Fig. 3 |. Polyamines are enriched in PDA cells and their tumor microenvironment.
a, Principal component (PC) analysis of the abundance of 263 polar metabolites in plasma or tumor interstitial fluid (TIF) or normal interstitial fluid (NIF) from PDA tumors or normal pancreas of iKrasG12D or iKrasWT mice, respectively, described in Fig. 1h, i. Data were obtained by Metaboanalyst 4.0. n = 6 biological replicates. b, Top 10 enriched metabolic pathways in TIF compared to plasma (top); or TIF compared to NIF (bottom) based on abundance of metabolites in a. FDR false discovery rate. c, Volcano plot illustrating the fold change (log2-transformed) in metabolite levels between TIF and plasma of tumor-bearing iKrasG12D mice described in a. n = 6 biological replicates. Pink dots indicate significantly altered metabolites (> 1.5-fold; p < 0.01). d, Heatmaps listing in descending order of statistical significance (p < 0.05 by unpaired two-tailed t-test), metabolites in arginine metabolism from TIF vs. plasma of iKrasG12D mice (left) or TIF vs. NIF (right) described in a. n = 6 biological replicates. e, f, Relative live cell number (e) percent dead cells (f) in 4 KRAS-mutant and 1 non-KRAS-mutant (BxPC-3) PDA cell lines as well as normal HPDE cells grown in TIF arginine levels (2 μM). n = 8 biological replicates. g, Principal component (PC) analysis of the abundance of intracellular polar metabolites (263) in PDA tumors of iKrasG12D mice vs. normal pancreas of iKrasWT mice from a. n = 6 biological replicates. h, Top 10 enriched metabolic pathways in PDA tumors compared to normal pancreas of mice from g. i, Heatmap listing in descending order of statistical significance (p < 0.05 by unpaired two-tailed t-test), metabolites involved in arginine metabolism from PDA tumors and normal pancreas described in g. n = 6 biological replicates. j, Relative abundance of intracellular ornithine, putrescine, and spermidine in PDA tumors or normal pancreas described in g. n = 6 biological replicates. Data in a-d and g-i were obtained by Metaboanalyst 4.0. In d, i, Red indicates higher level and blue lower level, relative to the median. Data in e, f, j represent the mean ± s.d. p-values were obtained by two-way ANOVA followed by Tukey test (e, f) or by unpaired two-tailed t-test (j). In e, f, statistical significance is for days 3, 5 or 7 vs. day1. Data are representative of two independent experiments.
Extended Data Fig. 4 |
Extended Data Fig. 4 |. OAT is enriched in human and murine PDA tumors.
a, Gene expression analysis showing higher mRNA levels of OAT but not ALDH18A1 (aldehyde dehydrogenase 18 family member A1), ARG2 or ODC1 in human tumors compared to normal tissues. Data were derived from TCGA and GTEx datasets and represent 5 cancer types including pancreatic adenocarcinoma (PAAD), breast carcinoma (BRCA), lung, colon and prostate adenocarcinomas (LUAD, COAD and PRAD, respectively). TPM, transcript per million. T, tumor and N, normal tissue. Number of tissue samples n is indicated at bottom of panel. Box plots represent the interquartile range of data with the middle line being the median and whiskers spanning the minimum and maximum values. Plots and statistics were generated by GEPIA software. *p < 0.01 (one-way ANOVA). b, mRNA levels of genes in a quantified by qPCR, in 20 human cancer cell lines and 3 tissue-matched normal cell lines from the panel described in Fig. 1b, c. Ct indicates cycle threshold for each gene in the normal cell lines and is inversely proportional to mRNA levels. Data represent the mean of 3 technical replicates and are representative of two independent experiments. c, Representative immunohistochemical staining of OAT in PDA tumors and normal pancreas of tumor-bearing iKrasG12D or non-tumor-bearing iKrasWT mice treated with Dox (2g l−1 drinking water) for 3 weeks. Scale bar: 100μm. d, Representative immunohistochemical OAT staining in human PDA, pancreatic intraepithelial neoplasia (PanIn) and adjacent normal cells in whole tissue sections of resected tumors from 4 different patients (Cases 1–4). Scale bar: 100μm. In c, d, framed top corner insets represent a 5-fold magnification of the area delineated by a dashed square; data are representative of 2 independent experiments. e, H scores of OAT staining in PDA tumors and patient-matched normal pancreatic tissue performed on tissue microarrays (TMAs) of resected tumors from n = 31 patients. Data represent the mean ± s.d and p = 0.0003 was obtained by paired two-tailed t-test.
Extended Data Fig. 5 |
Extended Data Fig. 5 |. OAT is required for PDA growth.
a, Levels of ODC1, OAT or ARG2 proteins in AsPC-1 cells with knockdown of ODC1, OAT, ARG2 or GATM (left) and mRNA levels of GATM (right) in AsPC-1 cells with GATM knockdown as compared to Scramble (Scr). 2 hairpins per gene were used. b, Percent 15N-labeled metabolites in proline synthesis, urea cycle and creatine synthesis pathways in AsPC-1 cells with knockdown of ODC1, OAT, ARG2 or GATM (described in Fig. 2b, c), that were fed 15N4-Arg for 24 h. n = 4 biological replicates. c, Schematic demonstrating reversal of the OAT reaction upon ODC1 loss, accompanied by a compensatory increase in ARG2 and GATM activities to re-generate ornithine as demonstrated in b. d, e, Proliferation of AsPC-1 cells with knockdown of ODC1, OAT, ARG2, GATM or Scr (d) or those with knockdown of ODC1, OAT, or Scr, that were grown in the presence or absence of 10 μM putrescine (e). n = 8 biological replicates. f, Levels of ODC1 and OAT proteins in MIA PaCa-2 cells harboring ODC1, OAT or Scr knockdown. Arrowhead indicates non-specific band detected by ODC1 antibody (ab97395). g, h, Relative abundance of 15N-labeled putrescine (g) or total putrescine or ornithine (h) in cells from f, that were fed 15N-(amine)Gln or 15N4-Arg for 24 h. n = 4 biological replicates. i, mRNA levels of ODC1 and OAT genes in SUIT-2 cells with control Scr, ODC1, or OAT knockdown. j, Proliferation of MIA PaCa-2 and SUIT-2 cells with either ODC1, OAT, or Scr knockdown that were grown in the presence or absence of 10 μM putrescine. n = 8 biological replicates. Data represent the mean ± s.d. in a, b, g-i, or mean ± s.e.m. in d, e, j. p-values were obtained by one-way ANOVA (a, b, g-i) or two-way ANOVA (d, e, j), followed by Tukey test. In a and f, β-Actin was used as a loading control. Data are representative of three (a, d, e, f, i, j) or two (b, g, h) independent experiments.
Extended Data Fig. 6 |
Extended Data Fig. 6 |. Silencing of OAT decreases polyamine pools in PDA cells and suppresses proliferation.
a, Levels of ODC1 and OAT proteins in AsPC-1 cells with control Scramble (Scr), ODC1 or OAT knockdown overexpressing either GFP control or respective rescue cDNAs for ODC1 or OAT. b, c, Relative abundance of 15N-labeled (b) or total (c) ornithine and putrescine in AsPC-1 cells described in a, that were fed 15N-(amine)Gln for 24 h. n = 4 biological replicates. d, Proliferation of AsPC-1 cells in a. n = 8 biological replicates. e, Levels of ODC1 and OAT proteins in HPDE cells with control Scr, ODC1 or OAT knockdown. f, Proliferation of HPDE cells from e. n = 8 biological replicates. g, Representative ultrasound images of orthotopic xenografts 3 weeks post-injection of AsPC-1 cells bearing knockdown of Scr, ODC1 or OAT into the pancreas of Rag1−/− mice, as described in Fig. 2f. T, Tumor; S, Spleen; K, Kidney. h, Volumes by ultrasound, of orthotopic human PDA tumors from g and Fig. 2f. n = 9 except for shODC1 #2, n = 8 mice per group. i, Levels of ODC1 and OAT proteins in 2 iKras cell lines with control Scr, Odc1 or Oat knockdown (2 hairpins per gene). j, k, Relative abundance of 15N-labeled (j) or total (k) ornithine and putrescine in iKras cells from i. n = 4 biological replicates. l, Proliferation of iKras cells from i, grown in the presence or absence of 10 μM putrescine. n = 8 biological replicates. Data represent the mean ± s.d. (b, c, h, j, k) or mean ± s.e.m. (d, f, l). p-values were obtained by one-way (b, c, j, k) or two-way (d, f, h, l) ANOVA, followed by Tukey test. In d, l, statistical significance is for each condition vs. control “shScr + GFP” (d) or each gene knockdown vs. Scr control in the presence or absence of putrescine (l). In e, i, Arrowhead indicates non-specific band detected by ODC1 antibody (ab97395). In a, e, i, β-Actin was used as a loading control. Data are representative of two (a-c, i-k) or three (d, e, f, l) independent experiments.
Extended Data Fig. 7 |
Extended Data Fig. 7 |. OAT maintains in vivo tumor polyamine pools supporting PDA growth.
a, Generation of murine orthotopic PDA transplants lacking Odc1 or Oat. iKras clonal cell lines with CRISPR/Cas9 knockout of Odc1 (clones #3 and #10) or Oat (clones #10 and #11) using single guide (sg) RNAs each, or sgControl (sgCtrl) were injected (5 × 10⁵ cells) into the pancreas of non-Cre-expressing iKras mice. All mice were treated with Dox (2g l−1 drinking water) and monitored for tumor growth by ultrasound over 3 weeks, prior to subjecting them to a 3-hour infusion with 15N-(amine)Gln. b, Levels of ODC1 and OAT proteins in iKras cells from a. c, d, Relative abundance of 15N-labeled (c) or total (d) ornithine and putrescine in iKras cells from a that were fed for 24 h 15N-(amine)Gln or 15N4-Arg. n = 4 biological replicates. e, Proliferation of iKras cells described in a. n = 8 biological replicates. f-h, Volumes (ultrasound) of orthotopic iKras tumors with control (Ctrl), Odc1 or Oat knockout from a, injected into non-tumor-bearing mice (f), with representative ultrasound images (g), and weights (h), 3 weeks post-injection of iKras cells. n = 9 (sgCtrl); n = 10 (sgOdc1 #10; sgOat #10); n = 6 (sgOdc1 #3; sgOat #11). T, Tumor; S, Spleen. i, 15N enrichment in plasma glutamine of tumor-bearing mice in f-h, that were infused with 15N-(amine)Gln over 3 hours, 3 weeks post-tumor cell injection (related to Fig. 2g). n = 4 mice per group. j, Relative abundance of indicated metabolites in orthotopic tumors derived from iKras cells with knockout for Odc1, Oat, or control, described in a. n = 6 mice per group. k, Relative abundance of putrescine and spermidine in human orthotopic PDA tumors derived from AsPC-1 cells with ARG2 or Scramble (Scr) knockdown, that were injected (105 cells) into the pancreas of Rag1−/− mice and grown for 6 weeks. n = 7 mice per group. l, Relative abundance of the indicated metabolites in murine orthotopic transplant tumors derived from KPC cells (see Methods) expressing or lacking Arg2 (Arg2+/+ or Arg2−/−, respectively) that were injected (2.5 × 10⁵ cells) into the pancreas of mice of the same strain and grown for 2 weeks. n = 6 mice per group. In j-l, Box plots represent medians ± 10–90 percentile and whiskers span minimum and maximum values. m, Levels of OAT and ODC1 proteins in iKras cells with control (sgCtrl) or Odc1 or Oat knockout (sgOdc1 or sgOat) that are overexpressing GFP control or the respective gene cDNA (Odc1 or Oat). n, o, Relative abundance of 15N-labeled (n) or total (o) ornithine and putrescine levels in iKras cells described in m, that were fed 15N-(amine)Gln for 24 h. n = 4 biological replicates. p, Proliferation of iKras cells described in m. n = 8 biological replicates. q, Volumes of syngeneic orthotopic tumor transplants derived from iKras cells described in m that were grown and quantified by ultrasound, 2 and 3 weeks post-cell injection (related to Fig. 2h). n = 8 mice (sgCtrl + GFP); n = 7 (sgCtrl + Oat); n = 9 (sgOat #10 + GFP; sgOat #10 + Oat). r, Metabolite abundance in TIF or plasma of mice related to Fig. 2i. n = 8 except sgCtrl + Oat (7). In i, j, m-r, sgOdc1 clone #10 and sgOat clone #10 from a-h were used. Data represent the mean ± s.d. (c, d, f, h, i, n, o, q, r) or mean ± s.e.m. (e, p). p-values were obtained by one-way (c, d, h, j, n, o) or two-way (e, f, i, p, q, r) ANOVA followed by Tukey test, or by unpaired two-tailed t-test (k, l). In e, n-p, statistical significance is for each condition vs. control knockout “sgCtrl” (e) or each condition vs. “sgCtrl + GFP” (n-p). In b, m, Arrowhead indicates non-specific band detected by ODC1 antibody (ab97395) and β-Actin was used as a loading control. Data are representative of two (b-d, m-o) or three (e, p) independent experiments.
Extended Data Fig. 8 |
Extended Data Fig. 8 |. Oncogenic KRAS induces the expression of OAT and polyamine synthesis genes.
a, mRNA levels of Srm, Sms and Arg2 in iKras cell lines #1 and #2 maintained in Dox (1μg ml−1) for 24 h prior to Dox deprivation for 24, 48, or 72 hours. n = 3 biological replicates. b, c, mRNA levels of KRAS, OAT, ODC1, SRM, SMS and ARG2 in human PDA AsPC-1 (b) or MIA PaCa-2 (c) cells with Dox-inducible knockdown of GFP (Tet on-shGFP) or KRAS (Tet on-shKRAS hairpins #1 and #2) that were cultured in Dox (1μg ml−1) for 24, 48 or 72 hours. In b, n = 3 and in c, n =2 biological replicates. d, mRNA levels of ornithine and polyamine synthesis genes (OAT, ODC1, SRM, SMS and ARG2) in AsPC-1 and MIA PaCa-2 cells treated with vehicle control DMSO or inhibitors of: PI3K (BKM 120, 150 nM); AKT (MK2206, 200 nM); MEK (AZD6244, 50 nM); mTORC1 (Rapamycin, 20 nM) for 72 h. n = 3 biological replicates. Data represent the mean ± s.d. (a, b, d) of biological replicates from 3 independent experiments or the mean of biological replicates from 2 independent experiments (c). p-values were obtained by two-way (a, b) or one-way (d) ANOVA followed by Tukey test. Statistical significance is for Off Dox vs. On Dox (a) or for shKRAS vs. shGFP (b) at each indicated time, or for each inhibitor vs. DMSO (d). e, Levels of proteins in cells from d. β-Actin was used as loading control and data represent two independent experiments.
Extended Data Fig. 9 |
Extended Data Fig. 9 |. Transcription factor KLF6 mediates KRAS-driven polyamine synthesis in PDA.
a, b, Putative transcription factor (TF) binding sites identified and scored by FMatch tool in the promoter regions of all 4 ornithine and polyamine synthesis genes responsive to KRASG12D, i.e. OAT, ODC1, SRM and SMS. Predicted TFs are listed in descending order of statistical significance (p-value cut-off of 0.01), with matrix score similarity ranging from 0–1, where 1 is a perfect match. Eight are conserved in human (a) and mouse (b), out of which six (in blue) have binding sites present in the OAT promoter. c, mRNA levels of Myc, Oat, Odc1, Srm, Sms and Arg2 in 2 iKras cell lines with Scramble control (Scr) or Myc knockdown (2 distinct hairpins). n = 2 biological replicates. d, mRNA levels validating knockdown (2 or 3 hairpins per gene) of each of the 6 conserved TFs with binding sites for OAT (blue in a, b), and assessing their effects on expression of Oat, Odc1, Srm, Sms and Arg2 in iKras #1 cell line. n = 3 biological replicates. e, mRNA levels of ornithine and polyamine synthesis genes (Oat, Odc1, Srm, Sms and Arg2) in iKras #2 cells with Scr or Klf6 knockdown (2 distinct hairpins). n = 3 biological replicates. f, Levels of OAT, ODC1, SRM, SMS proteins in iKras cells with Klf6 or Scramble (Scr) knockdown, with or without Dox (72 h). β-Actin was used as loading control. g, Fold change in mRNA levels of Myc and each of the 6 TFs from d in iKras #1 cell line deprived of Dox for 48 h. n = 3 biological replicates. h, Relative abundance of total ornithine and putrescine in iKras#1 cells described in Fig. 3h. Cells were fed 15N-(amine)Gln or 15N4-Arg 24 h before harvest. n = 4 biological replicates. In c-e, g, h, data represent the mean ± s.d. p-values were obtained by one-way (d, e) or two-way (h) ANOVA followed by Tukey test, or paired two-tailed t-test (g). In d, e, g, statistical significance is for each TF knockdown vs. control Scramble (d, e), or for Off Dox vs. On Dox (g). Data represent the mean of biological replicates from 2 independent experiments (c) or mean ± s.d. of biological replicates from 3 independent experiments (d, e, g). In f, h, data are representative of 2 independent experiments.
Extended Data Fig. 10 |
Extended Data Fig. 10 |. 5-FMO suppresses polyamine synthesis and PDA growth similar to DFMO but without off-target effects.
a, Relative abundance of 15N-labeled ornithine and putrescine in iKras cells #1 treated for 72 h with inhibitors of OAT (5-FMO) or ODC1 (DFMO) and fed 15N-(amine)Gln or 15N4-Arg 24 h before harvest. n = 4 biological replicates. b, c, Relative abundance of total ornithine and putrescine in AsPC-1 (b, related to Fig. 4a) or iKras (c) cells treated as in a. n = 4 biological replicates. d, Percent growth of human PDA cells AsPC-1 and MIA PaCa-2 with knockdown of OAT #1 or Scramble (Scr) that were treated with 5-FMO (0, 0.001, 0.025, 0.05, 0.1, 0.25, 0.5, 0.75, 1, 2.5 mM) for 7 days. e, Percent growth over 7 days of AsPC-1 cells treated with 5-FMO as in d, in the presence or absence of putrescine (10 μM). f, Percent growth of iKras #1 cells with control (Ctrl) or Oat knockout, that were treated with 5-FMO as in d. g, h, Percent growth of human PDA cells with Scramble or ODC1 #1 knockdown (g) or murine iKras #1 cells with Ctrl or Odc1 knockout (h) that were treated with DFMO (0, 0.001, 0.025, 0.05, 0.1, 0.25, 0.5, 0.75, 1, 2.5 mM) for 7 days. In f, h, sgOdc1 clone #10 and sgOat clone #10 from Extended Data Fig. 7a were used. In d-h, n = 8 biological replicates and arrowheads indicate concentrations used in a-c. i, Relative abundance of 13C-labeled (M+4) and total putrescine in AsPC-1 cells with knockdown of control Scramble (Scr), ODC1 or OAT that were treated with vehicle control (water) or 10 μM 13C4-putrescine for 1 h. n = 4 biological replicates. j, Relative abundance of 13C-labeled (M+4) and total putrescine in AsPC-1 cells that were pre-treated (or non-pre-treated) for 15 min with 1 μM AMXT-1501, then fed 10 μM 13C4-putrescine for 0, 50, 100, 150, 200 and 240 min while continuing the same AMXT-1501 treatment (0 or 1 μM) but in absence or presence of 5-FMO (0 or 100 μM). n = 4 biological replicates. In i, j, data represent the mean of n = 4 biological replicates from two independent experiments. k, Proliferation of AsPC-1 cells that were treated or not treated with 1 μM AMXT-1501 and/or 100 μM 5-FMO for 7 days in the presence or absence of 10 μM putrescine. Data represent the mean of n = 32 biological replicates from four independent experiments with n = 8 per experiment. l, 15N enrichment in plasma glutamine of tumor-bearing male iKrasG12D mice from Fig. 4f that were treated with control saline or 5-FMO (10 mg kg−1 and 30 mg kg−1) for 14 days, prior to infusing them for 3 h with 15N-(amine)Gln, as described in Fig. 4g. n = 4 mice per group. m, Relative abundance of total ornithine and putrescine in tumors of 5-FMO treated male iKras mice, related to Fig. 4g. n = 4. n, o, Weights of livers (n) and growth curves (o) of male or female iKrasG12D mice described in Fig. 4f. Male mice: n = 11 per dose; Female mice: n = 10 for saline, n = 9 for 10mg kg−1 and n = 11 for 30mg kg−1. p, Proliferation fold increase in number over 7 days of AsPC-1 cells treated with gemcitabine at 0, 0.1, 0.2, 0.4, 0.6, 0.8, 1, 2 μM in the presence or absence of 5-FMO (0, 100 or 500 μM). n = 8 biological replicates. Data represent the mean ± s.d. (a-c, i-n, p) or mean ± s.e.m. (d-h, o). p-values were obtained by one-way (a-c, m, n) or two-way (i-l, o, p) ANOVA followed by Tukey test or paired two-tailed t-test (d-h). In i, indicated p-values are for each knockdown in the presence vs. absence of putrescine at the indicated times; † and ‡ indicate significance of p < 0.0001 for each gene knockdown vs. Scr knockdown in absence (†) of putrescine; or in presence (‡) of putrescine, except for 13C4-putrescine in shOAT #1 and total putrescine in shOAT #2, where p = 0.0003. In j, significance is for each drug condition vs. vehicle control (black line). In p, † (p = 0.0006) and ‡ (p < 0.0001) indicate statistical significance between each gemcitabine-treated group and non-treated control in the absence of 5-FMO (grey bars). Data are representative of two (a-c, g, h), three (d-f, p) independent experiments.
Extended Data Fig. 11 |
Extended Data Fig. 11 |. Immune profiling reveals no major differences in immune subsets upon genetic or pharmacological inhibition of OAT.
a, Analysis of select immune populations in orthotopic tumors derived from iKras cells with knockout of Odc1, Oat, or control (Ctrl) that were injected (5 × 10⁵ cells) into the pancreas of non-Cre-expressing iKras mice and grown for 3 weeks. b-f, Immune profiling of PDA tumors from male and female iKrasG12D mice that were treated with Dox (2g l−1 drinking water) for 7 days, then daily intraperitoneally injected with control saline or 5-FMO (10 mg kg−1 and 30 mg kg−1) for 14 days while under continuous treatment with Dox. Single cell infiltrates from tumors and draining lymph nodes were analyzed by flow cytometry. Analysis of select immune populations (b), ratio of Tregs to CD8+ T cells and percent PD1+ CD8+ T of total CD8+ T cells (c) in PDA tumors. Analysis of select immune populations in pancreatic draining lymph nodes (dLN, d). Representative flow plots showing Tregs (CTLA-4+ and FOXP3+) in PDA tumor (e) and pancreatic draining lymph node (f) derived from saline-treated iKrasG12D mice. For tumor samples, values indicate the average of 2 replicate samples obtained from different regions of the tumor mass. n = 9–10 mice per group using both sexes (male: n = 5 per group; female: n = 4 for saline and 10 mg kg−1 5-FMO, n = 5 for 30 mg kg−1 5-FMO). In a-d, Data represent the mean ± s.d. p-values were obtained by one-way ANOVA followed by Tukey test. For gating details, analysis of select immune populations gated out of CD45+ live, single cells: CD11b+/− = CD45+; MoMDSCs = CD11b+ Gr1low; GrMDSCs = CD11b+ Gr1high; macrophages = CD11b+ SiglecF Gr1; eosinophils = CD11b+ SiglecF+; CD103+/MHCIIhigh; DCs = CD11b CD4 CD8 CD11c+ MHCII+; CD4 T cells = CD11b CD4+; CD8 T cells = CD11b CD8+; Tregs = CD11b CD4+ FOXP3+ CTLA4+; B cells = CD11b CD4 CD8 B220+. All positive gates were set based on clearly separated populations except in the case of Gr-1 staining, which was divided into tertiles based on mean fluorescence intensity. Unstained cells were used to define negative gates. Forward scatter and side scatter were used to identify cell-sized objects. Fragments with FSC less than 10% of the sample median were excluded from analysis. Cell doublets were excluded based on deviation from the diagonal of FSC area vs FSC height.
Extended Data Fig. 12 |
Extended Data Fig. 12 |. OAT silencing results in transcriptional and epigenetic changes similar to those of ODC1 knockdown.
a, Venn diagrams showing a higher overlapping number of differentially expressed genes (q < 0.05) in AsPC-1 cells with knockdown of OAT or ODC1 (608 down-regulated and 599 up-regulated), as compared to ARG2 and ODC1 or ARG2 and OAT. Numbers reflect differential expression common to 2 hairpins per gene. b, ATAC-Seq data showing significant changes (q < 0.05) in chromatin access at enhancers located < 20 kb from transcription start sites in AsPC-1 cells with knockdown of ODC1, compared to control Scramble (Scr), OAT, or ARG2 (2 hairpins per gene). n = 2 biological replicates per hairpin. Significant changes detected include losses and gains of chromatin accessibility near 175 and 135 enhancers, respectively. c, Correlation of changes in gene expression and nearby (< 25 kb) chromatin accessibility for 403 genes that were consistently up-regulated upon ODC1 and OAT silencing in AsPC-1 cells (cluster V, Fig. 4h). Each dot represents a gene. Gene-linked enhancers (< 25 kb) show gains in accessibility upon knockdown of ODC1 or OAT, but not ARG2. d, List of top 18 pathways in descending significance (FDR 0.003–0.30) that were differentially altered at the transcriptional level (either negative or positive enrichment) upon ODC1 knockdown compared to Scr control in AsPC-1 PDA cells described in a, b. Negatively enriched pathways related to growth factors, cytokines and response to starvation are highlighted in yellow and those involved in cell shape, migration, differentiation and ion transport are highlighted in blue. Asterisks indicate representative pathways illustrated in e and Fig. 4j. e, Heatmaps of genes from representative pathways (blue) in d displaying negative enrichment upon knockdown of ODC1 compared to Scr control (n = 3), with corresponding GSEA plots. NES normalized enrichment scores, FDR false discovery rate, Nom. Nominal. f, List of differentially expressed genes from top 18 negatively enriched pathways in d, that are part of Cluster I in Fig. 4h and are indicated with dark blue dots in the correlation plots of Fig. 4i. Genes in Quadrant (Q) III of Fig. 4i plots associate with decreased chromatin accessibility, and are more numerous in cells with knockdown of ODC1 (37/58) or OAT (44/58), than ARG2 (22/58). g, Relative mRNA levels (by qPCR) of 7 representative genes in AsPC-1 cells with knockdown of ODC1, OAT, or ARG2 (2 hairpins per gene) compared to control Scr, that were maintained for 72 h in the presence or absence of 10 μM Putrescine. Genes were randomly chosen from Q III described in f and Fig. 4i, and display common decreases in expression upon OAT or ODC1 knockdown but not ARG2, along with concordant decreases in chromatin access. Data represent the mean ± s.d. of 3 biological replicates from 3 independent experiments. p-values were obtained by two-way ANOVA followed by Tukey test. Statistical significance is for knockdown of ODC1, OAT or ARG2 vs. Scr under similar putrescine condition, unless otherwise indicated by lines.
Fig. 1 |
Fig. 1 |. PDA uses glutamine for de novo ornithine and polyamine synthesis.
a, Schematic for OAT reaction. b, c, Percent 15N-labeled ornithine (b) and putrescine (c) in cancer and tissue-matched non-cancer (arrowheads) cell lines fed 15N-(amine)Gln for 24 h. (BRCA: breast carcinoma; LUAD, COAD and PRAD: adenocarcinomas of the lung, colon and prostate, respectively). n = 4 biological replicates. d, Schematic of tumor-bearing iKras and control mice treated with Dox, 3 weeks prior to infusion with 15N-(amine)Gln or 15N4-Arg. e, f, Relative abundance of 15N-labeled (e) or total (f) ornithine and putrescine in normal pancreas or PDA tumors from mice in d, infused with 15N-(amine)Gln for 1 h, 2 h or 3 h. n = 4 mice per group. g, Percent 15N-labeled ornithine and putrescine in normal pancreas or PDA tumors from mice in d, infused with 15N-(amine)Gln or 15N4-Arg for 3 h. n = 4 mice per group. h, Schematic for isolation of tumor interstitial fluid (TIF) or normal interstitial fluid (NIF) from PDA tumors or normal pancreas of iKrasG12D or iKrasWT mice, respectively. i, Relative abundance of metabolites in TIF and NIF from h. n = 6 biological replicates. Data are mean ± s.d. p-values were obtained by one-way (b, c, i) or two-way (e, f) ANOVA, followed by Tukey test or unpaired two-tailed t-test (g). In b, c, statistical significance is for cancer cells vs. tissue-matched normal cells. In i, p-values are for NIF vs. PlasmaWT or TIF vs. PlasmaG12D, unless otherwise indicated by lines. In b, c, data represent two independent experiments.
Fig. 2 |
Fig. 2 |. OAT is required for PDA polyamine synthesis and tumor growth.
a, Schematic illustrating enzymatic reactions for glutamine-derived (via OAT) vs. arginine-derived (via ARG2 or GATM) ornithine synthesis leading to putrescine synthesis (via ODC1). b, c, Relative abundance of 15N-labeled (b) or total (c) ornithine and putrescine in AsPC-1 cells with knockdown of genes depicted in a (2 hairpins/gene) or control Scramble (Scr). n = 4. d, e, Abundance of 15N-labeled (d) or total (e) ornithine and putrescine in HPDE cells with knockdown of ODC1, OAT or Scr. n = 4. In b-e, cells were fed 15N-(amine)Gln or 15N4-Arg for 24 h. f, Volumes (caliper) and weights of orthotopic AsPC-1 tumors injected into Rag1−/− mice. n = 9 except shODC1 #2, n = 8. g, Percent 15N-labeled glutamine and relative abundance of 15N-labeled ornithine and putrescine in murine iKras orthotopic tumors (from Extended Data Fig. 7a) with control (Ctrl), Odc1 or Oat knockout, post-infusion with 15N-(amine)Gln. n = 4. h, Volumes (caliper) and weights of orthotopic iKras-sgOat tumors overexpressing GFP or Oat. n = 8 (sgCtrl + GFP); n = 7 (sgCtrl + Oat); n = 9 (sgOat #10 + GFP; sgOat #10 + Oat). i, Metabolite abundance in TIF or plasma of mice from h. n = 8 except sgCtrl + Oat (7). n indicates biological replicates (b-e) or mice (f-i) per group. Data are mean ± s.d. p-values were obtained by one-way (b-h) or two-way (i) ANOVA followed by Tukey test. Data represent four (b, c), or two (d, e) independent experiments.
Fig. 3 |
Fig. 3 |. KRAS promotes DNS and polyamine synthesis in PDA.
a, b, Relative abundance of 15N-labeled (a) or total (b) ornithine and putrescine in 2 iKras cell lines maintained with or without Dox (72 h) and fed 15N-(amine)Gln or 15N4-Arg 24 h before harvest. n = 4. c, Relative abundance of metabolites in a normalized to abundance of 15N-glutamate. d, mRNA levels in cells from a deprived of Dox for indicated times. n = 3. e, Protein levels in cells from d, off Dox for 72 h. Arrowhead indicates non-specific band (ODC1 antibody ab97395). f, Protein levels in human PDA cells with Dox-inducible knockdown of GFP (Tet on-shGFP) or KRAS (Tet on-shKRAS hairpins #1 and #2). g, mRNA levels of genes in iKras cells with Scramble (Scr) or Klf6 (hairpins #1 and #3) knockdown, with or without Dox (72 h; n =3). h, Relative abundance of 15N-labeled ornithine and putrescine in iKras cells from g, fed 15N-(amine)Gln or 15N4-Arg 24 h before harvest. n = 4. i, Model for KRAS transcriptional regulation of polyamine synthesis in PDA. n indicates biological replicates. Data are mean ± s.d. p-values were obtained by one-way (a-c) or two-way (d, g, h) ANOVA followed by Tukey test. In d, g, statistical significance is for Off Dox vs. On Dox (d) or shKLF6 vs. shScr (g). In e, f, β-Actin was used as loading control. Data represent three (a-e, g) or two (f, h) independent experiments.
Fig. 4 |
Fig. 4 |. OAT inhibition suppresses PDA and alters its transcriptome similar to ODC1.
a, 15N-labeled ornithine and putrescine in AsPC-1 cells treated (72 h) with OAT (5-FMO) or ODC1 (DFMO) inhibitors and fed 15N-(amine)Gln or 15N4-Arg 24 h before harvest. n = 4. b-e, Growth (7 days) of 5-FMO-treated PDA (b) or breast cancer (c) cells; or HPDE cells with OAT #1, ODC1 #1 or Scramble (Scr) knockdown treated with either 5-FMO (d) or DFMO (e). n = 8. f, Weights of tumors from iKrasG12D mice pre-treated with Dox 7 days prior to daily intraperitoneal injection of saline or 5-FMO for 14 days. n = 11 except female saline (10) or 10mg kg−1 (9). g, Percent 15N-labeled glutamine and abundance of 15N-ornithine and putrescine in tumors of male mice from f. n = 4. h, Heatmap of differentially expressed genes in AsPC-1 cells with Scr, ODC1, OAT, or ARG2 knockdown (2 hairpins per gene). n = 3. Clusters I-VIII were identified by unsupervised k-means clustering (1-Spearman correlation). i, Correlation of gene expression changes and nearby (< 25 kb) chromatin accessibility for 561 genes from Cluster I in h. Dark blue dots indicate genes in negatively enriched pathways (GSEA), with total number indicated in specific plot quadrants (See Extended Data Fig. 12d, f). j, Heatmaps of genes from negatively enriched pathways in cells from h (n = 3), with corresponding GSEA plots. NES normalized enrichment scores, FDR false discovery rate, Nom. Nominal. n indicates biological replicates, or mice per group in f, g. Data are mean ± s.d. (a, f, g) or ± s.e.m (b-e). p-values were obtained by one-way ANOVA followed by Tukey test (a, f, g) or paired two-tailed test (d, e). Data represent two (a, c, e) or three (b, d) independent experiments.

Comment in

References

    1. Rahib L, Wehner MR, Matrisian LM & Nead KT Estimated Projection of US Cancer Incidence and Death to 2040. JAMA Netw Open 4, e214708, doi:10.1001/jamanetworkopen.2021.4708 (2021). - DOI - PMC - PubMed
    1. Siegel RL, Miller KD, Wagle NS & Jemal A Cancer statistics, 2023. CA Cancer J Clin 73, 17–48, doi:10.3322/caac.21763 (2023). - DOI - PubMed
    1. Encarnacion-Rosado J & Kimmelman AC Harnessing metabolic dependencies in pancreatic cancers. Nat Rev Gastroenterol Hepatol 18, 482–492, doi:10.1038/s41575-021-00431-7 (2021). - DOI - PMC - PubMed
    1. Martinez-Reyes I & Chandel NS Cancer metabolism: looking forward. Nat Rev Cancer 21, 669–680, doi:10.1038/s41568-021-00378-6 (2021). - DOI - PubMed
    1. Ginguay A, Cynober L, Curis E & Nicolis I Ornithine Aminotransferase, an Important Glutamate-Metabolizing Enzyme at the Crossroads of Multiple Metabolic Pathways. Biology (Basel) 6, doi:10.3390/biology6010018 (2017). - DOI - PMC - PubMed

Publication types