. 2023 Mar;615(7954):866-873.
doi: 10.1038/s41586-023-05754-w. Epub 2023 Mar 29.

Entwined African and Asian genetic roots of medieval peoples of the Swahili coast

Affiliations

Entwined African and Asian genetic roots of medieval peoples of the Swahili coast

Esther S Brielle et al. Nature. 2023 Mar.

Abstract

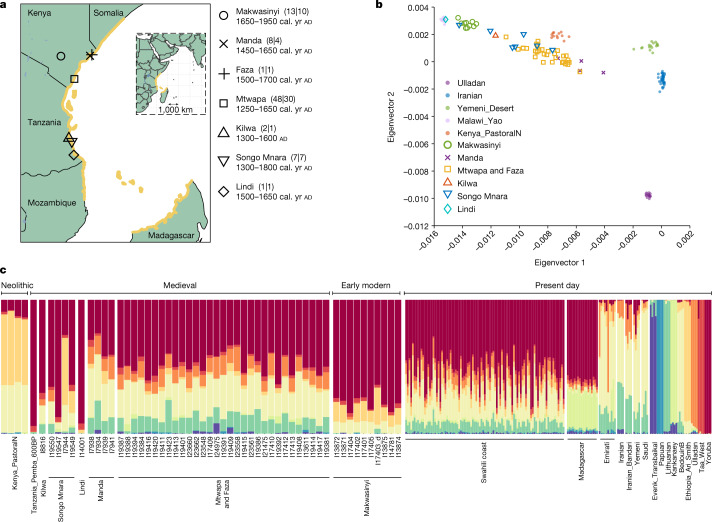
The urban peoples of the Swahili coast traded across eastern Africa and the Indian Ocean and were among the first practitioners of Islam among sub-Saharan people1,2. The extent to which these early interactions between Africans and non-Africans were accompanied by genetic exchange remains unknown. Here we report ancient DNA data for 80 individuals from 6 medieval and early modern (AD 1250-1800) coastal towns and an inland town after AD 1650. More than half of the DNA of many of the individuals from coastal towns originates from primarily female ancestors from Africa, with a large proportion-and occasionally more than half-of the DNA coming from Asian ancestors. The Asian ancestry includes components associated with Persia and India, with 80-90% of the Asian DNA originating from Persian men. Peoples of African and Asian origins began to mix by about AD 1000, coinciding with the large-scale adoption of Islam. Before about AD 1500, the Southwest Asian ancestry was mainly Persian-related, consistent with the narrative of the Kilwa Chronicle, the oldest history told by people of the Swahili coast3. After this time, the sources of DNA became increasingly Arabian, consistent with evidence of growing interactions with southern Arabia4. Subsequent interactions with Asian and African people further changed the ancestry of present-day people of the Swahili coast in relation to the medieval individuals whose DNA we sequenced.


Conflict of interest statement

The authors declare no competing interests.

Figures

Fig. 1
Fig. 1. Dataset overview.
a, Coastal areas associated with the medieval Swahili culture are shown in yellow. Sites represented in the ancient DNA samples are marked with black shapes. Numbers in parentheses are formatted X|Y, where X is the number of individuals for whom there are data, and Y is the number of individuals for whom we report high-resolution analyses. The chronology is given as the union of 95% confidence intervals for direct radiocarbon dates on the skeletons rounding to the nearest 50 years and is shown as calibrated (cal.) yr ad, or as ad for sites with only archaeological context (Supplementary Information; Extended Data Table 1). The base map was made with the Natural Earth R package using a CC BY license. Bodies of water were added from the RCMRD Geoportal with a CC BY license in R. All points were added and modifications were performed in R and Adobe Illustrator. The map is published for the first time in this Article. b, In a principal component analysis, eigenvector 1 correlates to variation maximized in sub-Saharan Africa, and eigenvector 2 correlates to Eurasian variation. c, Ancestry component assignment using ADMIXTURE with K = 9 clusters (selected on the basis of low cross-validation errors, high log-likelihood scores, and a low number of reference populations to not overfit; groups that maximize each components are shown on the right). Individuals with sufficient data for high-resolution analysis are plotted in approximate chronological order from left to right. Ancient individuals are labelled and plotted at four times the width of present-day individuals.
Fig. 2
Fig. 2. Individual ancestry proportions.
a, Inferences from qpAdm (see Extended Data Table 2 and Supplementary Information for model details and statistical fit). Blue represents African ancestry: the most common are Bantu-associated (common at southern sites) and Makwasinyi associated (northern sites), which itself is approximately 80% Bantu-related and 20% pastoralist-related. Yellow represents Southwest Asian ancestry: Persian or Arabian. Grey represents Indian ancestry. Bars represent s.e.m., computed using a block jackknife across all 5-centimorgan (cM) segments of the autosomes, and are meaningful even for single individuals as the genome contains information from a large sample size of ancestors. b, Ternary plot of Makwasinyi, Persian and Indian ancestry components in Mtwapa and Faza (red (high coverage) and yellow (low coverage)) and Manda (blue (high coverage) and green (low coverage)). Individuals with higher coverage (>100,000 SNPs overlapping positions on the Human Origins SNP array) are used to fit a linear regression (dashed line), which intersects at nearly 100% Makwasinyi and 0% Persian and Indian, consistent with a Makwasinyi-related population with little or no recent Asian ancestry mixing with an already-mixed Persian–Indian population. c, Bar graph showing P values from Hotelling T-squared tests for a qpAdm model with a mixed Persian–Indian source. The x-axis specifies the proportion of Persian ancestry in the source.
Fig. 3
Fig. 3. Inferred admixture events along the eastern African coast.
African populations are represented in shades of blue; Southwest Asian and Indian populations are represented in shades of yellow. Populations with both colours represent those that are admixed between the corresponding proxy source populations.
Extended Data Fig. 1
Extended Data Fig. 1. ADMIXTURE analysis.
We analyzed 6422 individuals including African populations genotyped with the Human Origins SNP array, along with 1240K capture ancient individuals from present-day Kenya, present-day Tanzania, and surrounding areas; Swahili coast present-day samples;, ancient Israel_Natufian; and Pulliyar samples from present-day India. We chose K = 10 ancestral reference populations (chosen based on low cross-validation errors, high log-likelihood scores, and a low number of reference populations so as to not overfit) to highlight various ancestries found throughout Eastern Africa). We were able to discern a variety of African pastoral, farming, and forager ancestries within coastal and inland Swahili-speaking populations of the Human Origins dataset. The Makwasinyi reference ancestry composition resemble those of the present-day coastal populations sampled in a previously published dataset, albeit with different proportions. The x’s identify two outlier individuals from the dataset with more Asian admixture; we removed them for population-level modeling. The genome-wide ancestry composition of the ancient coastal samples more closely resembles that of the newly published present-day individuals for which haplogroup data was published in.
Extended Data Fig. 2
Extended Data Fig. 2. Relationship of medieval to recent East Africans.
A) Graphical representation of individual and population level qpAdm models for Makwasinyi individuals, 89 present-day people who identify as and speak Swahili, and 93 present-day people who identify as Swahili and have long familial residency in the town, sampled from 6 coastal regions along Kenya. The green ancestry component represents the modeled contribution from medieval Swahili coast people, as proxied by individuals buried in Kilwa or Manda. One standard error bars around the mean are computed using a Block Jackknife across all 5 centimorgan segments of the autosomes, and are meaningful even for single individuals as the genome reflects ancestral contributions of large numbers of ancestors. B) PCA with the same present-day Swahili-identifying people (asterisks) and other present and ancient people (filled circles),,, and ancient individuals from eastern Africa published in this study (open shapes), projected onto the first two eigenvectors.
Extended Data Fig. 3
Extended Data Fig. 3. Estimates of dates of population mixture.
Curves that show the exponential decay of linkage disequilibrium generated by mixture between two populations related differentially to the two sources as a function of the number of elapsed generations since the mixture event. Multiplying by a 28 ± 2 year-to-generation conversion factor and subtracting from the average calibrated radiocarbon dates or the archaeologically estimated date of the ancient individuals gives estimates in calendar years. For present-day Swahili individuals, we subtract from the year 2015, when sampling occured.

References

    1. Wynne-Jones, S. & LaViolette, A. J. The Swahili World (Routledge, 2017).
    1. Kusimba, C. M. The Rise and Fall of Swahili States (Altamira Press, 1999).
    1. Spear TT. The Shirazi in Swahili traditions, culture and history. Hist. Afr. 1984;11:291–305. doi: 10.2307/3171638. - DOI
    1. Sheriff, A. Slaves, Spices and Ivory in Zanzibar. Integration of an East African Commercial Empire into the World Economy, 1770–1873 (James Currey, 1987).
    1. Spear T. Early Swahili history reconsidered. Int. J. Afr. Hist. Stud. 2000;33:257–290. doi: 10.2307/220649. - DOI

Publication types