. 2023 Mar;615(7954):874-883.
doi: 10.1038/s41586-023-05772-8. Epub 2023 Mar 29.

Diminishing benefits of urban living for children and adolescents' growth and development

Collaborators

Diminishing benefits of urban living for children and adolescents' growth and development

NCD Risk Factor Collaboration (NCD-RisC). Nature. 2023 Mar.

Abstract

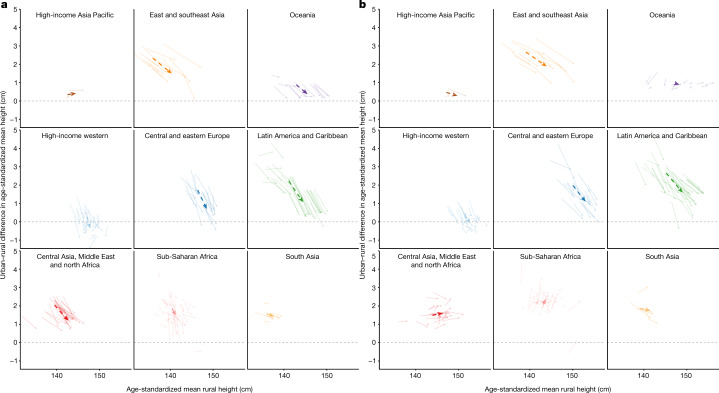
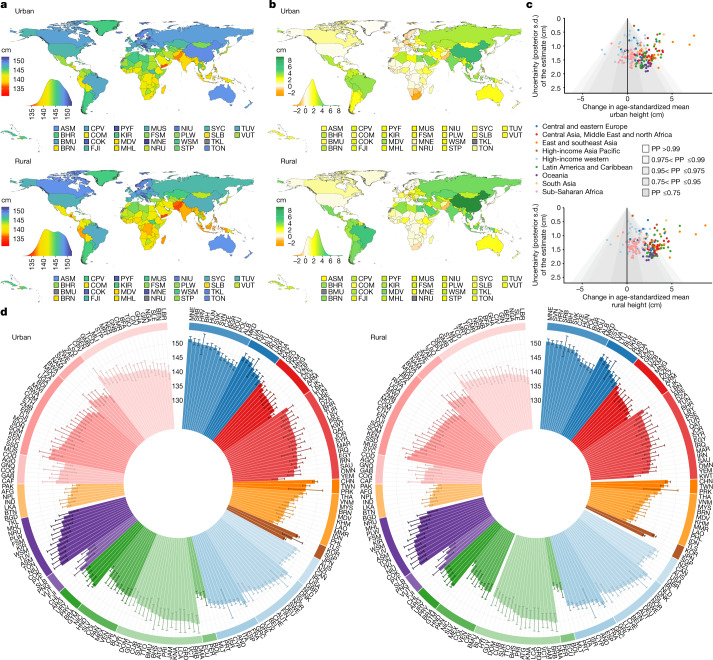
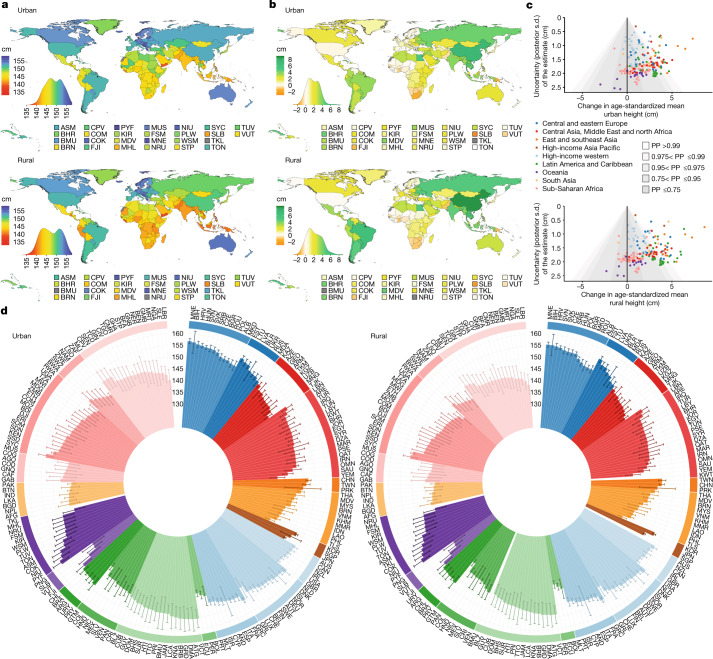
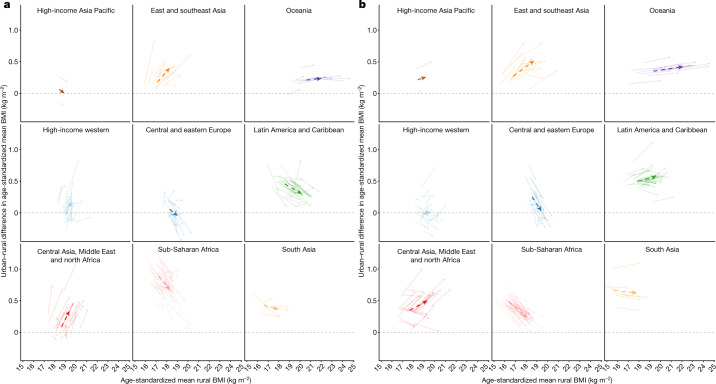
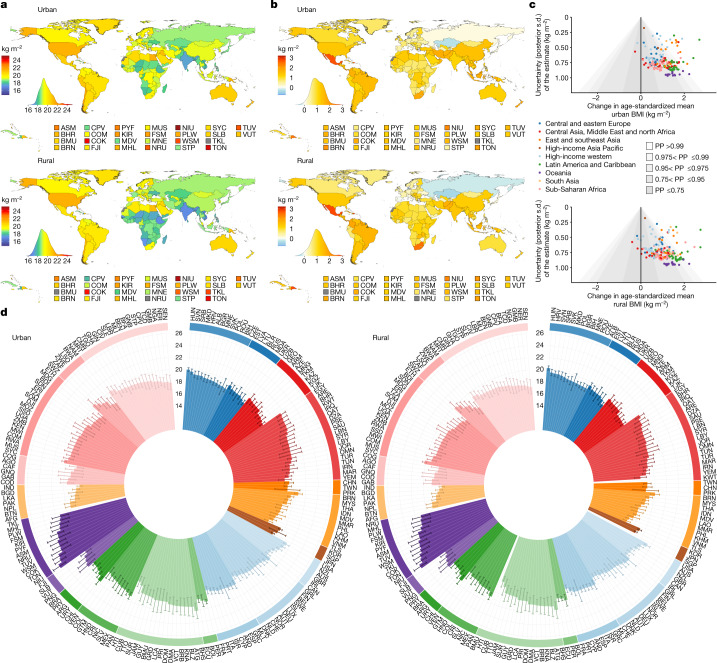
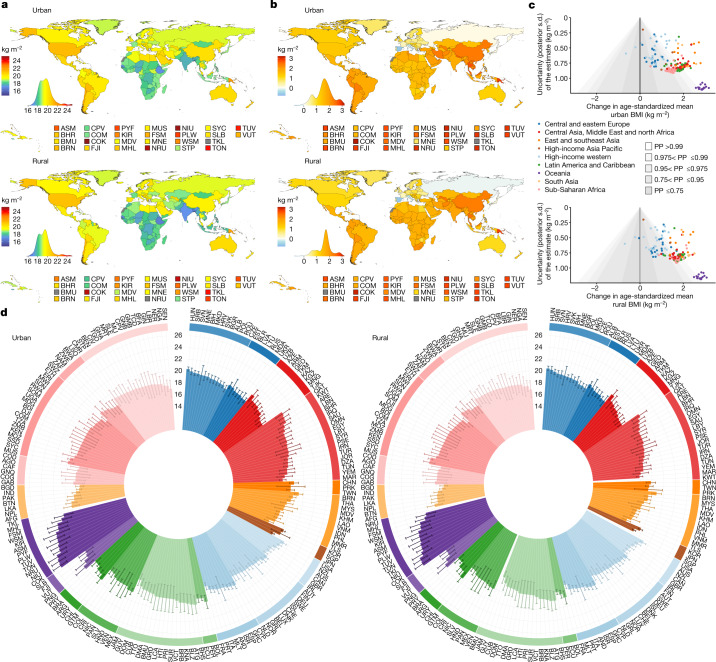
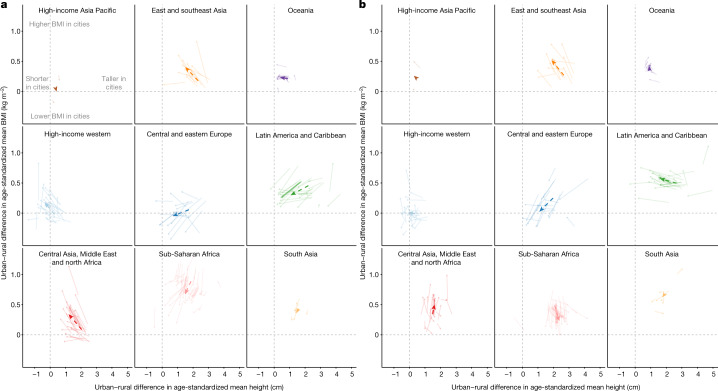
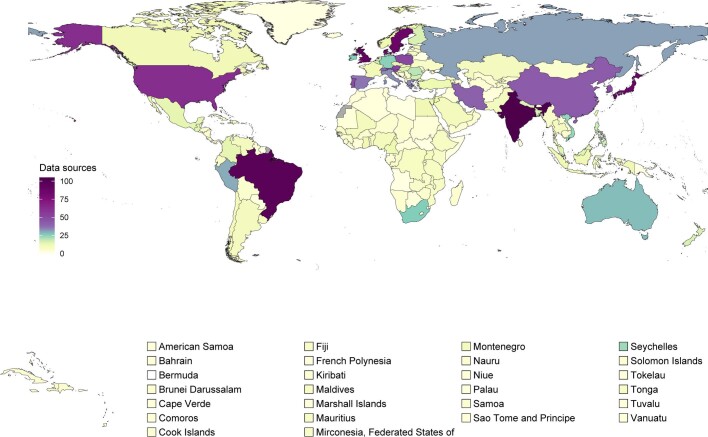
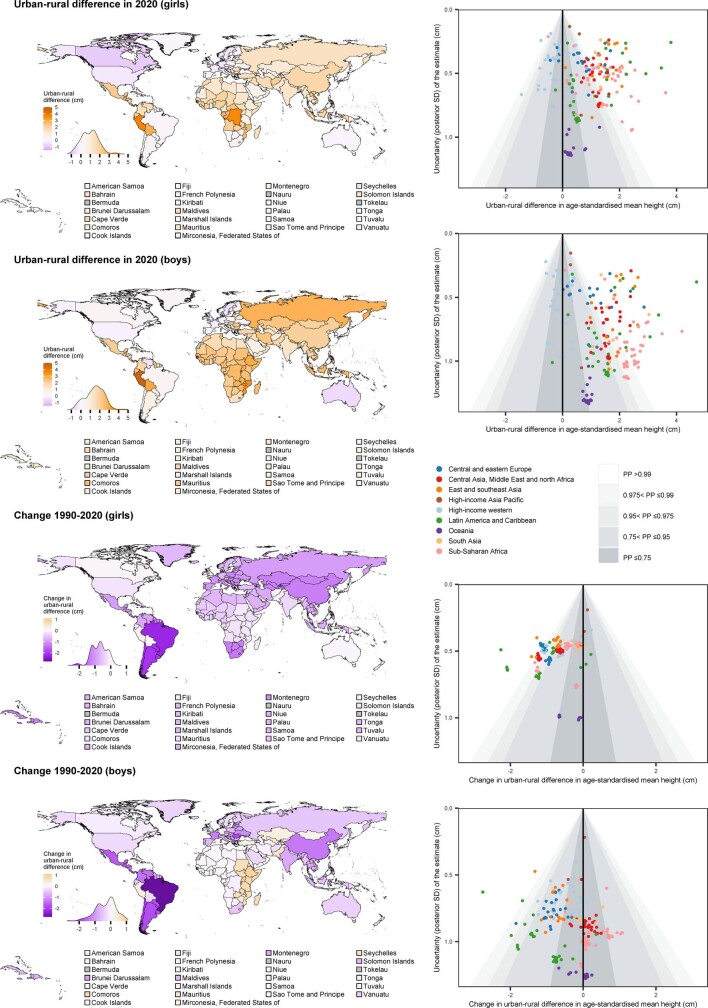
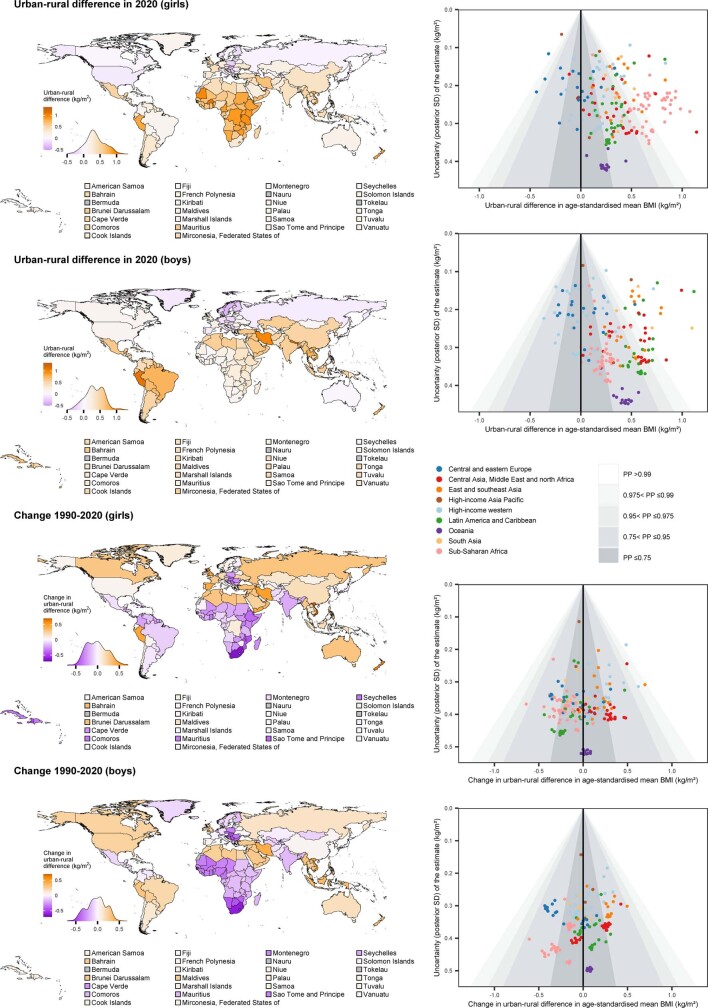
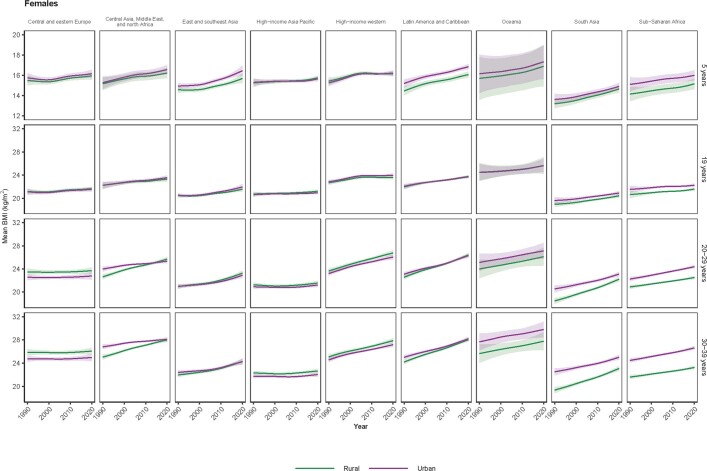
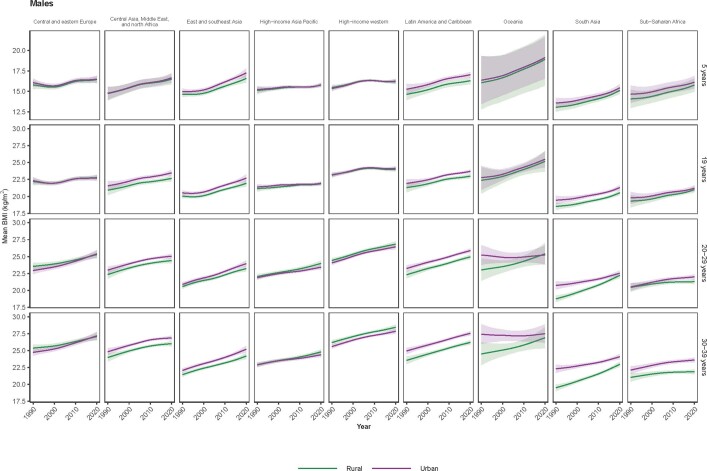
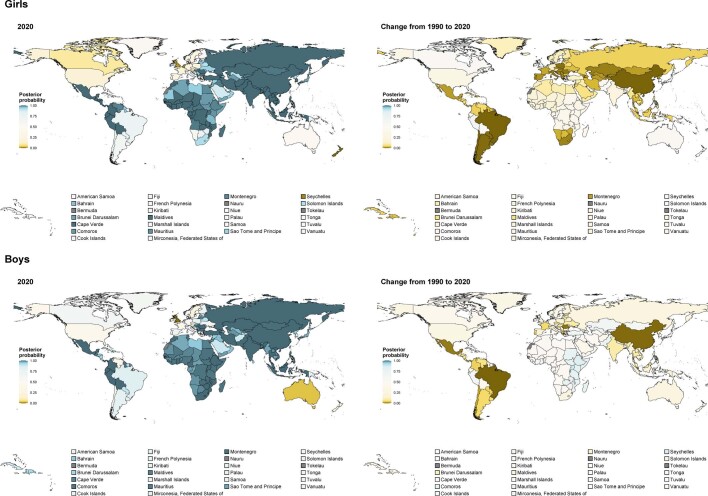
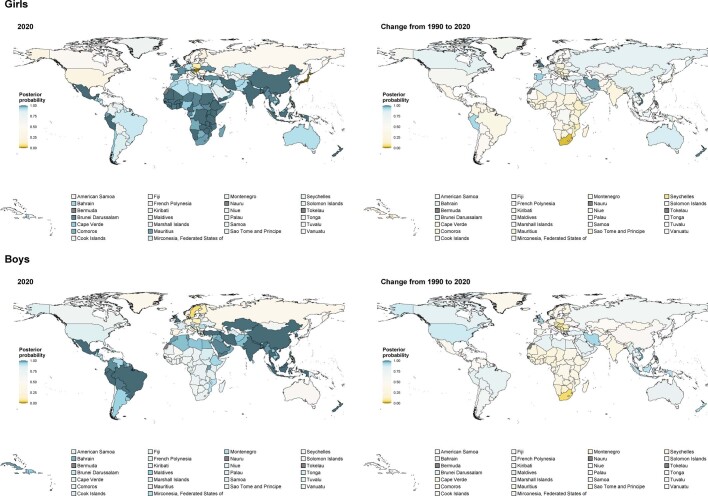
Optimal growth and development in childhood and adolescence is crucial for lifelong health and well-being1-6. Here we used data from 2,325 population-based studies, with measurements of height and weight from 71 million participants, to report the height and body-mass index (BMI) of children and adolescents aged 5-19 years on the basis of rural and urban place of residence in 200 countries and territories from 1990 to 2020. In 1990, children and adolescents residing in cities were taller than their rural counterparts in all but a few high-income countries. By 2020, the urban height advantage became smaller in most countries, and in many high-income western countries it reversed into a small urban-based disadvantage. The exception was for boys in most countries in sub-Saharan Africa and in some countries in Oceania, south Asia and the region of central Asia, Middle East and north Africa. In these countries, successive cohorts of boys from rural places either did not gain height or possibly became shorter, and hence fell further behind their urban peers. The difference between the age-standardized mean BMI of children in urban and rural areas was <1.1 kg m-2 in the vast majority of countries. Within this small range, BMI increased slightly more in cities than in rural areas, except in south Asia, sub-Saharan Africa and some countries in central and eastern Europe. Our results show that in much of the world, the growth and developmental advantages of living in cities have diminished in the twenty-first century, whereas in much of sub-Saharan Africa they have amplified.


Conflict of interest statement

M.E. reports a charitable grant from the AstraZeneca Young Health Programme.

Figures

Fig. 1
Fig. 1. Change in the urban–rural height difference from 1990 to 2020.
a,b, Change in the urban–rural difference in age-standardized mean height in relation to the change in age-standardized mean rural height in girls (a) and boys (b). Each solid arrow in lighter shade shows one country beginning in 1990 and ending in 2020. The dashed arrows in darker shade show the regional averages, calculated as the unweighted arithmetic mean of the values for all countries in each region along the horizontal and vertical axes. For the urban–rural difference, a positive number shows a higher urban mean height and a negative number shows higher rural mean height. See Extended Data Fig. 2 for urban–rural differences in age-standardized mean height and their change over time shown as maps, together with uncertainties in the estimates. See Supplementary Fig. 4a for results at ages 5, 10, 15 and 19 years. We did not estimate the difference between rural and urban height for countries classified as entirely urban (Bermuda, Kuwait, Nauru and Singapore) or entirely rural (Tokelau).
Fig. 2
Fig. 2. Urban and rural height in 2020 and the change from 1990 to 2020 for girls.
a, Age-standardized mean height in 2020 by urban and rural place of residence for girls. The density plots show the distribution of estimates across countries. b, Age-standardized change in mean height from 1990 to 2020 by urban and rural place of residence for girls. The density plots show the distribution of estimates across countries. c, Change in mean height from 1990 to 2020 in relation to the uncertainty of the change measured by posterior standard deviation. Each point in the scatter plots shows one country. Shaded areas approximately show the PP of an estimated change being a true increase or decrease. The PP of a decrease is one minus that of an increase. If an increase in mean height is statistically indistinguishable from a decrease, the PP of an increase and a decrease is 0.50. PPs closer to 0.50 indicate more uncertainty, whereas those towards 1 indicate more certainty of change. d, Age-standardized mean height in 2020 for all countries. The height of each column is the posterior mean estimate shown together with its 95% CrI. Countries are ordered by region and super-region. See Extended Data Fig. 4 for a map of PP of the estimated change. See Supplementary Fig. 5 for results at ages 5, 10, 15 and 19 years. See Supplementary Table 3 for numerical results, including Crls, as age-standardized and at ages 5, 10, 15 and 19 years. We did not estimate mean rural height in countries classified as entirely urban (Bermuda, Kuwait, Nauru and Singapore), mean urban height in countries classified as entirely rural (Tokelau) or their change over time in these countries, as indicated in grey. Countries are labelled using their International Organization for Standardization (ISO) 3166-1 alpha-3 codes. Afghanistan, AFG; Albania, ALB; Algeria, DZA; American Samoa, ASM; Andorra, AND; Angola, AGO; Antigua and Barbuda, ATG; Argentina, ARG; Armenia, ARM; Australia, AUS; Austria, AUT; Azerbaijan, AZE; Bahamas, BHS; Bahrain, BHR; Bangladesh, BGD; Barbados, BRB; Belarus, BLR; Belgium, BEL; Belize, BLZ; Benin, BEN; Bermuda, BMU; Bhutan, BTN; Bolivia, BOL; Bosnia and Herzegovina, BIH; Botswana, BWA; Brazil, BRA; Brunei Darussalam, BRN; Bulgaria, BGR; Burkina Faso, BFA; Burundi, BDI; Cabo Verde, CPV; Cambodia, KHM; Cameroon, CMR; Canada, CAN; Central African Republic, CAF; Chad, TCD; Chile, CHL; China, CHN; Colombia, COL; Comoros, COM; Congo, COG; Cook Islands, COK; Costa Rica, CRI; Cote d'Ivoire, CIV; Croatia, HRV; Cuba, CUB; Cyprus, CYP; Czechia, CZE; Denmark, DNK; Djibouti, DJI; Dominica, DMA; Dominican Republic, DOM; DR Congo, COD; Ecuador, ECU; Egypt, EGY; El Salvador, SLV; Equatorial Guinea, GNQ; Eritrea, ERI; Estonia, EST; Eswatini, SWZ; Ethiopia, ETH; Fiji, FJI; Finland, FIN; France, FRA; French Polynesia, PYF; Gabon, GAB; Gambia, GMB; Georgia, GEO; Germany, DEU; Ghana, GHA; Greece, GRC; Greenland, GRL; Grenada, GRD; Guatemala, GTM; Guinea Bissau, GNB; Guinea, GIN; Guyana, GUY; Haiti, HTI; Honduras, HND; Hungary, HUN; Iceland, ISL; India, IND; Indonesia, IDN; Iran, IRN; Iraq, IRQ; Ireland, IRL; Israel, ISR; Italy, ITA; Jamaica, JAM; Japan, JPN; Jordan, JOR; Kazakhstan, KAZ; Kenya, KEN; Kiribati, KIR; Kuwait, KWT; Kyrgyzstan, KGZ; Lao PDR, LAO; Latvia, LVA; Lebanon, LBN; Lesotho, LSO; Liberia, LBR; Libya, LBY; Lithuania, LTU; Luxembourg, LUX; Madagascar, MDG; Malawi, MWI; Malaysia, MYS; Maldives, MDV; Mali, MLI; Malta, MLT; Marshall Islands, MHL; Mauritania, MRT; Mauritius, MUS; Mexico, MEX; Micronesia (Federated States of), FSM; Moldova, MDA; Mongolia, MNG; Montenegro, MNE; Morocco, MAR; Mozambique, MOZ; Myanmar, MMR; Namibia, NAM; Nauru, NRU; Nepal, NPL; Netherlands, NLD; New Zealand, NZL; Nicaragua, NIC; Niger, NER; Nigeria, NGA; Niue, NIU; North Korea, PRK; North Macedonia, MKD; Norway, NOR; Occupied Palestinian Territory, PSE; Oman, OMN; Pakistan, PAK; Palau, PLW; Panama, PAN; Papua New Guinea, PNG; Paraguay, PRY; Peru, PER; Philippines, PHL; Poland, POL; Portugal, PRT; Puerto Rico, PRI; Qatar, QAT; Romania, ROU; Russian Federation, RUS; Rwanda, RWA; Saint Kitts and Nevis, KNA; Saint Lucia, LCA; Samoa, WSM; Sao Tome and Principe, STP; Saudi Arabia, SAU; Senegal, SEN; Serbia, SRB; Seychelles, SYC; Sierra Leone, SLE; Singapore, SGP; Slovakia, SVK; Slovenia, SVN; Solomon Islands, SLB; Somalia, SOM; South Africa, ZAF; South Korea, KOR; South Sudan, SSD; Spain, ESP; Sri Lanka, LKA; Saint Vincent and the Grenadines, VCT; Sudan, SDN; Suriname, SUR; Sweden, SWE; Switzerland, CHE; Syrian Arab Republic, SYR; Taiwan, TWN; Tajikistan, TJK; Tanzania, TZA; Thailand, THA; Timor-Leste, TLS; Togo, TGO; Tokelau, TKL; Tonga, TON; Trinidad and Tobago, TTO; Tunisia, TUN; Turkey, TUR; Turkmenistan, TKM; Tuvalu, TUV; Uganda, UGA; Ukraine, UKR; United Arab Emirates, ARE; United Kingdom, GBR; United States of America, USA; Uruguay, URY; Uzbekistan, UZB; Vanuatu, VUT; Venezuela, VEN; Vietnam, VNM; Yemen, YEM; Zambia, ZMB.
Fig. 3
Fig. 3. Urban and rural height in 2020 and change from 1990 to 2020 for boys.
ad, See the caption for Fig. 2 for descriptions of the contents of the figure and for definitions. We did not estimate mean rural height in countries classified as entirely urban (Bermuda, Kuwait, Nauru and Singapore), mean urban height in countries classified as entirely rural (Tokelau) or their change over time, as indicated in grey.
Fig. 4
Fig. 4. Change in the urban–rural BMI difference from 1990 to 2020.
a,b, Change in urban–rural difference in age-standardized mean BMI for girls (a) and boys (b) in relation to change in age-standardized mean rural BMI. See the caption for Fig. 1 for a description of the contents of this figure. See Extended Data Fig. 3 for urban–rural differences in age-standardized mean BMI and their change over time shown as maps, together with uncertainties in the estimates. See Supplementary Fig. 4b for results at ages 5, 10, 15 and 19 years. We did not estimate the difference between rural and urban BMI for countries classified as entirely urban (Bermuda, Kuwait, Nauru and Singapore) or entirely rural (Tokelau).
Fig. 5
Fig. 5. Urban and rural BMI in 2020 and change from 1990 to 2020 for girls.
ad, See the caption for Fig. 2 for descriptions of the contents of the figure and for definitions. See Extended Data Fig. 5 for a map of PP of the estimated change. See Supplementary Fig. 6 for results at ages 5, 10, 15 and 19 years. See Supplementary Table 4 for numerical results, including CrIs, as age-standardized and at ages 5, 10, 15 and 19 years. We did not estimate mean rural BMI in countries classified as entirely urban (Singapore, Bermuda and Nauru), mean urban BMI in areas classified as entirely countries (Tokelau) or their change over time, as indicated in grey.
Fig. 6
Fig. 6. Urban and rural BMI in 2020 and change from 1990 to 2020 for boys.
ad, See the caption for Fig. 2 for descriptions of the contents of the figure and for definitions. We did not estimate mean rural BMI in countries classified as entirely urban (Singapore, Bermuda and Nauru), mean urban BMI in countries classified as entirely rural (Tokelau) or their change over time, as indicated in grey.
Fig. 7
Fig. 7. Change in the urban–rural height and BMI difference from 1990 to 2020.
a,b, Change in the urban–rural difference in age-standardized mean height and the urban–rural difference in age-standardized mean BMI in girls (a) and boys (b). See the caption for Fig. 1 for a description of the contents of this figure. See Supplementary Fig. 4c for results at ages 5, 10, 15 and 19 years. We did not estimate the difference between rural and urban height and BMI for countries classified as entirely urban (Bermuda, Kuwait, Nauru and Singapore) or entirely rural (Tokelau).
Extended Data Fig. 1
Extended Data Fig. 1. Number of data sources used in the analysis, by country
.
Extended Data Fig. 2
Extended Data Fig. 2. Urban-rural height difference in 2020 and change from 1990 to 2020.
The top two maps show the urban-rural difference in age-standardised mean height in 2020 for girls and boys resepectively. A positive number shows higher urban mean height and a negative number shows higher rural mean height. The bottom two maps show the change from 1990 to 2020. The density plot below each map shows the distribution of estimates across countries. The top two scatter plots show the urban-rural difference in age-standardised mean height in relation to the uncertainty of the difference measured by posterior s.d. The bottom two scatter plots show the change from 1990 to 2020 in urban-rural difference in mean height in relation to the uncertainty of the change measured by posterior s.d. Each point in the scatter plots shows one country. Shaded areas approximately show the posterior probability (PP) of a true difference (top two scatter plots) and of a true increase or decrease in difference (bottom two scatter plots). See Extended Data Fig. 8 for PPs of the urban-rural difference in age-standardised mean height and its change. See Supplementary Fig. 7 for results at ages 5, 10, 15 and 19 years. We did not estimate the difference between rural and urban height for countries classified as entirely urban (Bermuda, Kuwait, Nauru and Singapore) or entirely rural (Tokelau), as indicated in grey.
Extended Data Fig. 3
Extended Data Fig. 3. Urban-rural body-mass index (BMI) difference in 2020 and change from 1990 to 2020.
See Extended Data Fig. 2 caption for descriptions of the contents of the figure and for definitions. See Extended Data Fig. 9 for PP of the urban-rural difference in age-standardised mean BMI and its change. See Supplementary Fig. 8 for results at ages 5, 10, 15 and 19 years. We did not estimate the difference between rural and urban BMI for countries classified as entirely urban (Bermuda, Kuwait, Nauru and Singapore) or entirely rural (Tokelau), as indicated in grey.
Extended Data Fig. 4
Extended Data Fig. 4. Posterior probability of increase in mean height in urban and rural areas from 1990 to 2020.
The maps show the PP that the age-standardised mean height increased from 1990 to 2020. The PP of a decrease is one minus that of an increase. If an increase in mean height is statistically indistinguishable from a decrease, the PP is 0.50. PPs closer to 0.50 indicate more uncertainty, those towards 1 indicate more certainty of an increase, and those towards 0 indicate more certainty of a decrease. We did not estimate PP for change in mean rural height for countries classified as entirely urban (Bermuda, Kuwait, Nauru and Singapore) or change in mean urban height for countries classified as entirely rural (Tokelau), as indicated in grey.
Extended Data Fig. 5
Extended Data Fig. 5. Posterior probability of increase in mean body-mass index (BMI) in urban and rural areas from 1990 to 2020.
The maps show the posterior probability (PP) that the age-standardised mean BMI increased from 1990 to 2020. The PP of a decrease is one minus that of an increase. We did not estimate PP for change in mean rural BMI in countries classified as entirely urban (Bermuda, Kuwait, Nauru and Singapore) or change in mean urban BMI in countries classified as entirely rural (Tokelau), as indicated in grey.
Extended Data Fig. 6
Extended Data Fig. 6. Trends in body-mass index (BMI) by place of residence for children, adolescents and young adults for females.
The figure shows trends in mean BMI at ages five and 19 years, and in age-standardised mean BMI for young adults (20–29 years and 30–39 years) for females. Shaded areas show the 95% CrIs. Trend for young adults were estimated using a model similar to the one described in Methods, where BMI-age patterns were allowed to vary flexibly via a cubic spline function without knots.
Extended Data Fig. 7
Extended Data Fig. 7. Trends in body-mass index (BMI) by place of residence for children, adolescents and young adults for males.
The figure shows trends in mean BMI at ages five and 19 years, and in age-standardised mean BMI for young adults (20–29 years and 30–39 years) for males. See Extended Data Fig. 6 caption for description of figure contents.
Extended Data Fig. 8
Extended Data Fig. 8. Posterior probability of urban-rural height difference in 2020 and its increase from 1990 to 2020.
The maps show the posterior probability (PP) that age-standardised mean height in 2020 in urban areas was higher than in rural areas (left-hand panels), and the PP that the urban-rural difference in age-standardised mean height increased from 1990 to 2020 (right-hand panels). For 2020, if estimated age-standardised mean urban height is statistically indistinguishable from rural height, the PP is 0.50. PPs closer to 0.50 indicate more uncertainty, those towards 1 indicate more certainty of urban children being taller, and those towards 0 indicate more certainty of rural being taller. For change, if an increase in urban-rural difference in mean height is statistically indistinguishable from a decrease, the PP is 0.50. PPs closer to 0.50 indicate more uncertainty, those towards 1 indicate more certainty of an increase in the urban-rural height difference, and those towards 0 indicate more certainty of a decrease. We did not estimate the PP for differences between rural and urban height for countries classified as entirely urban (Bermuda, Kuwait, Nauru and Singapore) or entirely rural (Tokelau), as indicated in grey.
Extended Data Fig. 9
Extended Data Fig. 9. Posterior probability of urban-rural body-mass index (BMI) difference in 2020 and its increase from 1990 to 2020.
The maps show the posterior probability (PP) that age-standardised mean BMI in 2020 in urban areas was higher than in rural areas (left-hand panels), and the PP that the urban-rural difference in mean BMI increased from 1990 to 2020 (right-hand panels). We did not estimate the PP for differences between rural and urban BMI for countries classified as entirely urban (Bermuda, Kuwait, Nauru and Singapore) or entirely rural (Tokelau), as indicated in grey.

References

    1. Prentice AM, et al. Critical windows for nutritional interventions against stunting. Am. J. Clin. Nutr. 2013;97:911–918. doi: 10.3945/ajcn.112.052332. - DOI - PMC - PubMed
    1. Tanner JM. Growth as a mirror of the condition of society: secular trends and class distinctions. Acta Paediatr. Jpn. 1987;29:96–103. doi: 10.1111/j.1442-200X.1987.tb00015.x. - DOI - PubMed
    1. Strauss J, Thomas D. Health, nutrition, and economic development. J. Econ. Lit. 1998;36:766–817.
    1. Nüesch E, et al. Adult height, coronary heart disease and stroke: a multi-locus Mendelian randomization meta-analysis. Int. J. Epidemiol. 2016;45:1927–1937. doi: 10.1093/ije/dyv074. - DOI - PMC - PubMed
    1. Park MH, Falconer C, Viner RM, Kinra S. The impact of childhood obesity on morbidity and mortality in adulthood: a systematic review. Obes. Rev. 2012;13:985–1000. doi: 10.1111/j.1467-789X.2012.01015.x. - DOI - PubMed

Publication types