. 2023 Mar 30;22(1):63.
doi: 10.1186/s12943-023-01753-7.

Reprogramming anchorage dependency by adherent-to-suspension transition promotes metastatic dissemination

Affiliations

Reprogramming anchorage dependency by adherent-to-suspension transition promotes metastatic dissemination

Hyunbin D Huh et al. Mol Cancer. .

Erratum in

Abstract

Background: Although metastasis is the foremost cause of cancer-related death, a specialized mechanism that reprograms anchorage dependency of solid tumor cells into circulating tumor cells (CTCs) during metastatic dissemination remains a critical area of challenge.

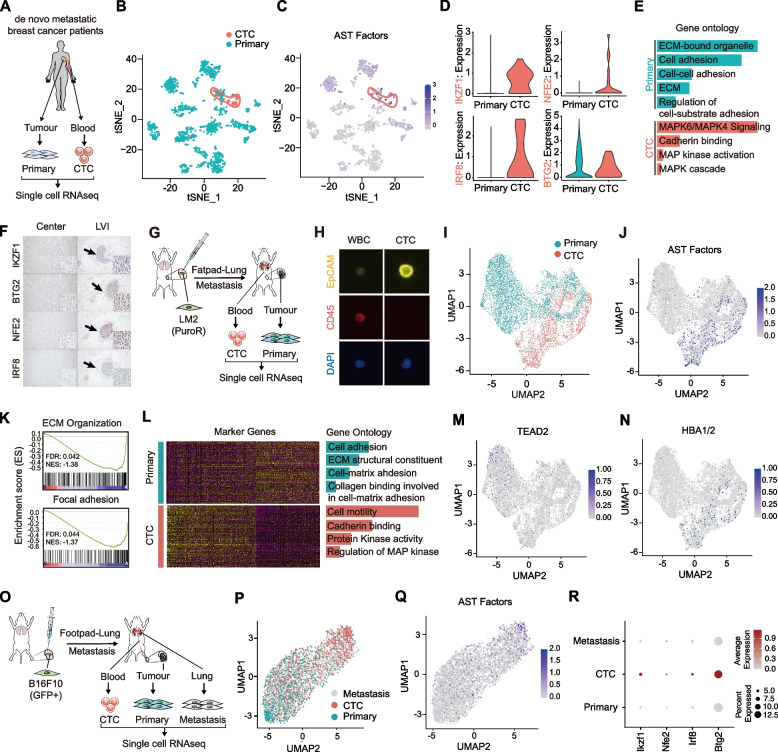
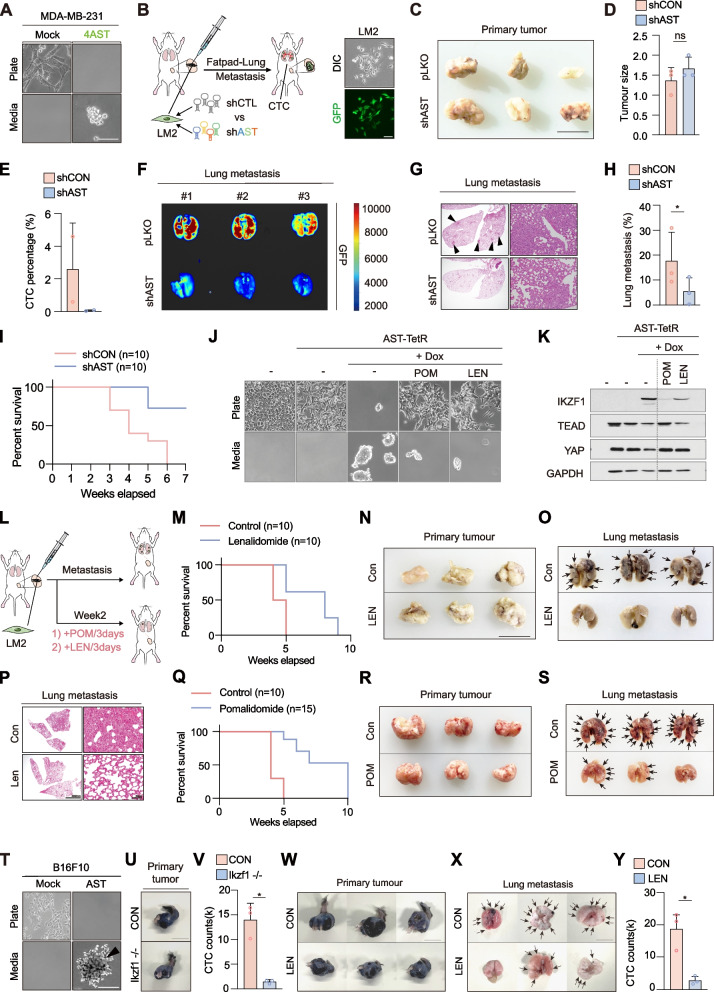
Methods: We analyzed blood cell-specific transcripts and selected key Adherent-to-Suspension Transition (AST) factors that are competent to reprogram anchorage dependency of adherent cells into suspension cells in an inducible and reversible manner. The mechanisms of AST were evaluated by a series of in vitro and in vivo assays. Paired samples of primary tumors, CTCs, and metastatic tumors were collected from breast cancer and melanoma mouse xenograft models and patients with de novo metastasis. Analyses of single-cell RNA sequencing (scRNA-seq) and tissue staining were performed to validate the role of AST factors in CTCs. Loss-of-function experiments were performed by shRNA knockdown, gene editing, and pharmacological inhibition to block metastasis and prolong survival.

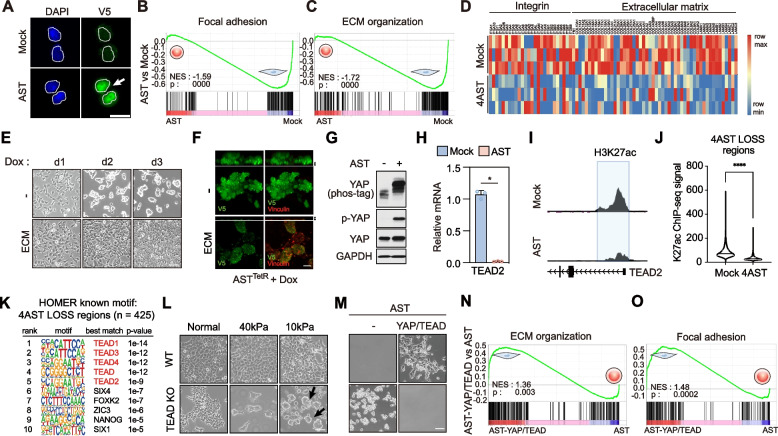
Results: We discovered a biological phenomenon referred to as AST that reprograms adherent cells into suspension cells via defined hematopoietic transcriptional regulators, which are hijacked by solid tumor cells to disseminate into CTCs. Induction of AST in adherent cells 1) suppress global integrin/ECM gene expression via Hippo-YAP/TEAD inhibition to evoke spontaneous cell-matrix dissociation and 2) upregulate globin genes that prevent oxidative stress to acquire anoikis resistance, in the absence of lineage differentiation. During dissemination, we uncover the critical roles of AST factors in CTCs derived from patients with de novo metastasis and mouse models. Pharmacological blockade of AST factors via thalidomide derivatives in breast cancer and melanoma cells abrogated CTC formation and suppressed lung metastases without affecting the primary tumor growth.

Conclusion: We demonstrate that suspension cells can directly arise from adherent cells by the addition of defined hematopoietic factors that confer metastatic traits. Furthermore, our findings expand the prevailing cancer treatment paradigm toward direct intervention within the metastatic spread of cancer.


Conflict of interest statement

The authors declare that they have no conflict of interests.

Figures

Fig. 1
Fig. 1
AST factors reprogram anchorage dependency. A Schematic of the transcriptomic analysis of 141 adhesion cells and 39 suspension cell lines using RNA expression data from the ENCODE and The Human Protein Atlas databases to identify anchorage-dependent differentially expressed gene profile. B Correlation plot of gene expression in adhesion cells versus suspension cells. Correlations were calculated using the Pearson method. C Volcano plot showing differentially expressed genes selected based on |fold changes|> 2, |differences|> 1, and p-values < 0.05. D Selection of 20 hematopoietic transcriptional regulators as candidate AST factors. E Heatmap of the 20 candidate AST factors in 90 adhesion and 23 suspension cell lines. F Schematic overview of the experimental design for generating HEK293A-20AST cells by lentiviral expression of AST factors. G, Representative cell images of HEK293A-mock or 20AST cell morphology in culture plate and media. H Immunoblotting analysis of the expression of V5-tagged AST factors in HEK293A-20AST cells. I Representative fluorescence images of cell viability in cell culture media of HEK293A-mock and 20AST cells stained using LIVE/DEAD cell imaging assay. Green, Live; Red, Dead. Scale bar, 100 μm. J Measurements of cell proliferation rate between adherent mock and suspended 20 AST cells. K Images of time-lapse microscopy showing spontaneous cell detachment of HEK293A-4ASTTetR cells upon doxycycline treatment. L Immunoblotting analysis of the expression of V5-tagged AST factors in HEK293A-20ASTTetR cells upon doxycycline treatment M-P Schematic for narrowing down from 20 to 10 (M), and then from 10 to 4 (N) AST candidates via multiple trials of AST induction. Representative cell images of HEK293A-10AST (N) or 4AST (P) cells in culture plates and media. Q Measurement of AST efficiency by subtracting individual factors from 4 AST factors. R Volcano plot showing mRNA expression of transcription factors. x-axis, contrast in expression between suspension and adhesion cells; y-axis, p-value. 20 candidate AST factors (orange) were statistically upregulated in suspension cells versus adhesion cells. Upregulation, fold changes > 2, p-values < 0.05. S Consecutive reprogramming of anchorage dependency in HEK293A-ASTTetR cells by the addition and removal of doxycycline. Scale bars, 50 μm
Fig. 2
Fig. 2
AST factor-mediated YAP-TEAD suppression dissociates cell–matrix interaction. A Immunofluorescence analysis of nuclear expression of ectopic V5-tagged 4 AST factors in HEK293A-4AST cells. Scale bar, 20 μm. B-D GSEA and heatmap of focal adhesion- and ECM-related genes in HEK293A-4AST cells compared to control cells. E–F Effect of restoring ECM (E, fibronectin) and focal adhesions (F, green, V5; red, vinculin) in doxycycline-induced HEK293A-ASTTetR cells. Scale bar 50 μm (E), 10 μm (F), Upper images; z-section, scale bar, 5 μm (F). G Immunoblotting analysis of AST factor-induced phosphorylation and inhibition of YAP. H Quantitative real-time PCR analysis of the TEAD2 transcript levels in 4 AST cells. I Analysis of H3K27ac ChIP-seq profiles at TEAD2 locus in HEK293A-mock and AST cells. J Analysis of H3K27ac ChIP-seq signal at the 4AST LOSS region in AST cells. Mean values are shown with error bars representing the s.d. of n = 3 independent replicates. *p < 0.05. K List of the top ten known motifs enriched at AST LOSS regions (n = 425). L Representative images of partial AST induction in TEAD KO cells cultured in low stiffness plates (40 kPa or 10 kPa). Scale bar, 50 μm. M Restoration of anchorage dependency in AST cells by ectopic expression of TEAD2 and constitutively active YAP-S127A. Scale bar, 50 μm. N–O Restoration of focal adhesion- and ECM-related gene signatures in HEK293A-4AST cells by reconstitution of TEAD2 and constitutively active YAP-S127A
Fig. 3
Fig. 3
AST factor-mediated globin induction confers anoikis resistance. A Measurement of cell detachment-induced ROS production in HEK293A-4AST (right) versus trypsinized cells (left). Green, ROS. Scale bar, 50 μm. B Heatmap of genes involved in ROS defense mechanisms in HEK293A-mock and 4AST cells. C Quantitative real-time PCR analysis of the HBA1/2 transcript levels in 4AST cells. D Analysis of H3K27ac ChIP-seq profiles at HBA1 and HBA2 loci in HEK293A-mock and 4AST cells. E Representative fluorescence images of ROS accumulation in HEK293A-4AST cells treated with scramble or HBA1/2 siRNAs with or without N-acetylcysteine (NAC). F Measurement of cell viability of HEK293A-4AST cells upon siRNA-mediated HBA1/2 depletion. G Fluorescence images of ROS accumulation in HEK293A-4AST cells by hemin treatment. Scale bar, 50 μm. H Measurement of cell viability in HEK293A-4AST cells upon hemin treatment. n = 3. I Schematic of mechanistic insights into AST factor-mediated reprogramming of anchorage dependency. For (C and F) mean values are shown with error bars representing the s.d. of n = 3 independent replicates. *p < 0.05
Fig. 4
Fig. 4
Induction of AST factors in disseminated breast cancer CTCs. A Schematic overview of the isolation and scRNA-seq analysis of primary tumor cells and CTCs from de novo metastatic breast cancer patients. CTCs were isolated using HDM chips. B tSNE plot representing 1,509 cancer cells (EpCAM+) sorted from breast cancer tissues and PBMC of three de novo metastatic breast cancer patients analyzed by scRNA-seq. Turquoise dots, 1,488 cells from breast tissues; orange dots, 21 CTCs from blood samples. CTCs are in region marked with orange boundary. C, Scaled and aggregated transcriptional expression of 4AST factor genes. Cell positions are based on tSNE plot in (B). D Violin plots showing normalized expression levels of IKZF1, IRF8, NFE2, and BTG2 in each group of (B). E Bar chart showing gene ontology (GO) analysis of differentially expressed genes (DEGs) between primary tumor cells and CTCs. Length of each bar, FDR-corrected p-value of each term. F Representative histologic images of AST factor expression in lymphovascular invasion (LVI) from primary human breast cancer patients. G Schematic overview of the isolation and scRNA-seq analysis of LM2-derived primary tumor cells and CTCs from orthotopic model of breast cancer metastasis. PuroR+-LM2 cells were injected into mammary fat pads of NSG mice and CTCs were subsequently isolated using HDM chips. H Immunofluorescence analysis of EpCAM+ and CD45 CTCs. Yellow, EpCAM; red, CD45. I UMAP embedding of analyzed transcriptomes of 3,006 CTCs (orange) and 5,511 primary tumor cells (turquoise). J Scaled and aggregated transcriptional expression of 4AST factor genes. Cell positions are from the UMAP plot in (I). K GSEA of ECM organization- and focal adhesion-related genes in CTCs compared to primary tumor cells. L Heatmap of GO analysis of 105 and 100 genes differentially expressed in CTCs and primary tumor cells. M–N Feature plots of cells showing the expression levels of TEAD2 (M) and HBA1/2 (N). Cell positions are from the UMAP plot in (l). O Schematic showing the procedure used for the isolation and scRNA-seq analysis of B16F10-derived primary tumor cells, CTCs, and metastatic tumor cells from an orthotopic model of melanoma metastasis. GFP-positive cells were injected into the footpads of C57BL/6N mice and tumor cells were subsequently isolated using FACS. P UMAP embedding of analyzed transcriptomes of 1,139 CTCs (orange), 1,129 primary tumor cells (turquoise) and 1,630 metastatic tumor cells (light grey). Q Feature plots of cells showing the expression levels of 4AST factor genes. R Dot plot showing the average expression level of the 4 factors, Btg2, Ikzf1, Irf8, and Nfe2, in primary tumor, CTCs, and metastasized lung nodules, respectively
Fig. 5
Fig. 5
Targeting AST factors suppress cancer cell dissemination and metastasis. A Representative images of MDA-MB-231-mock versus 4AST cell morphology. Scale bar, 50 μm. B Schematic overview of mammary fat pad xenografts of 4AST factor depleted LM2 cells. C Representative images of primary tumors dissected after injection of mock or 4AST factor depleted LM2 cells. D Measurement of primary tumor growth in LM2-mock versus 4AST factor-depleted tumors. n = 3; ns, not significant. E Measurement of EpCAM+/CD45 CTC counts normalized by total blood cells from duplicated slides harvested from control and 4AST factor-depleted LM2 baring mice. F Bioluminescence ex vivo images of lung metastases after LM2 fat pad injection. G-H Measurement of lung metastases quantified by the number of metastatic lung nodules derived from mock versus AST factor-depleted LM2 cells. I Kaplan–Meier survival plot showing the survival rates of mice injected with mock or 4AST factor-depleted LM2 cells, n = 10. J Images of HEK293A-ASTTetR cells co-treated with pomalidomide (100 μM) or lenalidomide (50 μM) after doxycycline-mediated AST induction for 3 days. Scale bar, 50 μm. K Blockade of IKZF1 accumulation in doxycycline-induced HEK293A-ASTTetR cells co-treated with pomalidomide or lenalidomide. L Schematic of the orthotopic breast tumor model subjected to intraperitoneal injection of pomalidomide (10 mg/kg) or lenalidomide (10 mg/kg) once every 3 days. M Kaplan–Meier survival plot showing the survival rates of LM2-injected mice treated with lenalidomide (10 mg/kg). Control, n = 10; lenalidomide; n = 10. N–O Images of primary tumors (N) and lungs (O) dissected from mice treated with either vehicle or lenalidomide. P Measurement of lung metastases by vehicle versus lenalidomide administration quantified by number of metastatic lung nodules. Q Kaplan–Meier survival plot showing the survival rates of LM2-injected mice treated with pomalidomide (10 mg/kg). Control, n = 10; pomalidomide; n = 15. R-S Images of primary tumors (R) and lungs (S) dissected from mice treated with either vehicle or pomalidomide. T Representative images of B16F10-mock versus 4AST cell morphology. Scale bar, 50 μm. U Representative images of primary tumors resulting from B16F10 cell injection into mouse footpad. Above, B16F10-control primary tumor; Below, B16F10-Ikzf1−/−-derived primary tumor; Scale bar, 0.5 cm. V A bar plot showing the numbers of circulating tumor cells (CTCs) in B16F10-control and -IKZF1−/−-injected mouse blood, respectively. Error bars are means ± SD of n = 3 independent replicates. *p < 0.05. W A bar plot showing the numbers of CTCs in vehicle and lenalidomide-treated mouse blood, respectively. Error bars are means ± SD of n = 3 independent replicates. *p < 0.05. X–Y Images of primary tumors (X) and lungs (Y) dissected from mice treated with either vehicle or lenalidomide

References

    1. Takahashi K, Yamanaka S. Induction of pluripotent stem cells from mouse embryonic and adult fibroblast cultures by defined factors. Cell. 2006;126:663–676. doi: 10.1016/j.cell.2006.07.024. - DOI - PubMed
    1. Wang H, Yang Y, Liu J, Qian L. Direct cell reprogramming: approaches, mechanisms and progress. Nat Rev Mol Cell Biol. 2021;22:410–424. doi: 10.1038/s41580-021-00335-z. - DOI - PMC - PubMed
    1. Yang J, Antin P, Berx G, Blanpain C, Brabletz T, Bronner M, Campbell K, Cano A, Casanova J, Christofori G, et al. Guidelines and definitions for research on epithelial-mesenchymal transition. Nat Rev Mol Cell Biol. 2020;21:341–352. doi: 10.1038/s41580-020-0237-9. - DOI - PMC - PubMed
    1. Maniotis AJ, Folberg R, Hess A, Seftor EA, Gardner LM, Pe'er J, Trent JM, Meltzer PS, Hendrix MJ. Vascular channel formation by human melanoma cells in vivo and in vitro: vasculogenic mimicry. Am J Pathol. 1999;155:739–752. doi: 10.1016/S0002-9440(10)65173-5. - DOI - PMC - PubMed
    1. Park ES, Kim SJ, Kim SW, Yoon SL, Leem SH, Kim SB, Kim SM, Park YY, Cheong JH, Woo HG, et al. Cross-species hybridization of microarrays for studying tumor transcriptome of brain metastasis. Proc Natl Acad Sci U S A. 2011;108:17456–17461. doi: 10.1073/pnas.1114210108. - DOI - PMC - PubMed

Publication types