. 2023 Mar 30;21(1):116.
doi: 10.1186/s12951-023-01863-w.

Genetically engineered CXCR4-modified exosomes for delivery of miR-126 mimics to macrophages alleviate periodontitis

Affiliations

Genetically engineered CXCR4-modified exosomes for delivery of miR-126 mimics to macrophages alleviate periodontitis

Haotian Luo et al. J Nanobiotechnology. .

Abstract

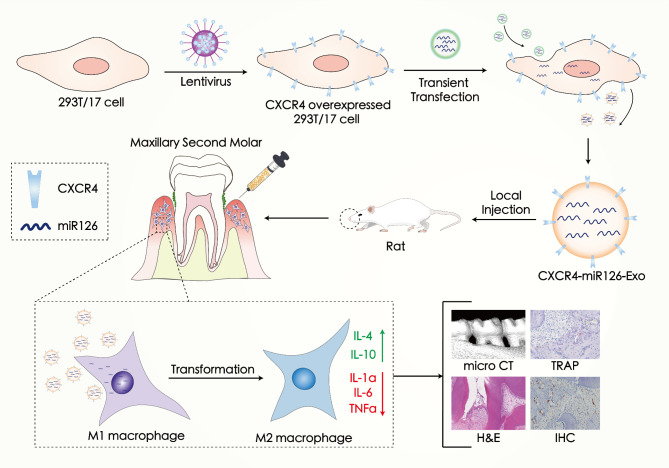
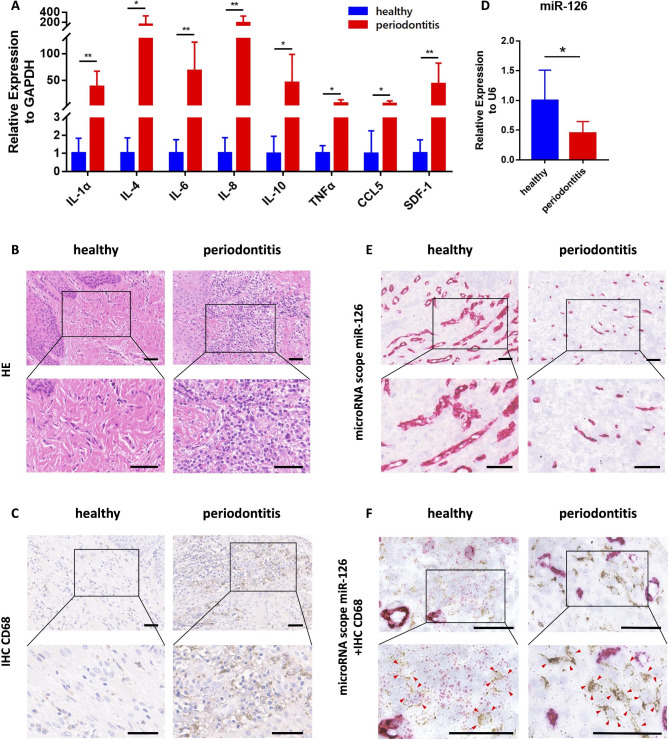
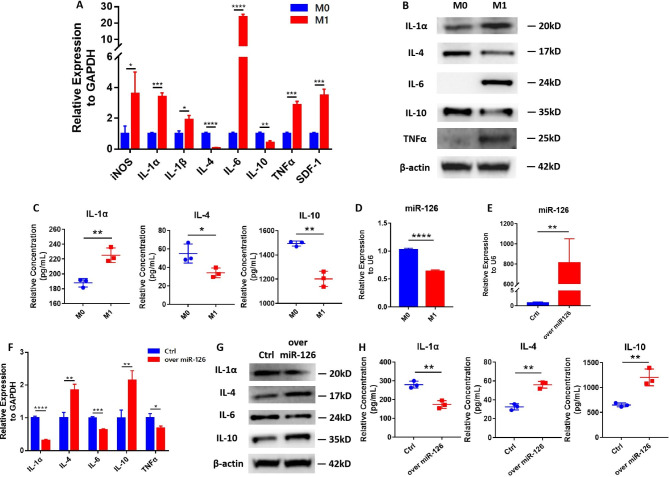
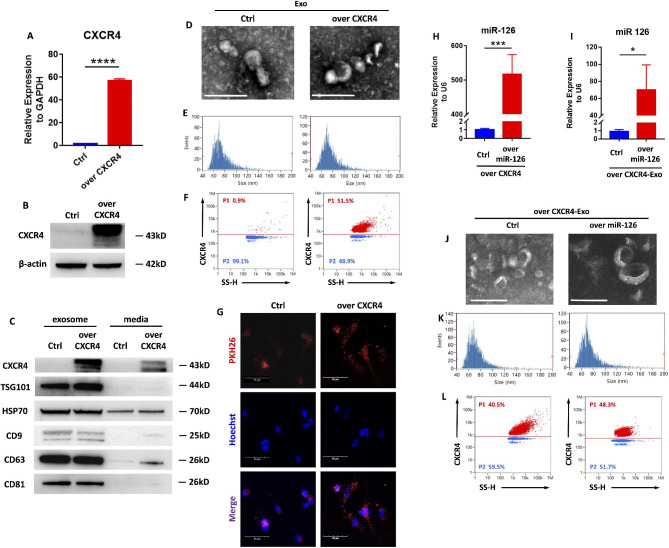
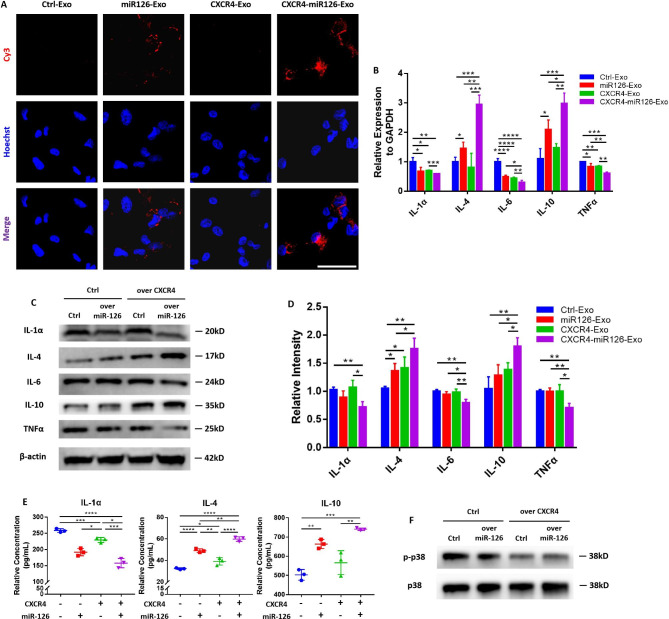
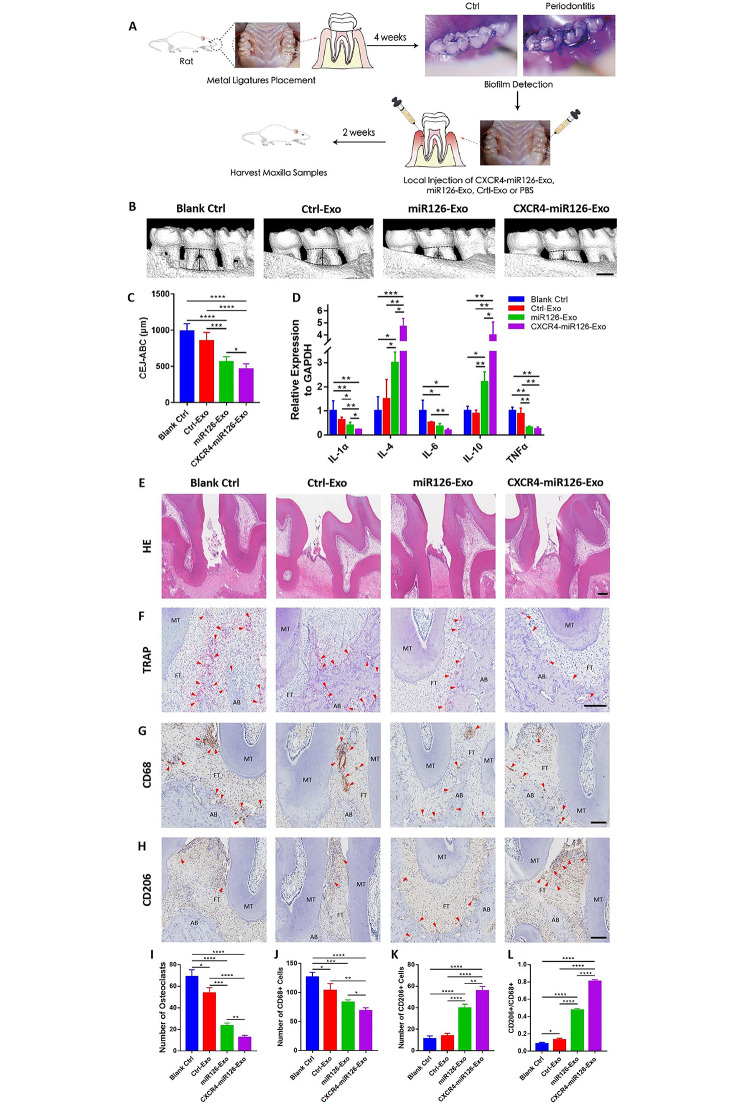
Biofilm-related diseases are a group of diseases that tolerate antimicrobial chemotherapies and therefore are refractory to treatment. Periodontitis, a non-device chronic biofilm disease induced by dental plaque, can serve as an excellent in vivo model to study the important effects of host factors on the biofilm microenvironment. Macrophage activity is one of the key factors that modulate the progression of inflammation-driven destruction in periodontitis; therefore it is an important host immunomodulatory factor. In this study, the reduction of microRNA-126 (miR-126) with the recruitment of macrophages in periodontitis was confirmed in clinical samples, and a strategy for targeted delivery of miR-126 to macrophages was explored. Exosomes overexpressing the C-X-C motif chemokine receptor 4 (CXCR4) loaded with miR-126 (CXCR4-miR126-Exo) was successfully constructed, which reduced off-target delivery to macrophages and regulated macrophages toward the anti-inflammatory phenotype. In vivo local injection of CXCR4-miR126-Exo into sites of periodontitis in rats effectively reduced bone resorption and osteoclastogenesis and inhibited the progression of periodontitis. These results provide new insights for designing novel immunomodulatory factor targeted delivery systems to treat periodontitis and other biofilm-related diseases.

Keywords: Biofilm diseases; Extracellular vesicles; Gene therapy; Immunomodulation; Targeted delivery.


Conflict of interest statement

The authors declare no conflict of interest.

Figures

Fig. 1
Fig. 1
Schematic illustration of CXCR4-miR126-Exo production, targeting, and regulation of periodontitis in vivo
Fig. 2
Fig. 2
miR-126 decreased with macrophage recruitment in periodontitis (A) Gene expression levels of various inflammatory cytokines in the periodontal gingiva of healthy volunteers and periodontitis patients (n = 8 per group). Data are represented as mean ± SD. *P < 0.05, **P < 0.01. (B) H&E staining of the gingiva from healthy volunteers and periodontitis patients. Scale bar = 50 μm. (C) Representative IHC staining images of CD68 in two groups. Scale bar = 50 μm. (D) qPCR analysis of miR-126 gene expression of the periodontal gingiva from healthy volunteers and periodontitis patients (n = 8 per group). Data are represented as mean ± SD. *P < 0.05. (E) MicroRNA Scope staining images of miR-126 in periodontium from the two groups are shown. Scale bar = 50 μm. (F) MicroRNA Scope staining images of miR-126 and representative immunohistochemical staining images of CD68 are together shown. Arrows indicate CD68 positive cells. Scale bar = 50 μm.
Fig. 3
Fig. 3
MiR-126 inhibited pro-inflammatory cytokine expression and promoted anti-inflammatory cytokine expression in M1 macrophages (A) The expression levels of various inflammatory cytokine genes of M0 macrophages and M1 macrophages. (B) Western blots showing IL-1α, IL-4, IL-6, IL-10, TNFα, and β-actin of M0 macrophages and M1 macrophages. (C) Detection of secreted IL-1α, IL-4, and IL-10 in M0 and M1 macrophages by ELISA. (D) qPCR analysis of miR-126 gene expression in M0 macrophages and M1 macrophages. (E) qPCR analysis to confirm the efficiency of miR-126 transfection. (F) qPCR analysis of inflammatory cytokine levels in M1 macrophages overexpressing miR-126 or control sequence. (G) Western blots showing the inflammatory cytokine protein levels of M1 macrophages overexpressing miR-126 or control sequence. (H) Detection of secreted IL-1α, IL-4, and IL-10 protein in M1 macrophages overexpressing miR-126 or control sequence by ELISA. Data in the bar diagrams are represented as mean ± SD. *P < 0.05, **P < 0.01, ***P < 0.001, ****P < 0.0001.
Fig. 4
Fig. 4
Construction of the engineered CXCR4-miR126-Exosomes (A) qPCR analysis of the efficiency of 293T/17 cells overexpressing CXCR4. ****P < 0.0001. (B) Western blots showing CXCR4 and β-actin of 293T/17 cells overexpressing CXCR4 and their controls. (C) Western blots showing CXCR4 and exosome markers (TSG101, HSP70, CD9, CD63, and CD81) of CXCR4-Exo and its controls compared with their conditioned media. Representative transmission electron micrographs (TEM) displaying the morphology of (D) CXCR4-Exo and Crtl-Exo, and (J) CXCR4-miR126-Exo and CXCR4-Ctrl-Exo. Scale bar = 200 nm. Particle size distribution analysis of (E) CXCR4-Exo and Crtl-Exo, and (K) CXCR4-miR126-Exo and CXCR4-Ctrl-Exo. Nano-flow cytometry analysis of CXCR4 expression on the membrane of (F) CXCR4-Exo and Crtl-Exo, and (L) CXCR4-miR126-Exo and CXCR4-Ctrl-Exo. (G) Representative IF images of exosome internalization from M1 macrophages co-cultured with CXCR4-Exo and Crtl-Exo. Nuclei were stained with Hoechst. Scale bar = 50 μm. (H) qPCR analysis of the efficiency of transfecting miR-126 into CXCR4-293T/17 cells. ***P < 0.001. (I) qPCR analysis of miR-126 gene expression in CXCR4-miR126-Exo and CXCR4-Ctrl-Exo. *P < 0.05. Data in the bar diagrams are represented as mean ± SD.
Fig. 5
Fig. 5
CXCR4-miR126-Exo displayed an anti-inflammatory effect on M1 macrophages (A) Representative immunofluorescence images of the absorption of miR-126 by M1 macrophages. MiR-126 was labeled with Cy3 fluorescence, with both Ctrl-exo and CXCR4-exo as control groups. Nuclei were stained with Hoechst. Scale bar = 50 μm. (B) The effect of exosomes on M1 macrophage inflammatory cytokine gene expression levels by qPCR. Cells were treated with exosomes for 48 h. (C) The effect of exosomes on M1 macrophage inflammatory cytokine protein levels detected by western blots, and (D) the relative intensity of the western blot signals. Cells were treated with exosomes for 72 h. (E) Detection of secreted IL-1α, IL-4, and IL-10 proteins of the exosome-treated M1 macrophages by ELISA. *P < 0.05, **P < 0.01, ***P < 0.001, ****P < 0.0001. (F) Representative western blots showing the p38 MAPK signal pathway proteins in the M1 macrophages of each group. Data in the bar diagrams are represented as mean ± SD.
Fig. 6
Fig. 6
CXCR4-miR126-Exo attenuated the progression of inflammation and promoted bone repair in a rat periodontitis model (A) A flow diagram showing the experimental procedure for detection of biofilm and periodontal injection of exosomes in periodontitis rats. (B) Representative images of a 3D reconstruction of the maxillary second molar and alveolar bone of the Blank Ctrl group, the Ctrl-Exo group, the miR126-Exo group and the CXCR4-miR126-Exo group. Scale bar = 1 mm. (C) Statistical analysis of the distance from the cementoenamel junction (CEJ) to the alveolar bone crest (ABC) in each group. (D) The expression of various inflammatory cytokines in the gingiva of the rats in each group. Representative images of (E) H&E and (F) TRAP staining of the periodontium in each group. Scale bar = 200 μm. AB: alveolar bone; FT: fibrous tissues; MT: molar tissues; Arrows point to the positive area. Representative immunohistochemical staining images of (G) CD68 and (H) CD206 in each group. Scale bar = 200 μm. (I) Statistical analysis of the number of osteoclasts in each group as determined by TRAP staining. Statistical analysis of the IHC staining of periodontal (J) CD68 + cells and (K) CD206 + cells in each group. (L) Statistical analysis of the ratio of CD206 + cells/CD68 + cells from the IHC staining. Data in the bar diagrams are represented as mean ± SD. *P < 0.05, **P < 0.01, ***P < 0.001, ****P < 0.0001.

References

    1. Arciola CR, Campoccia D, Montanaro L. Implant infections: adhesion, biofilm formation and immune evasion. Nat Rev Microbiol. 2018;16:397–409. doi: 10.1038/s41579-018-0019-y. - DOI - PubMed
    1. Del Pozo JL. Biofilm-related disease. Expert Rev Anti Infect Ther. 2018;16:51–65. doi: 10.1080/14787210.2018.1417036. - DOI - PubMed
    1. Watters C, Fleming D, Bishop D, Rumbaugh KP. Host responses to Biofilm. Prog Mol Biol Transl Sci. 2016;142:193–239. doi: 10.1016/bs.pmbts.2016.05.007. - DOI - PubMed
    1. Yamada KJ, Kielian T. Biofilm-Leukocyte Cross-Talk: impact on Immune polarization and immunometabolism. J Innate Immun. 2019;11:280–8. doi: 10.1159/000492680. - DOI - PMC - PubMed
    1. Akcalı A, Lang NP. Dental calculus: the calcified biofilm and its role in disease development. Periodontol 2000. 2018;76:109–15. - PubMed

LinkOut - more resources