. 2023 Mar 29;24(1):62.
doi: 10.1186/s13059-023-02904-1.

The shaky foundations of simulating single-cell RNA sequencing data

Affiliations

The shaky foundations of simulating single-cell RNA sequencing data

Helena L Crowell et al. Genome Biol. .

Erratum in

Abstract

Background: With the emergence of hundreds of single-cell RNA-sequencing (scRNA-seq) datasets, the number of computational tools to analyze aspects of the generated data has grown rapidly. As a result, there is a recurring need to demonstrate whether newly developed methods are truly performant-on their own as well as in comparison to existing tools. Benchmark studies aim to consolidate the space of available methods for a given task and often use simulated data that provide a ground truth for evaluations, thus demanding a high quality standard results credible and transferable to real data.

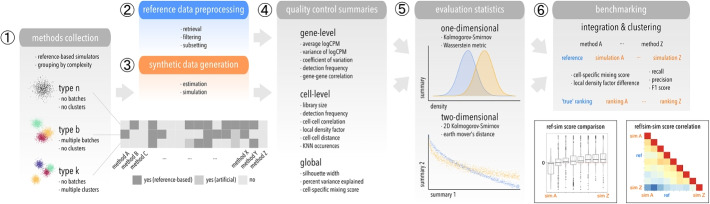
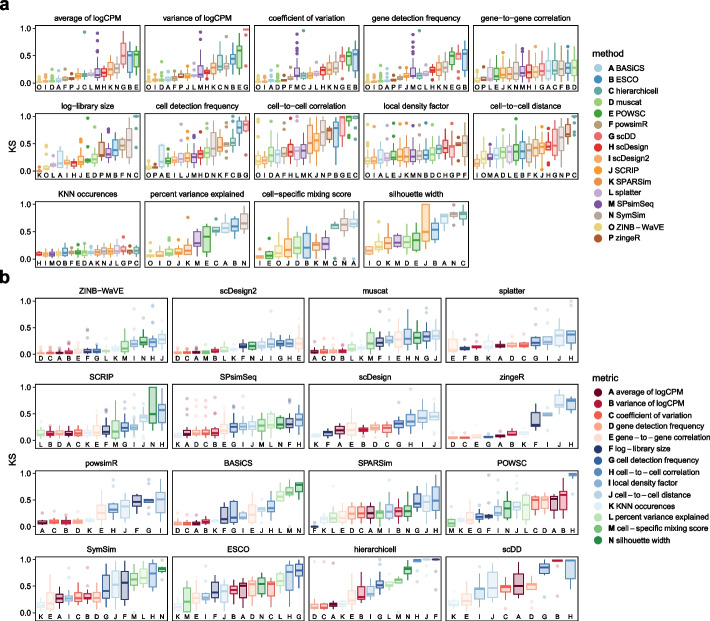
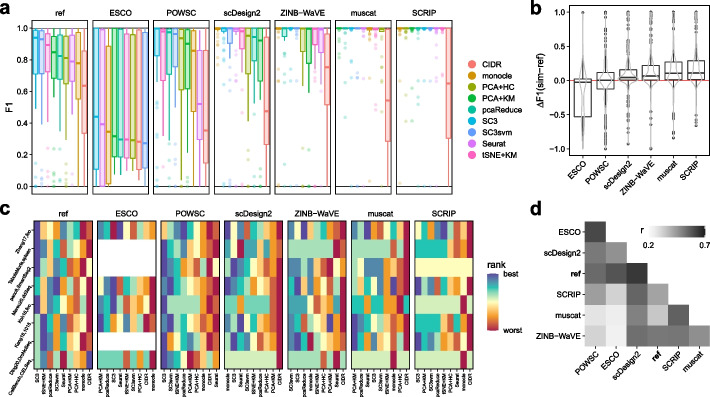
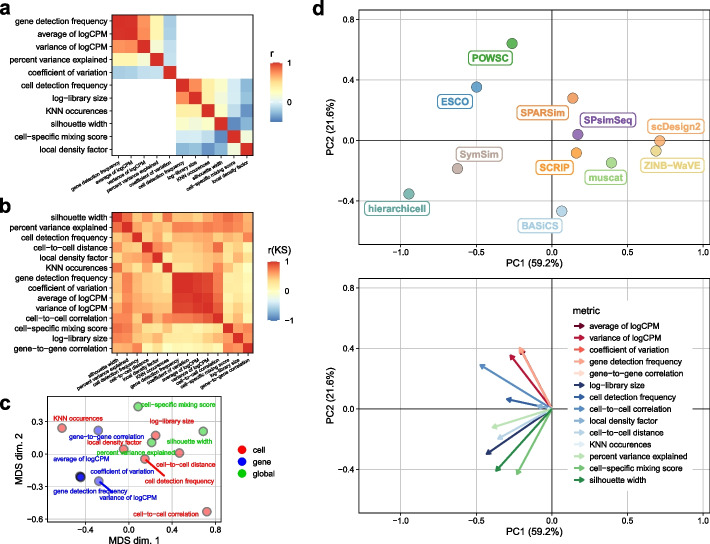
Results: Here, we evaluated methods for synthetic scRNA-seq data generation in their ability to mimic experimental data. Besides comparing gene- and cell-level quality control summaries in both one- and two-dimensional settings, we further quantified these at the batch- and cluster-level. Secondly, we investigate the effect of simulators on clustering and batch correction method comparisons, and, thirdly, which and to what extent quality control summaries can capture reference-simulation similarity.

Conclusions: Our results suggest that most simulators are unable to accommodate complex designs without introducing artificial effects, they yield over-optimistic performance of integration and potentially unreliable ranking of clustering methods, and it is generally unknown which summaries are important to ensure effective simulation-based method comparisons.

Keywords: Benchmarking; Simulation; Single-cell RNA-seq.


Conflict of interest statement

The authors declare that they have no competing interests.

Figures

Fig. 1
Fig. 1
Schematic of the computational workflow used to benchmark scRNA-seq simulators. (1) Methods are grouped according to which level of complexity they can accommodate: type n (“singular”), b (batches), k (clusters). (2) Raw datasets are retrieved reproducibly from a public source, filtered, and subsetted into various datasets that serve as reference for (3) parameter estimation and simulation. (4) Various gene-, cell-level, and global summaries are computed from reference and simulated data, and (5) compared in a one- and two-dimensional setting using two statistics each. (6) Integration and clustering methods are applied to type b and k references and simulations, respectively, and relative performances compared between reference-simulation and simulation-simulation pairs
Fig. 2
Fig. 2
Kolmogorov-Smirnov (KS) test statistics comparing reference and simulated data across methods and summaries. Included are datasets and methods of all types; statistics are from global comparisons for type n, and otherwise averaged across cluster-/batch-level results. a Data are colored by method and stratified by summary. For each summary (panel), methods (x-axis) are ordered according to their average. b Data are colored by summary and stratified by method. For each method (panel), metrics (x-axis) are ordered according to their average from best (small) to worst (large KS statistic). Panels (methods) are ordered by increasing average across all summaries
Fig. 3
Fig. 3
Average performance in one- (upper row) and two-dimensional evaluations (bottom row) for (a, d) type n, (b, e) type b, and (c, f) type k simulations. For each type, methods (x-axis) are ordered according to their average performance across summaries in one-dimensional comparisons. Except for type n, batch- and cluster-level results are averaged across batches and clusters, respectively. Boxes highlight gene-level (red), cell-level (blue), and global summaries (green)
Fig. 4
Fig. 4
Comparison of clustering results across (experimental) reference and (synthetic) simulated data. a Boxplot of F1 scores across all type k references, simulation and clustering methods. b Boxplot of difference (Δ) in F1 scores obtained from reference and simulated data. c Heatmap of clustering method (columns) rankings across datasets (rows), stratified by simulator (panels). d Heatmap of Spearman’s rank correlation (ρ) between F1 scores across datasets and clustering methods
Fig. 5
Fig. 5
Comparison of quality control summaries and KS statistics across datasets and methods. Spearman rank correlations (r) of a gene- and cell-level summaries across reference datasets, and b KS statistics across methods and datasets. c Multi-dimensional scaling (MDS) plot and d principal component (PC) analysis of KS statistics across all and type b/k methods, respectively, averaged across datasets

Comment in

References

    1. Tang F, Barbacioru C, Wang Y, Nordman E, Lee C, Xu N, et al. mRNA-Seq whole-transcriptome analysis of a single cell. Nat Methods. 2009;6(5):377–382. doi: 10.1038/nmeth.1315. - DOI - PubMed
    1. Svensson V, da Veiga Beltrame E, Pachter L. A curated database reveals trends in single-cell transcriptomics. Database. 2020;2020:baaa073. - PMC - PubMed
    1. Zappia L, Phipson B, Oshlack A. Exploring the single-cell RNA-seq analysis landscape with the scRNA-tools database. PLoS Comput Biol. 2018;14(6):e1006245. doi: 10.1371/journal.pcbi.1006245. - DOI - PMC - PubMed
    1. Zappia L, Theis FJ. Over 1000 tools reveal trends in the single-cell RNA-seq analysis landscape. Genome Biol. 2021;22(1):301. doi: 10.1186/s13059-021-02519-4. - DOI - PMC - PubMed
    1. Mangul S, Martin LS, Hill BL, Lam AKM, Distler MG, Zelikovsky A, et al. Systematic benchmarking of omics computational tools. Nat Commun. 2019;10(1):1393. doi: 10.1038/s41467-019-09406-4. - DOI - PMC - PubMed

Publication types

MeSH terms