. 2023 Mar 21;23(6):3297.
doi: 10.3390/s23063297.

Terahertz Cross-Correlation Spectroscopy and Imaging of Large-Area Graphene

Affiliations

Terahertz Cross-Correlation Spectroscopy and Imaging of Large-Area Graphene

Bjørn Hübschmann Mølvig et al. Sensors (Basel). .

Erratum in

Abstract

We demonstrate the use of a novel, integrated THz system to obtain time-domain signals for spectroscopy in the 0.1-1.4 THz range. The system employs THz generation in a photomixing antenna excited by a broadband amplified spontaneous emission (ASE) light source and THz detection with a photoconductive antenna by coherent cross-correlation sampling. We benchmark the performance of our system against a state-of-the-art femtosecond-based THz time-domain spectroscopy system in terms of mapping and imaging of the sheet conductivity of large-area graphene grown by chemical vapor deposition (CVD) and transferred to a PET polymer substrate. We propose to integrate the algorithm for the extraction of the sheet conductivity with the data acquisition, thereby enabling true in-line monitoring capability of the system for integration in graphene production facilities.

Keywords: THz cross-correlation spectroscopy; THz quasi-time-domain spectroscopy; THz time-domain spectroscopy; graphene.


Conflict of interest statement

The authors declare no conflict of interest.

Figures
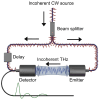
Figure 1
Figure 1
A THz-CCS experiment utilizing PCAs and a temporally incoherent light source for detection and emission. The green trace on the lower black line indicates a typical electrical field profile as a function of time, extracted from the THz-CCS measurements.
Figure 2
Figure 2
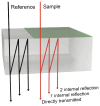
Sketch of different contributions to the detected THz signal from multiple internal reflections. The gray box indicates the substrate and the green sheet the sample, such as graphene.
Figure 3
Figure 3
(a) Illustration of the transmission geometry. The THz light is focused and transmitted through a sample of graphene on a dielectric substrate. (b) C-band ASE output power density.
Figure 4
Figure 4
Traces (left) and spectra (right) of the commercial THz-TDS system (black) and the novel THz-CCS device (red). The TDS trace has been offset. Key metrics are summarized in Table 1.
Figure 5
Figure 5
Knife edge scans of the TDS device (blue) and the CCS device (yellow) with Gaussian fits to determine beam spot sizes. Black dotted lines indicate the spot sizes, which are found to be 1.3 mm for the TDS device and 5.6 mm for the CCS device.
Figure 6
Figure 6
Optical microscopy image (left) and Raman spectra (right) of the PET substrate and the graphene sample on top. The annotated peaks of the G and 2D bands of graphene are consistent with the presence of bi- or trilayer graphene.
Figure 7
Figure 7
Extracted real (top) and imaginary (bottom) parts of the dielectric permittivity of the PET substrate supporting the graphene films. The fitted values are given by a Debye model with parameters ϵ=2.91 , ϵs=3.21 , and τ=65.9 fs.
Figure 8
Figure 8
Examples of real (blue) and imaginary (yellow) parts of the conductivity determined with the CCS system (left) and the TDS system (right) through fitting Equation (10) with a stochastic optimization algorithm.
Figure 9
Figure 9
Measured conductivity of a 9 cm × 9 cm sheet of graphene using THz-TDS (left), THz-CCS (center) and the relative error between them (right). The mean of the errors is 16.3% , and the standard deviation is 10.6% .
Figure 10
Figure 10
σDC measured using TDS against peak-to-peak measurements using CCS along with a linear fit (left) and the spatial relative error, when the peak-to-peak is used to predict σDC (right).
Figure 11
Figure 11
Linear correlation between the peak-to-peak value and the DC conductivity in the range [0.0,12.0] mS for a simulated 1 THz bandwidth pulse for different substrate thicknesses and refractive indices. The red cross denotes a parameter set close to the used experimental settings.

References

    1. Novoselov K.S., Geim A.K., Morozov S.V., Jiang D., Zhang Y., Dubonos S.V., Grigorieva I.V., Firsov A.A. Electric Field Effect in Atomically Thin Carbon Films. Science. 2004;306:666–669. doi: 10.1126/science.1102896. - DOI - PubMed
    1. Castro Neto A.H., Guinea F., Peres N.M.R., Novoselov K.S., Geim A.K. The electronic properties of graphene. Rev. Mod. Phys. 2009;81:109–162. doi: 10.1103/RevModPhys.81.109. - DOI
    1. Das Sarma S., Adam S., Hwang E.H., Rossi E. Electronic transport in two-dimensional graphene. Rev. Mod. Phys. 2011;83:407–470. doi: 10.1103/RevModPhys.83.407. - DOI
    1. Avouris P., Dimitrakopoulos C. Graphene: Synthesis and applications. Mater. Today. 2012;15:86–97. doi: 10.1016/S1369-7021(12)70044-5. - DOI
    1. Moreno C., Vilas-Varela M., Kretz B., Garcia-Lekue A., Costache M.V., Paradinas M., Panighel M., Ceballos G., Valenzuela S.O., Peña D., et al. Bottom-up synthesis of multifunctional nanoporous graphene. Science. 2018;360:199–203. doi: 10.1126/science.aar2009. - DOI - PubMed

LinkOut - more resources