. 2023 Mar 21;23(6):3309.
doi: 10.3390/s23063309.

Quantifying States and Transitions of Emerging Postural Control for Children Not Yet Able to Sit Independently

Affiliations

Quantifying States and Transitions of Emerging Postural Control for Children Not Yet Able to Sit Independently

Patricia Mellodge et al. Sensors (Basel). .

Abstract

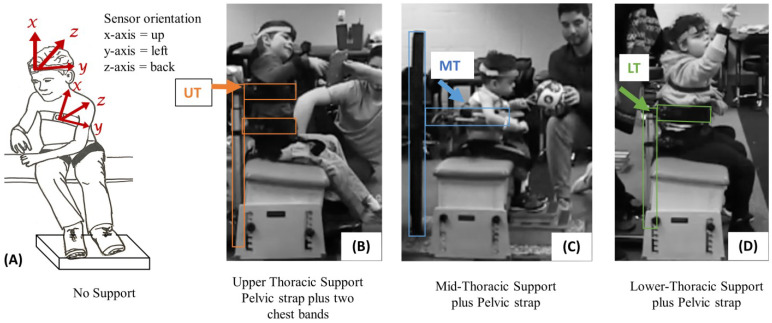
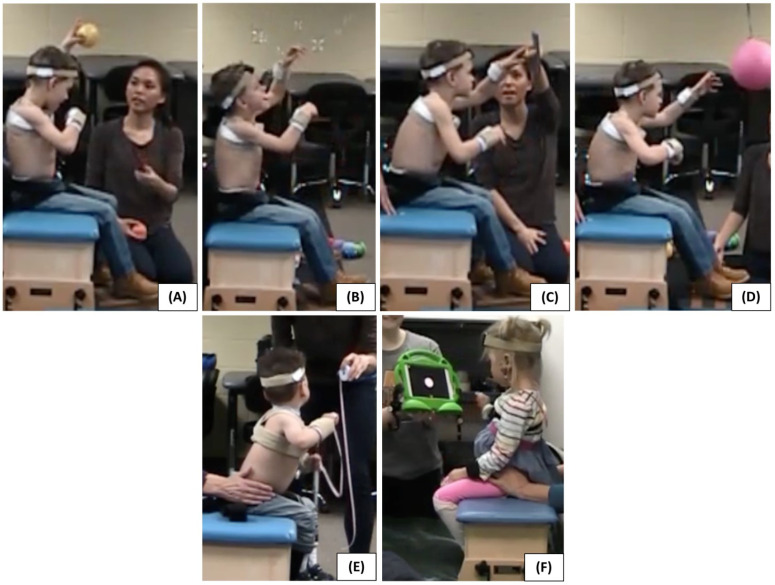
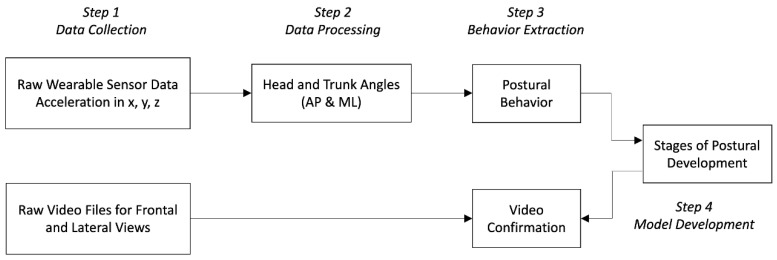
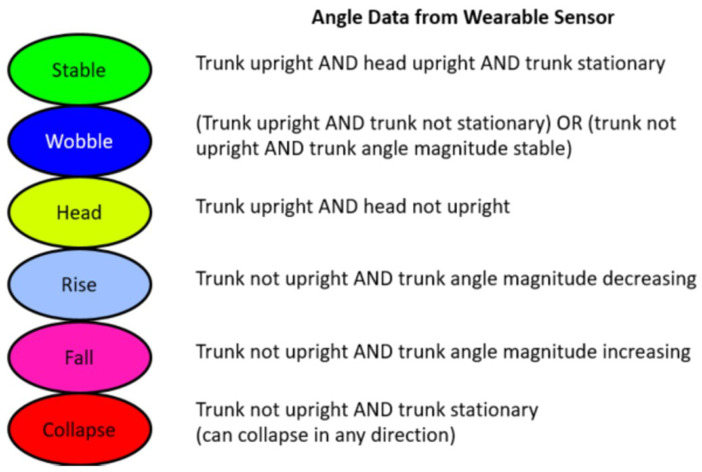
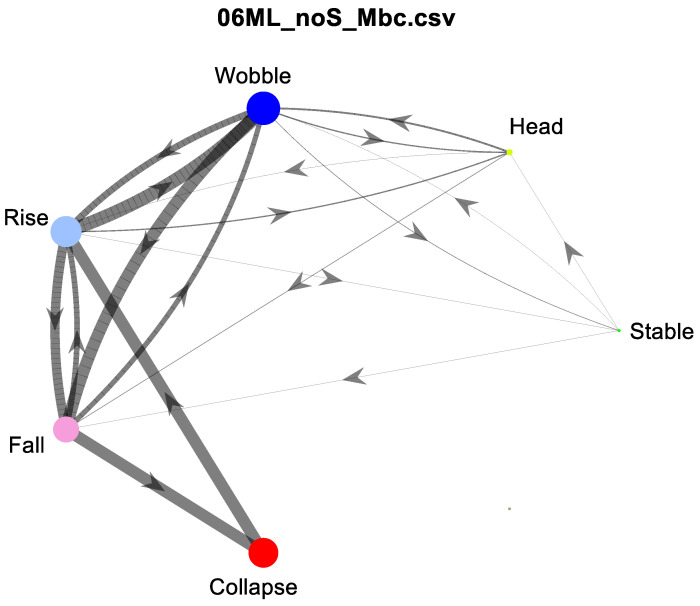
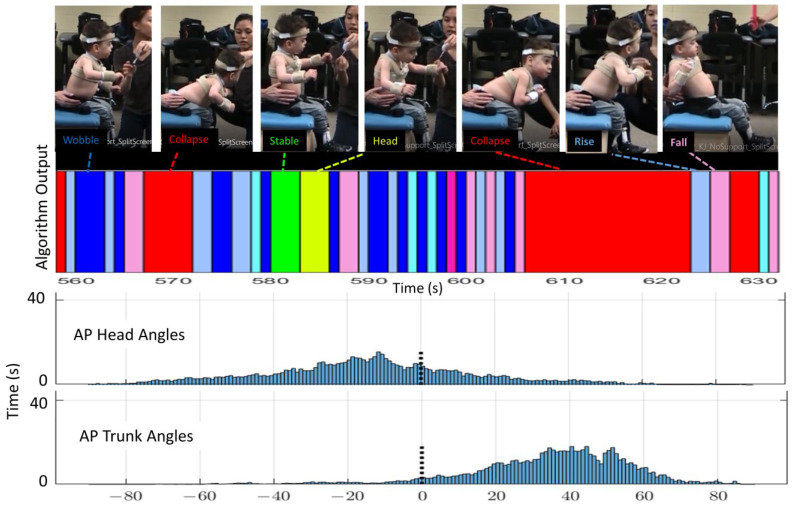
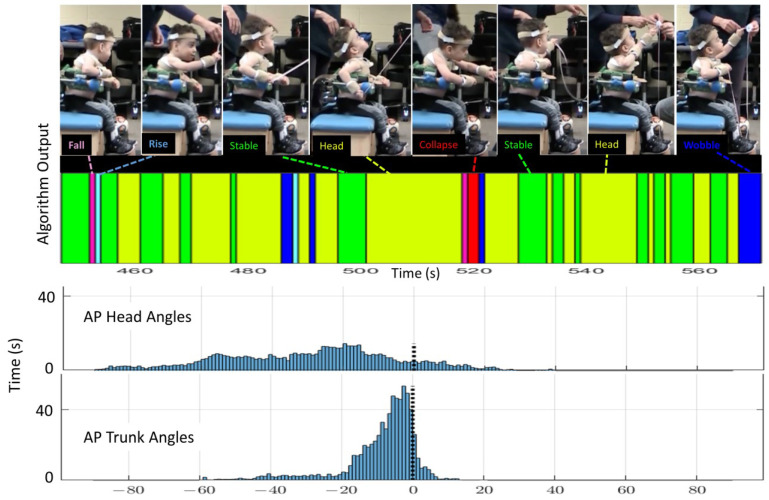
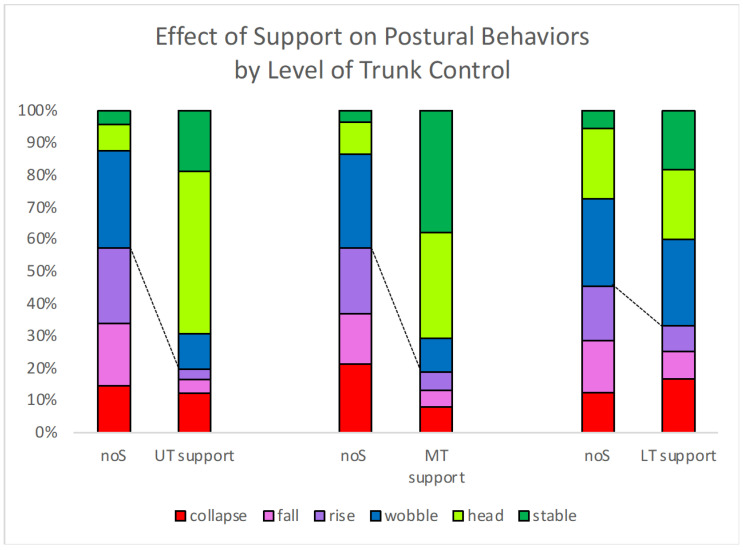
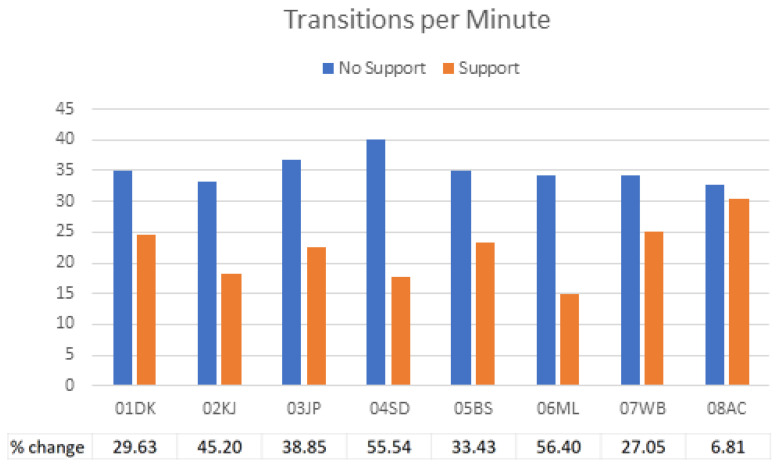
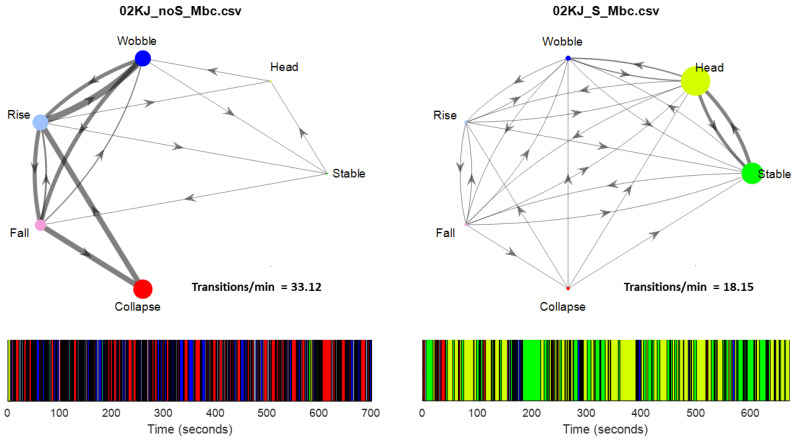
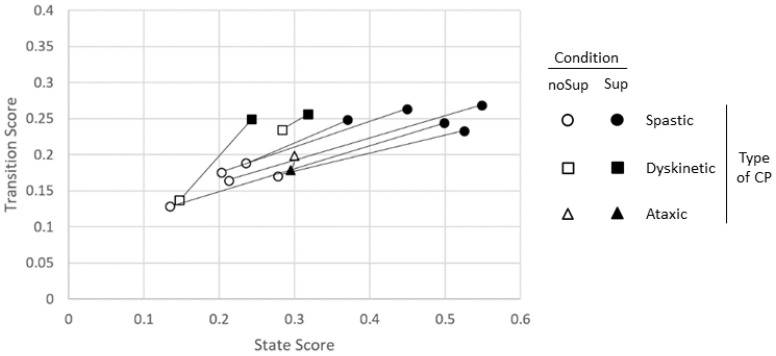
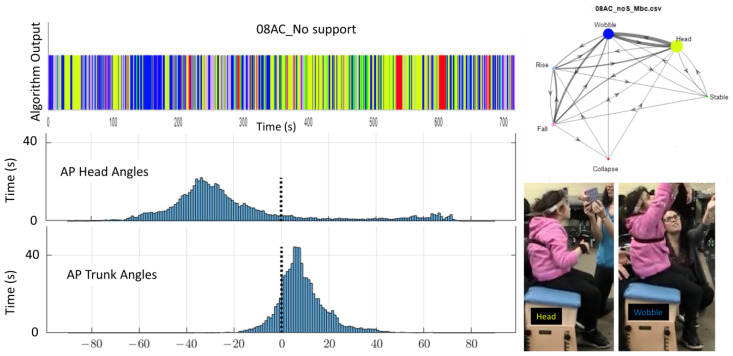
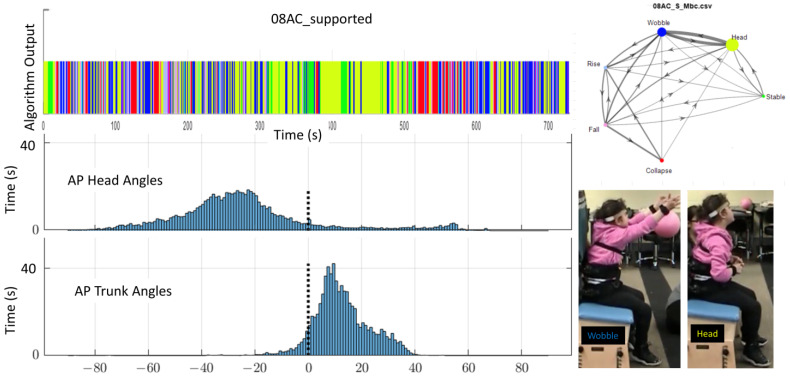
Objective, quantitative postural data is limited for individuals who are non-ambulatory, especially for those who have not yet developed trunk control for sitting. There are no gold standard measurements to monitor the emergence of upright trunk control. Quantification of intermediate levels of postural control is critically needed to improve research and intervention for these individuals. Accelerometers and video were used to record postural alignment and stability for eight children with severe cerebral palsy aged 2 to 13 years, under two conditions, seated on a bench with only pelvic support and with additional thoracic support. This study developed an algorithm to classify vertical alignment and states of upright control; Stable, Wobble, Collapse, Rise and Fall from accelerometer data. Next, a Markov chain model was created to calculate a normative score for postural state and transition for each participant with each level of support. This tool allowed quantification of behaviors previously not captured in adult-based postural sway measures. Histogram and video recordings were used to confirm the output of the algorithm. Together, this tool revealed that providing external support allowed all participants: (1) to increase their time spent in the Stable state, and (2) to reduce the frequency of transitions between states. Furthermore, all participants except one showed improved state and transition scores when given external support.

Keywords: accelerometer; assessment; biomechanical algorithm; cerebral palsy; motor control; postural development model; trunk.


Conflict of interest statement

The authors declare no conflict of interest. The funders had no role in the design of the study; in the collection, analyses, or interpretation of data; in the writing of the manuscript; or in the decision to publish the results.

Figures

Figure 1
Figure 1
Sensor placement, orientation, and support conditions. Sensors were securely strapped to the children’s heads and chests. Pelvic support stability strapping was included for all levels of support (A), and external support was provided at upper (UT), mid (MT), or lower thoracic (LT) regions based on each child’s segmental level of trunk control. The black torso bands are connected to a vertical bar behind the child to provide support at the appropriate level. Trunk supports shown are (B) Meerkat with 2 torso bands at UT and LT, (C) Custom trunk support device with one band at MT, and (D) Meerkat with 1 band at LT.
Figure 2
Figure 2
Activities used to facilitate reaching and upright posture. (A) Hitting a suspended ball, (B) reaching for and popping bubbles, (C) placing and removing pegs from a pegboard, and (D) reaching for and throwing small balls. Alternative activities were used for children who did not find these four activities motivating, e.g., (E) reaching for audiovisual toys and (F) reaching for and pulling on a retractable tape measure.
Figure 3
Figure 3
Steps used to process accelerometry data into postural development stage.
Figure 4
Figure 4
Descriptions of stages of control including color code.
Figure 5
Figure 5
Model of postural development showing stages (colored circles), amount of time spent in each stage (relative size of circles), transitions between states (lines with arrows), and frequency of transitions coming from each node (line thickness). In this example, the child spent most time in Wobble, Rise and Fall, and Collapse and frequently transitioned from Rise to Wobble, Wobble to Fall, Fall to Collapse, and Collapse to Rise.
Figure 6
Figure 6
Example of algorithm output (colored bar, 70 s duration), AP histograms (bottom, full 12-min trial), and AP images from video for one child (02KJ) during the no support condition. The histogram is qualitatively most consistent with Wobble and Rise/Fall behaviors. The child’s head is more vertically aligned while his trunk is consistently leaning forward.
Figure 7
Figure 7
Example of algorithm output (colored bar), AP histograms (bottom) and images from video demonstrating AP alignment matched to algorithm output for subject 02KJ with mid-thoracic support. The histogram is qualitatively consistent with stable trunk and head not aligned some backward collapse is noted. For this child, the support provided a more upright and stable trunk however he tended to tip his chin upward and tilt his head back slightly.
Figure 8
Figure 8
Average percent of time spent in different postural states for children who were supported at different levels of support. Dashed lines show the point of separation between poor postural behaviors (Collapse, Rise, Fall) and postural behaviors that exhibit postural response mechanisms (Wobble, Stable, Head). UT = upper thoracic, MT = mid-thoracic, and LT = lower thoracic. noS = no support.
Figure 9
Figure 9
A comparison of the number of transitions per minute for each child in the unsupported and supported conditions. Each child reduced the number of transitions per minute when support was added.
Figure 10
Figure 10
Example of the Markov model (top) and its associated behavior code time series (bottom). Left is the no support condition, and right is the support condition for the same subject. Stages (colored circles), amount of time spent in each stage (relative size of circles), transitions between states (lines with arrows), and frequency of transitions coming from each node (line thickness) are indicated in the Markov model. The transition and state scores for this child in the unsupported condition were 0.128 and 0.135, respectively. In the supported condition, the transition and state scores were 0.244 and 0.499 respectively.
Figure 11
Figure 11
Comparison of state and transition scores for all subjects. Each subject’s no support and support score markers are connected by a line. Data points in the lower left portion of the grid indicate mostly poor posture (time spent and transitions toward Collapse or Rise and Fall), while those in the upper right quadrant indicate improved posture (time spent and transitions moving towards Wobble, Stable, or Head).
Figure 12
Figure 12
Example of algorithm output (colored bar) for the full 12-min, and AP histograms (bottom) and two images (right) showing AP alignment for 08AC during the no support condition. The histogram is qualitatively consistent with Wobble and Head. Markov model (upper right) indicates stages (colored circles), amount of time spent in each stage (relative size of circles), transitions between states (lines with arrows), and frequency of transitions coming from each node (line thickness).
Figure 13
Figure 13
Example of algorithm output (colored bar) for the full 12 min, and AP histograms (bottom) and two images (right) showing AP alignment for 08AC during the LT support condition. The histogram is qualitatively consistent with Wobble and Head. Markov model (upper right) indicates stages (colored circles), amount of time spent in each stage (relative size of circles), transitions between states (lines with arrows), and frequency of transitions coming from each node (line thickness).

Similar articles

References

    1. Rosenbaum P.L., Walter S.D., Hanna S.E., Palisano R.J., Russell D.J., Raina P., Wood E., Bartlett D.J., Galuppi B.E. Prognosis for Gross Motor Function in Cerebral Palsy: Creation of Motor Development Curves. JAMA J. Am. Med. Assoc. 2003;288:1357–1363. doi: 10.1001/jama.288.11.1357. - DOI - PubMed
    1. Hanna S.E., Rosenbaum P.L., Bartlett D.J., Palisano R.J., Walter S.D., Avery L., Russell D.J. Stability and decline in gross motor function among children and youth with cerebral palsy aged 2 to 21 years. Dev. Med. Child Neurol. 2009;51:295–302. doi: 10.1111/j.1469-8749.2008.03196.x. - DOI - PubMed
    1. Beckung E., Hagberg G., Uldall P., Cans C., Europe F.S.O.C.P.I. Probability of Walking in Children with Cerebral Palsy in Europe. Pediatrics. 2008;121:e187–e192. doi: 10.1542/peds.2007-0068. - DOI - PubMed
    1. Cloake T., Gardner A. The management of scoliosis in children with cerebral palsy: A review. J. Spine Surg. 2016;2:299–309. doi: 10.21037/jss.2016.09.05. - DOI - PMC - PubMed
    1. Soo B., Howard J.J., Boyd R.N., Reid S.M., Lanigan A., Wolfe R., Graham H.K. Hip displacement in cerebral palsy. J. Bone Jt. Surg. 2006;88A:121–129. - PubMed