

An In-Ear PPG-Based Blood Glucose Monitor: A Proof-of-Concept Study
- PMID: 36992029
- PMCID: PMC10057625
- DOI: 10.3390/s23063319
An In-Ear PPG-Based Blood Glucose Monitor: A Proof-of-Concept Study
Abstract
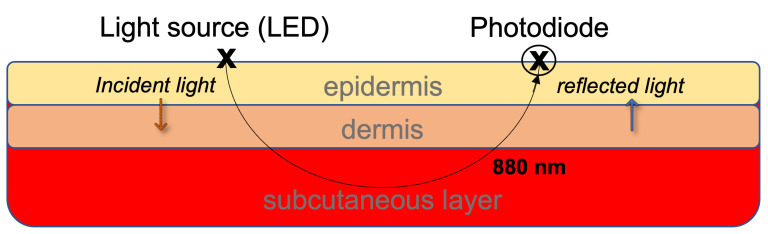
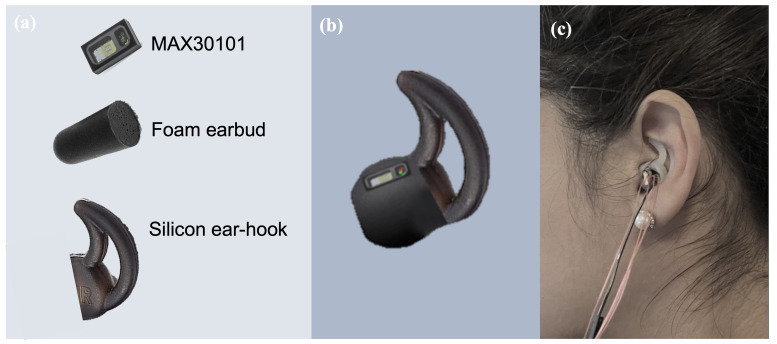
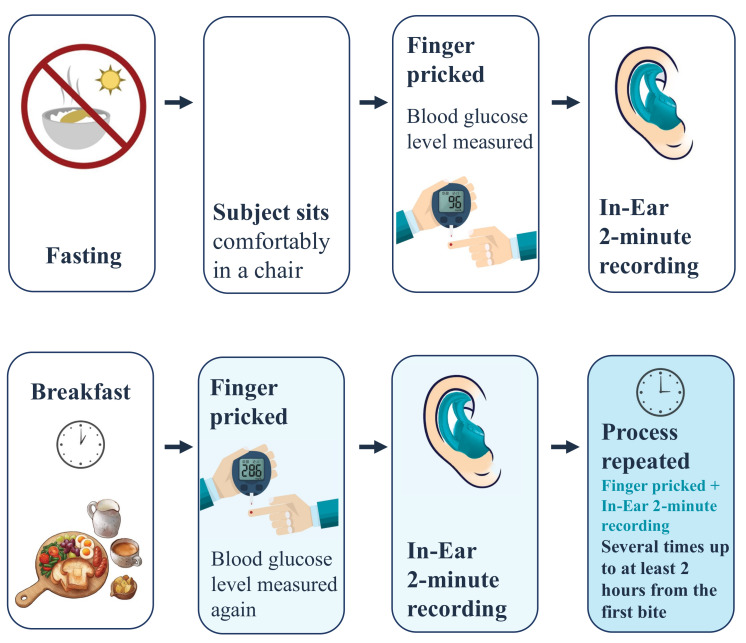
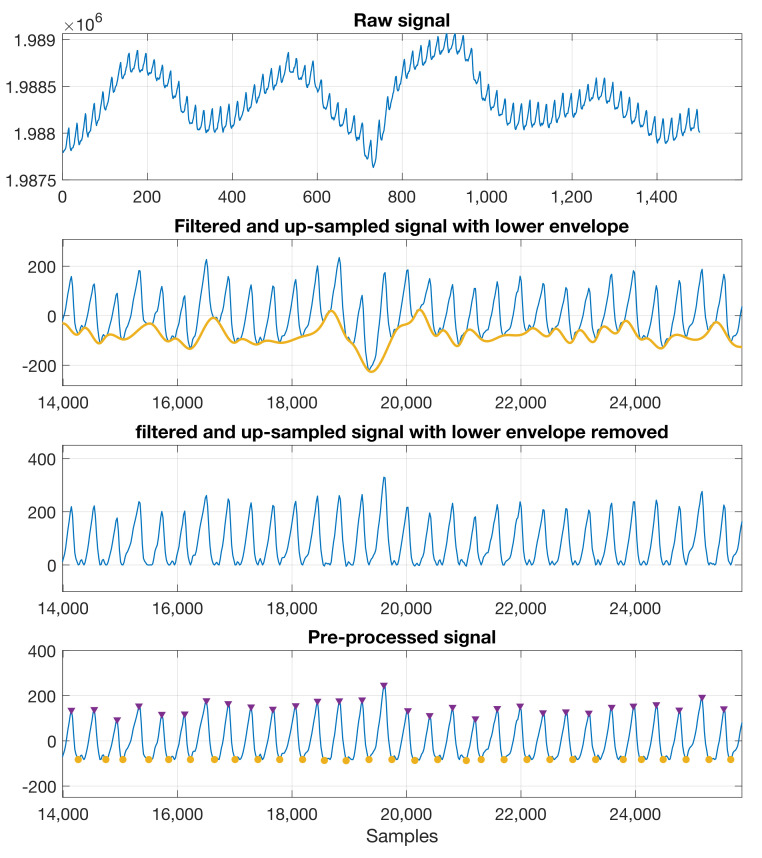
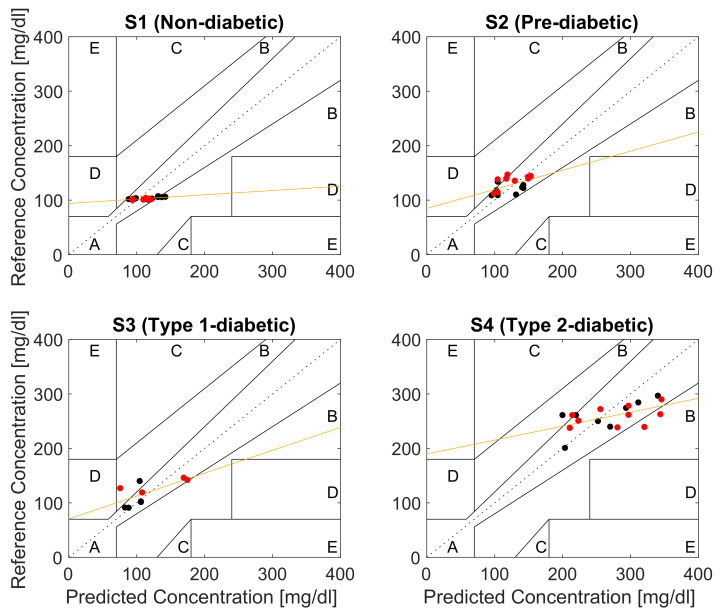
Monitoring diabetes saves lives. To this end, we introduce a novel, unobtrusive, and readily deployable in-ear device for the continuous and non-invasive measurement of blood glucose levels (BGLs). The device is equipped with a low-cost commercially available pulse oximeter whose infrared wavelength (880 nm) is used for the acquisition of photoplethysmography (PPG). For rigor, we considered a full range of diabetic conditions (non-diabetic, pre-diabetic, type I diabetic, and type II diabetic). Recordings spanned nine different days, starting in the morning while fasting, up to a minimum of a two-hour period after eating a carbohydrate-rich breakfast. The BGLs from PPG were estimated using a suite of regression-based machine learning models, which were trained on characteristic features of PPG cycles pertaining to high and low BGLs. The analysis shows that, as desired, an average of 82% of the BGLs estimated from PPG lie in region A of the Clarke error grid (CEG) plot, with 100% of the estimated BGLs in the clinically acceptable CEG regions A and B. These results demonstrate the potential of the ear canal as a site for non-invasive blood glucose monitoring.
Keywords: NIR spectroscopy; blood glucose; continuous monitoring; diabetes; hearables; in-ear PPG; machine learning; non-invasive; photoplethysmography (PPG).
Conflict of interest statement
The authors declare no conflict of interest.
Figures
Similar articles
-
Design of a Wearable Finger PPG-Based Blood Glucose Monitor.Ann Biomed Eng. 2025 Jul 20. doi: 10.1007/s10439-025-03809-9. Online ahead of print. Ann Biomed Eng. 2025. PMID: 40685463
-
Diabetes: Non-Invasive Blood Glucose Monitoring Using Federated Learning with Biosensor Signals.Biosensors (Basel). 2025 Apr 16;15(4):255. doi: 10.3390/bios15040255. Biosensors (Basel). 2025. PMID: 40277568 Free PMC article.
-
In vivo investigation of ear canal pulse oximetry during hypothermia.J Clin Monit Comput. 2018 Feb;32(1):97-107. doi: 10.1007/s10877-017-9975-4. Epub 2017 Jan 27. J Clin Monit Comput. 2018. PMID: 28130679 Free PMC article.
-
Noninvasive Blood Glucose Monitoring Systems Using Near-Infrared Technology-A Review.Sensors (Basel). 2022 Jun 27;22(13):4855. doi: 10.3390/s22134855. Sensors (Basel). 2022. PMID: 35808352 Free PMC article. Review.
-
The Principles of Hearable Photoplethysmography Analysis and Applications in Physiological Monitoring-A Review.Sensors (Basel). 2023 Jul 18;23(14):6484. doi: 10.3390/s23146484. Sensors (Basel). 2023. PMID: 37514778 Free PMC article. Review.
Cited by
-
From Scalp to Ear-EEG: A Generalizable Transfer Learning Model for Automatic Sleep Scoring in Older People.IEEE J Transl Eng Health Med. 2024 Apr 17;12:448-456. doi: 10.1109/JTEHM.2024.3388852. eCollection 2024. IEEE J Transl Eng Health Med. 2024. PMID: 38765887 Free PMC article.
-
Langmuir-Blodgett Films with Immobilized Glucose Oxidase Enzyme Molecules for Acoustic Glucose Sensor Application.Sensors (Basel). 2023 Jun 2;23(11):5290. doi: 10.3390/s23115290. Sensors (Basel). 2023. PMID: 37300021 Free PMC article.
-
Highly Sensitive Perovskite Photoplethysmography Sensor for Blood Glucose Sensing Using Machine Learning Techniques.Adv Sci (Weinh). 2024 Nov;11(43):e2405681. doi: 10.1002/advs.202405681. Epub 2024 Sep 20. Adv Sci (Weinh). 2024. PMID: 39303203 Free PMC article.
-
Clinical evaluation of a polarization-based optical noninvasive glucose sensing system.Sci Rep. 2025 Mar 14;15(1):8877. doi: 10.1038/s41598-025-92515-6. Sci Rep. 2025. PMID: 40087308 Free PMC article.
-
Applications of Artificial Intelligence and Machine Learning in Prediabetes: A Scoping Review.J Diabetes Sci Technol. 2025 Jul 8:19322968251351995. doi: 10.1177/19322968251351995. Online ahead of print. J Diabetes Sci Technol. 2025. PMID: 40626375 Free PMC article. Review.
References
-
- Roglic G. WHO Global report on diabetes: A summary. Int. J. Noncommun. Dis. 2016;1:3–8. doi: 10.4103/2468-8827.184853. - DOI
-
- Ravaut M., Sadeghi H., Leung K.K., Volkovs M., Kornas K., Harish V., Watson T., Lewis G.F., Weisman A., Poutanen T., et al. Predicting adverse outcomes due to diabetes complications with machine learning using administrative health data. NPJ Digit. Med. 2021;4:24. doi: 10.1038/s41746-021-00394-8. - DOI - PMC - PubMed
-
- Sun H., Saeedi P., Karuranga S., Pinkepank M., Ogurtsova K., Duncan B.B., Stein C., Basit A., Chan J.C.N., Mbanya J.C., et al. IDF Diabetes Atlas: Global, regional and country-level diabetes prevalence estimates for 2021 and projections for 2045. Diabetes Res. Clin. Pract. 2021;183:109119. doi: 10.1016/j.diabres.2021.109119. - DOI - PMC - PubMed
MeSH terms
Substances
LinkOut - more resources
Full Text Sources
Medical
Miscellaneous
