

Study of the Effects of Several SARS-CoV-2 Structural Proteins on Antiviral Immunity
- PMID: 36992107
- PMCID: PMC10059745
- DOI: 10.3390/vaccines11030524
Study of the Effects of Several SARS-CoV-2 Structural Proteins on Antiviral Immunity
Abstract
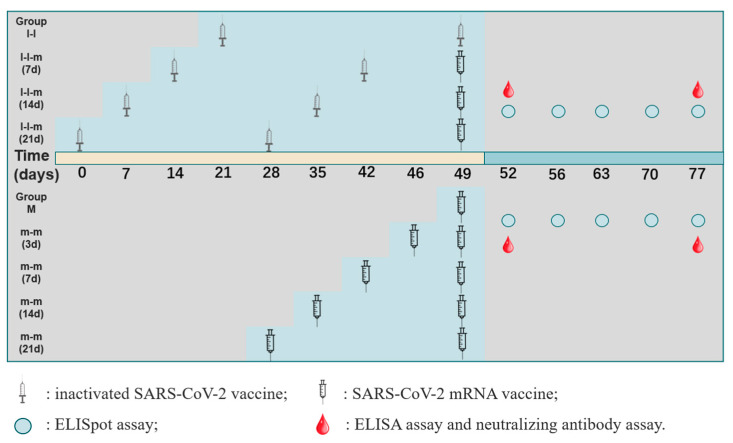
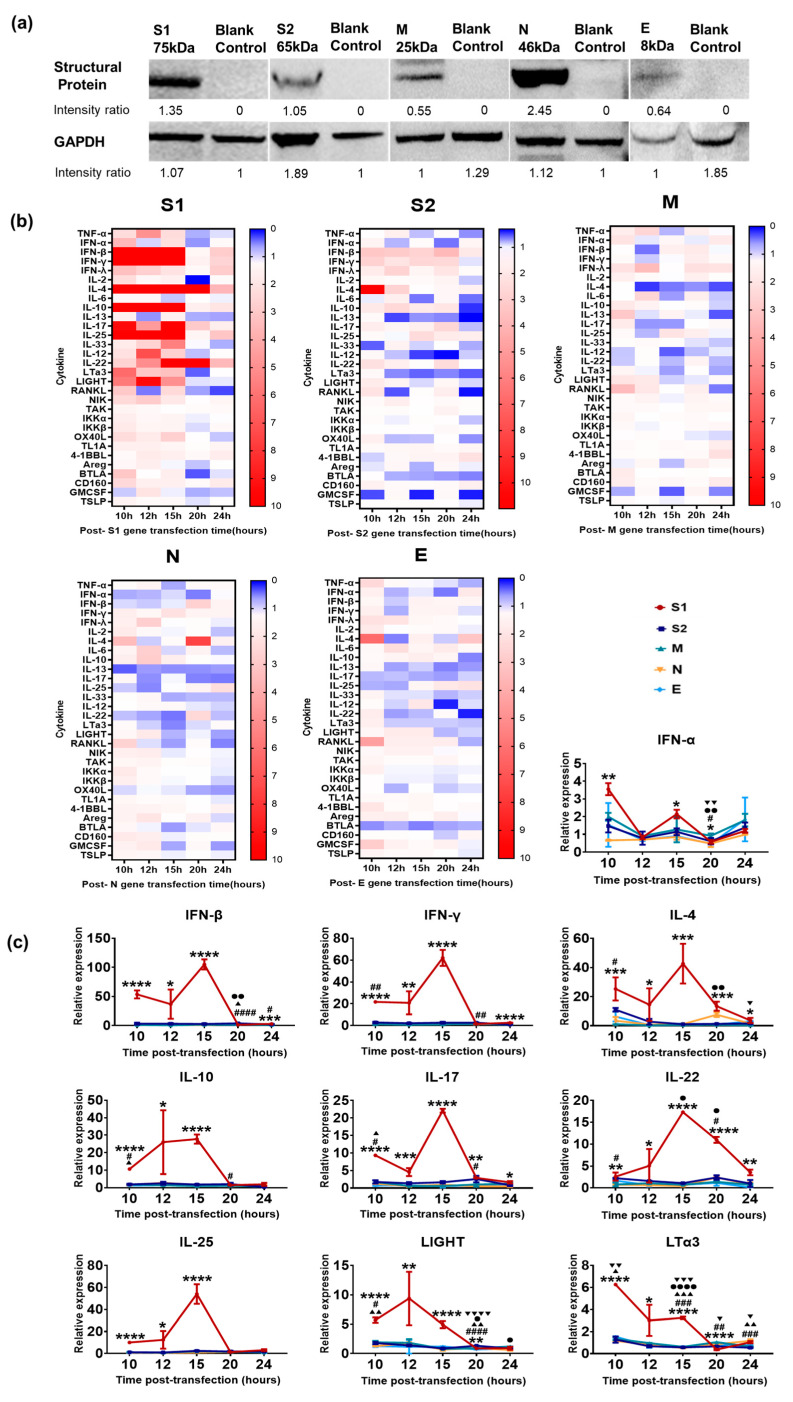
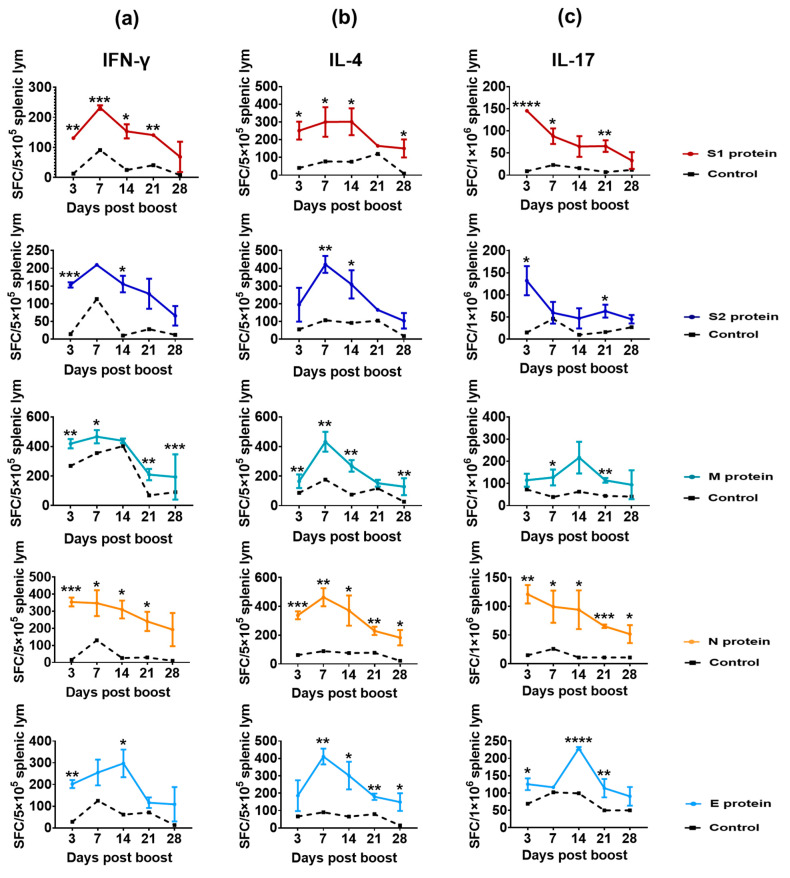
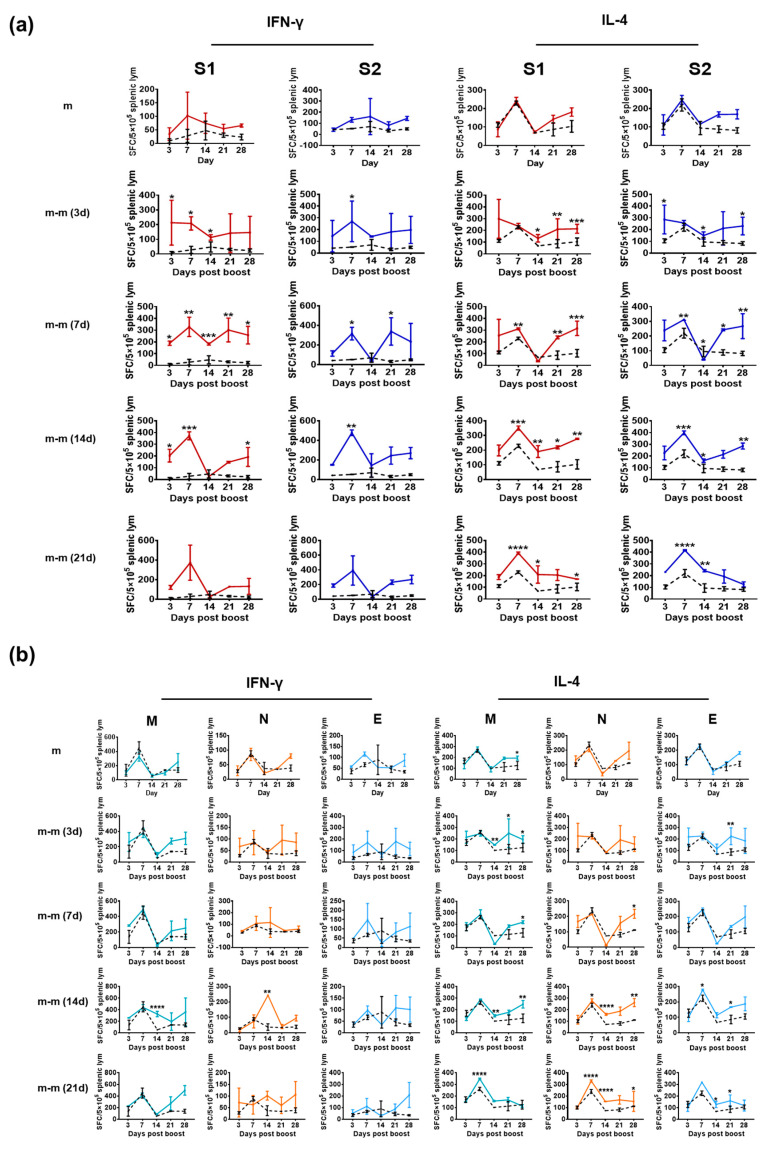
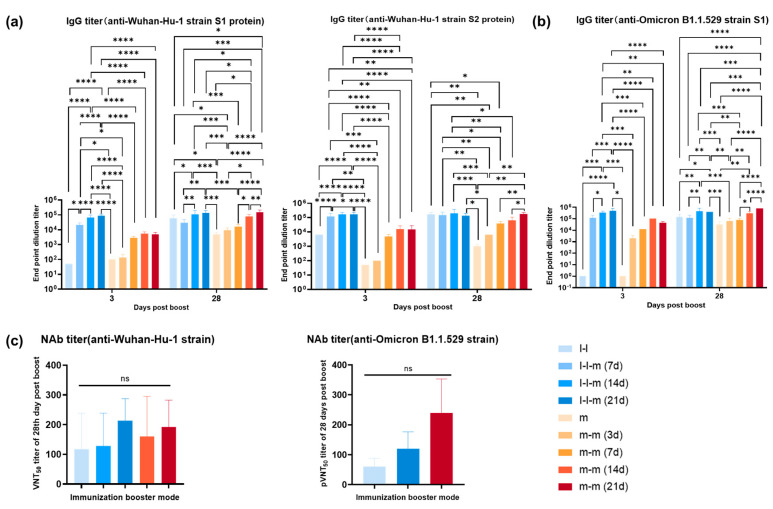
The severe acute respiratory syndrome coronavirus 2 (SARS-CoV-2) Spike (S) protein is a critical viral antigenic protein that enables the production of neutralizing antibodies, while other structural proteins, including the membrane (M), nucleocapsid (N) and envelope (E) proteins, have unclear roles in antiviral immunity. In this study, S1, S2, M, N and E proteins were expressed in 16HBE cells to explore the characteristics of the resultant innate immune response. Furthermore, peripheral blood mononuclear cells (PBMCs) from mice immunized with two doses of inactivated SARS-CoV-2 vaccine or two doses of mRNA vaccine were isolated and stimulated by these five proteins to evaluate the corresponding specific T-cell immune response. In addition, the levels of humoral immunity induced by two-dose inactivated vaccine priming followed by mRNA vaccine boosting, two homologous inactivated vaccine doses and two homologous mRNA vaccine doses in immunized mice were compared. Our results suggested that viral structural proteins can activate the innate immune response and elicit a specific T-cell response in mice immunized with the inactivated vaccine. However, the existence of the specific T-cell response against M, N and E is seemingly insufficient to improve the level of humoral immunity.
Keywords: SARS-CoV-2; humoral immunity; innate immune; specific T-cell response; structural protein.
Conflict of interest statement
All authors declare that they have no known competing financial interests or personal relationships that could have appeared to influence the work reported in this study.
Figures
Similar articles
-
Boosting with Multiple Doses of mRNA Vaccine after Priming with Two Doses of Protein Subunit Vaccine MVC-COV1901 Elicited Robust Humoral and Cellular Immune Responses against Emerging SARS-CoV-2 Variants.Microbiol Spectr. 2022 Oct 26;10(5):e0060922. doi: 10.1128/spectrum.00609-22. Epub 2022 Aug 25. Microbiol Spectr. 2022. PMID: 36005765 Free PMC article.
-
Characterization of SARS-CoV-2-Specific Humoral and Cellular Immune Responses Induced by Inactivated COVID-19 Vaccines in a Real-World Setting.Front Immunol. 2021 Dec 22;12:802858. doi: 10.3389/fimmu.2021.802858. eCollection 2021. Front Immunol. 2021. PMID: 35003131 Free PMC article.
-
Evaluation of post-vaccination immunoglobulin G antibodies and T-cell immune response after inoculation with different types and doses of SARS-CoV-2 vaccines: A retrospective cohort study.Front Med (Lausanne). 2023 Jan 10;9:1092646. doi: 10.3389/fmed.2022.1092646. eCollection 2022. Front Med (Lausanne). 2023. PMID: 36703898 Free PMC article.
-
Severe acute respiratory syndrome vaccine development: experiences of vaccination against avian infectious bronchitis coronavirus.Avian Pathol. 2003 Dec;32(6):567-82. doi: 10.1080/03079450310001621198. Avian Pathol. 2003. PMID: 14676007 Free PMC article. Review.
-
Cross-Protection against MERS-CoV by Prime-Boost Vaccination Using Viral Spike DNA and Protein.J Virol. 2020 Nov 23;94(24):e01176-20. doi: 10.1128/JVI.01176-20. Print 2020 Nov 23. J Virol. 2020. PMID: 32967955 Free PMC article.
Cited by
-
Independent Protection and Influence of the Spike-Specific Antibody Response of SARS-CoV-2 Nucleocapsid Protein (N) in Whole-Virion Vaccines.Vaccines (Basel). 2023 Nov 2;11(11):1681. doi: 10.3390/vaccines11111681. Vaccines (Basel). 2023. PMID: 38006013 Free PMC article.
-
Rapid and Scalable Production of Functional SARS-CoV-2 Virus-like Particles (VLPs) by a Stable HEK293 Cell Pool.Vaccines (Basel). 2024 May 21;12(6):561. doi: 10.3390/vaccines12060561. Vaccines (Basel). 2024. PMID: 38932290 Free PMC article.
-
Sustained spike-specific IgG antibodies following CoronaVac (Sinovac) vaccination in sub-Saharan Africa, but increased breakthrough infections in baseline spike-naive individuals.Front Immunol. 2023 Nov 30;14:1255676. doi: 10.3389/fimmu.2023.1255676. eCollection 2023. Front Immunol. 2023. PMID: 38098482 Free PMC article.
References
-
- Walker P.G.T., Whittaker C., Watson O.J., Baguelin M., Winskill P., Hamlet A., Djafaara B.A., Cucunubá Z., Mesa D.O., Green W., et al. The impact of COVID-19 and strategies for mitigation and suppression in low- and middle-income countries. Science. 2020;369:413–422. doi: 10.1126/science.abc0035. - DOI - PMC - PubMed
-
- Hoffmann M., Kleine-Weber H., Schroeder S., Krüger N., Herrler T., Erichsen S., Schiergens T.S., Herrler G., Wu N.-H., Nitsche A., et al. SARS-CoV-2 Cell Entry Depends on ACE2 and TMPRSS2 and Is Blocked by a Clinically Proven Protease Inhibitor. Cell. 2020;181:271–280.e8. doi: 10.1016/j.cell.2020.02.052. - DOI - PMC - PubMed
Grants and funding
LinkOut - more resources
Full Text Sources
Miscellaneous
