

Identifying Putative Resistance Genes for Barley Yellow Dwarf Virus-PAV in Wheat and Barley
- PMID: 36992425
- PMCID: PMC10053949
- DOI: 10.3390/v15030716
Identifying Putative Resistance Genes for Barley Yellow Dwarf Virus-PAV in Wheat and Barley
Abstract
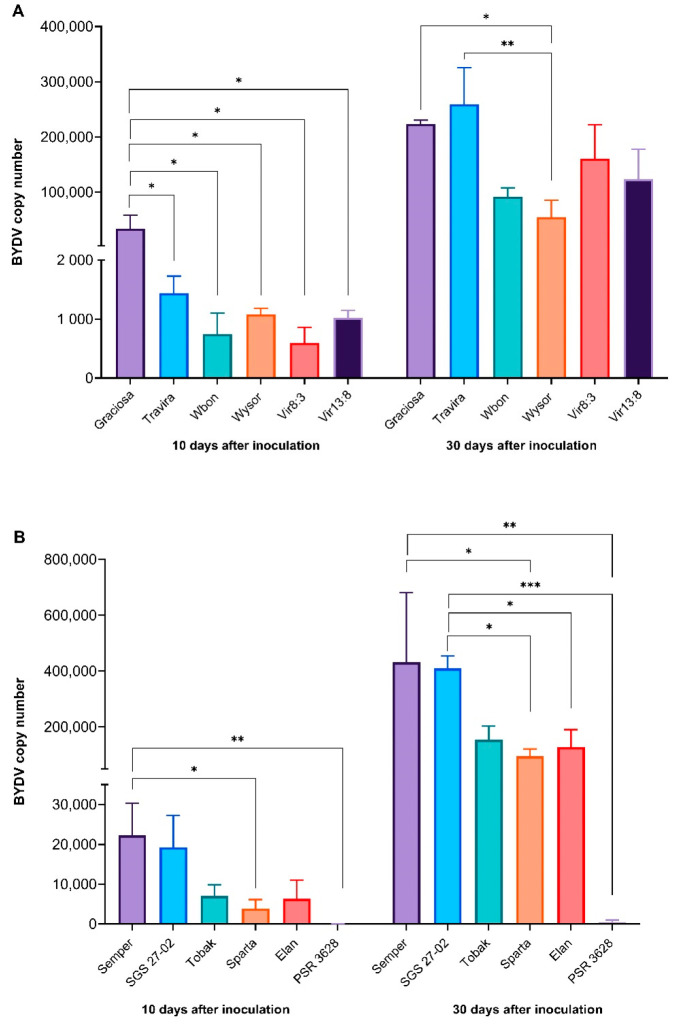
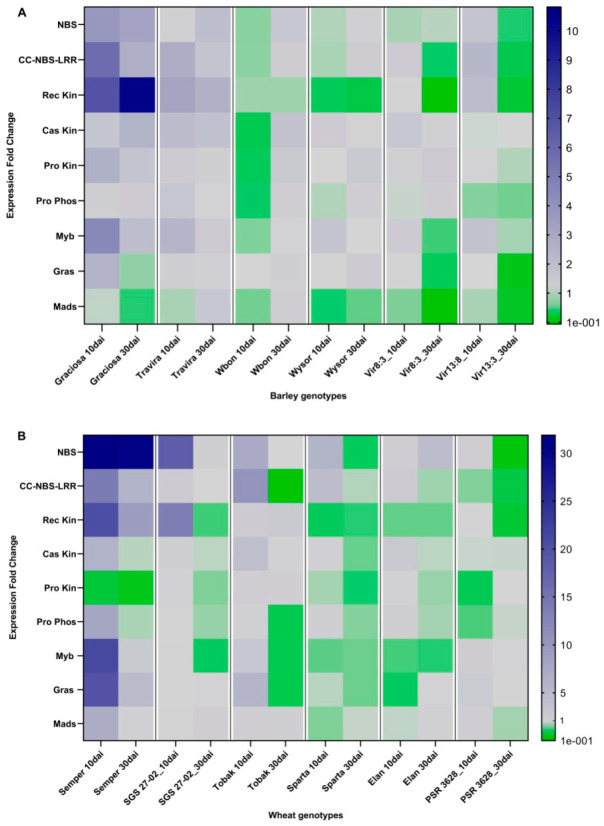
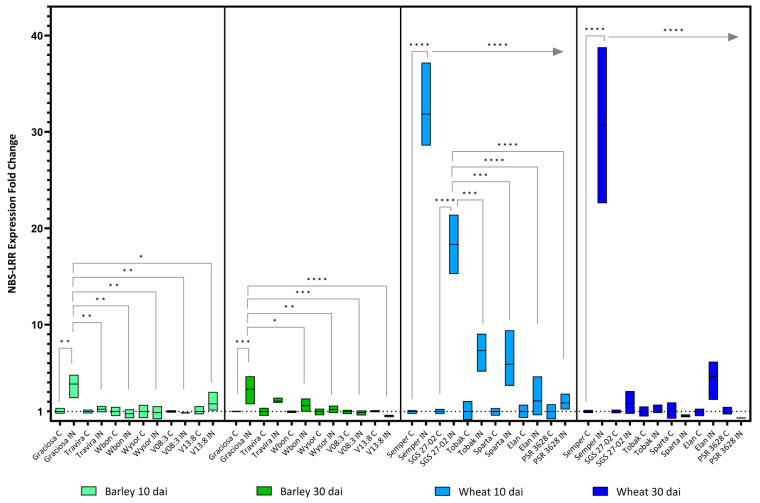
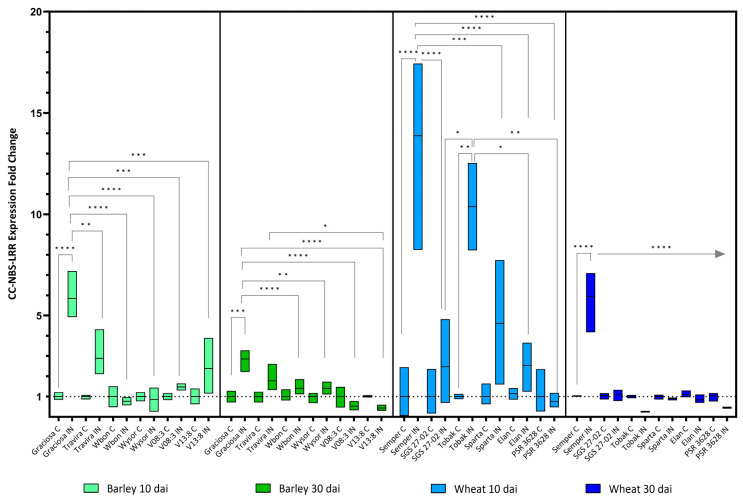
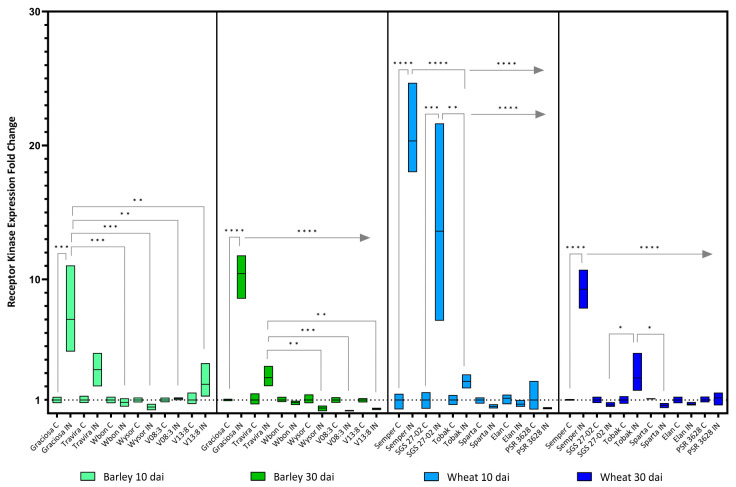
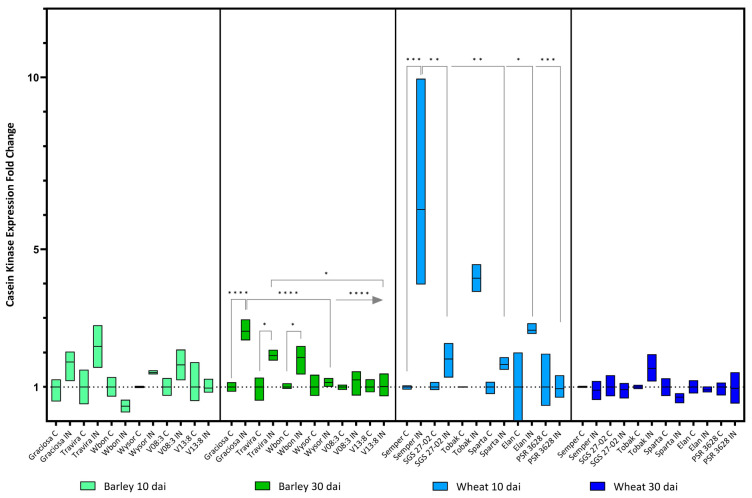
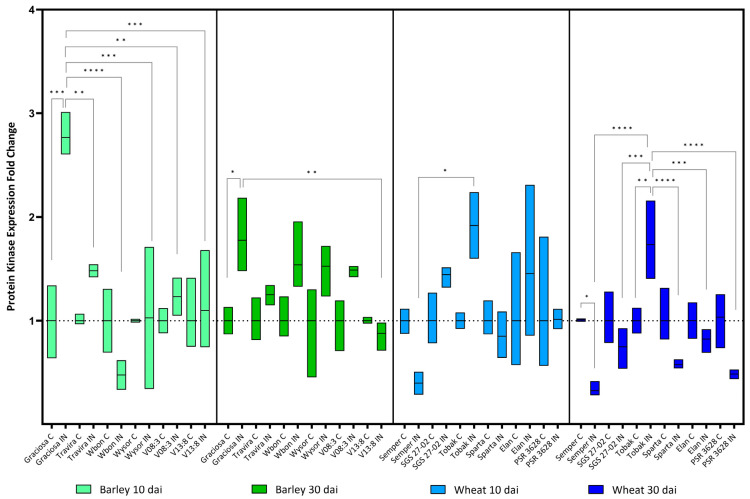
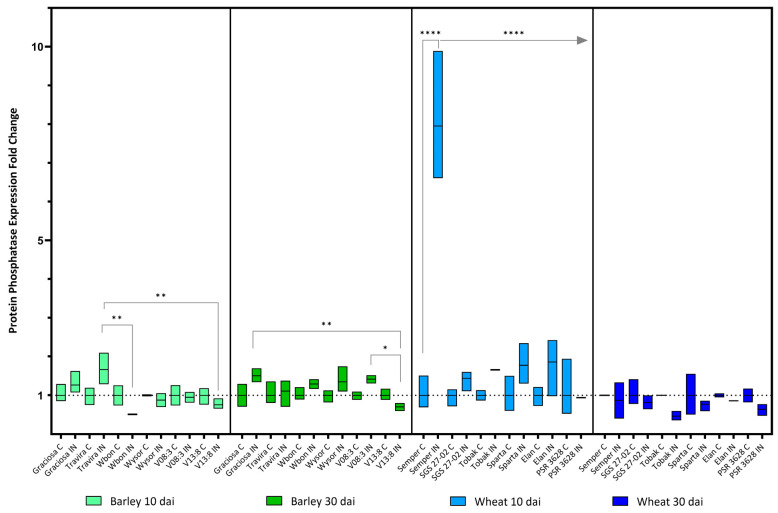
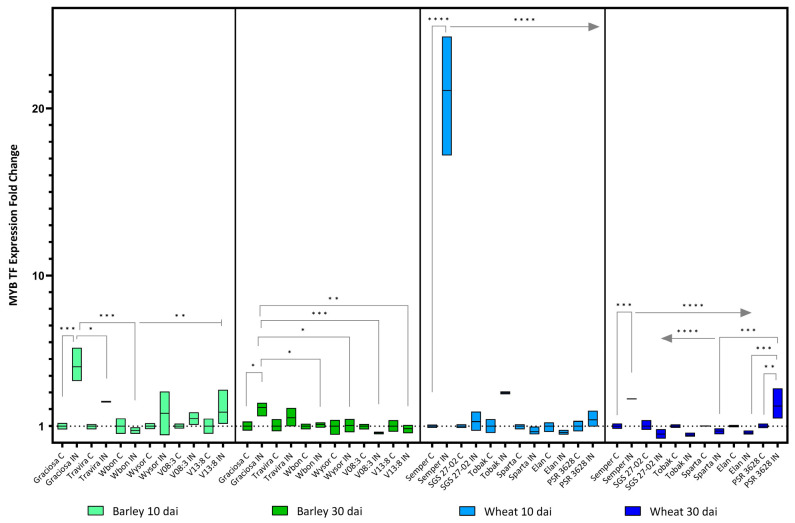
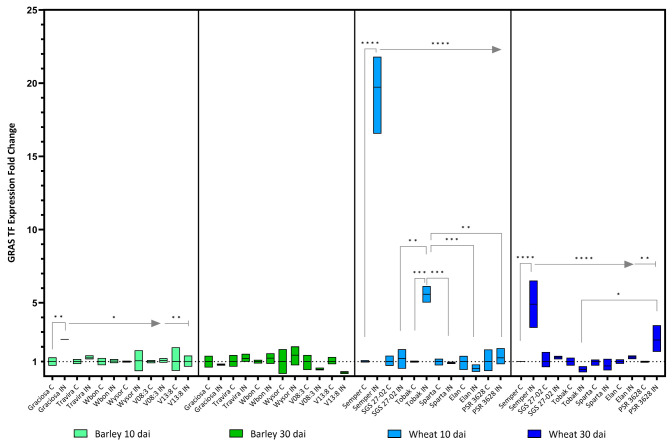
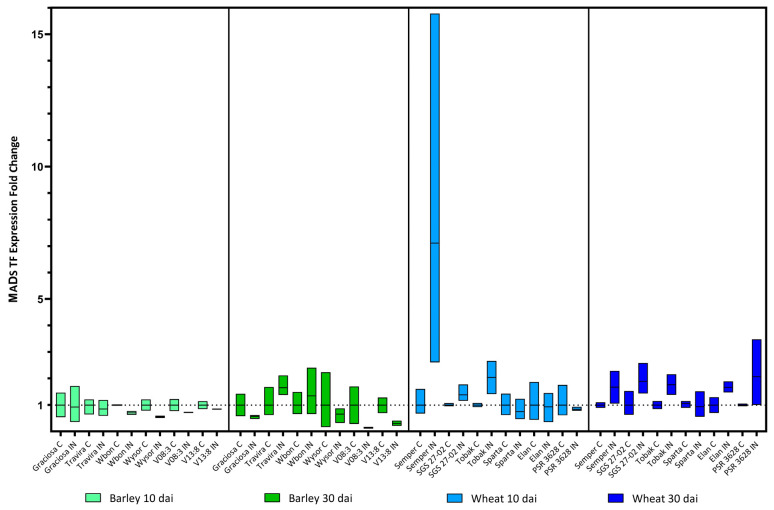
Barley yellow dwarf viruses (BYDVs) are one of the most widespread and economically important plant viruses affecting many cereal crops. Growing resistant varieties remains the most promising approach to reduce the impact of BYDVs. A Recent RNA sequencing analysis has revealed potential genes that respond to BYDV infection in resistant barley genotypes. Together with a comprehensive review of the current knowledge on disease resistance in plants, we selected nine putative barley and wheat genes to investigate their involvement in resistance to BYDV-PAV infection. The target classes of genes were (i) nucleotide binding site (NBS) leucine-rich repeat (LRR), (ii) coiled-coil nucleotide-binding leucine-rich repeat (CC-NB-LRR), (iii) LRR receptor-like kinase (RLK), (iv) casein kinase, (v) protein kinase, (vi) protein phosphatase subunits and the transcription factors (TF) (vii) MYB TF, (viii) GRAS (gibberellic acid-insensitive (GAI), repressor of GAI (RGA) and scarecrow (SCR)), and (ix) the MADS-box TF family. Expression of genes was analysed for six genotypes with different levels of resistance. As in previous reports, the highest BYDV-PAV titre was found in the susceptible genotypes Graciosa in barley and Semper and SGS 27-02 in wheat, which contrast with the resistant genotypes PRS-3628 and Wysor of wheat and barley, respectively. Statistically significant changes in wheat show up-regulation of NBS-LRR, CC-NBS-LRR and RLK in the susceptible genotypes and down-regulation in the resistant genotypes in response to BYDV-PAV. Similar up-regulation of NBS-LRR, CC-NBS-LRR, RLK and MYB TF in response to BYDV-PAV was also observed in the susceptible barley genotypes. However, no significant changes in the expression of these genes were generally observed in the resistant barley genotypes, except for the down-regulation of RLK. Casein kinase and Protein phosphatase were up-regulated early, 10 days after inoculation (dai) in the susceptible wheat genotypes, while the latter was down-regulated at 30 dai in resistant genotypes. Protein kinase was down-regulated both earlier (10 dai) and later (30 dai) in the susceptible wheat genotypes, but only in the later dai in the resistant genotypes. In contrast, GRAS TF and MYB TF were up-regulated in the susceptible wheat genotypes while no significant differences in MADS TF expression was observed. Protein kinase, Casein kinase (30 dai), MYB TF and GRAS TF (10 dai) were all up-regulated in the susceptible barley genotypes. However, no significant differences were found between the resistant and susceptible barley genotypes for the Protein phosphatase and MADS FT genes. Overall, our results showed a clear differentiation of gene expression patterns in both resistant and susceptible genotypes of wheat and barley. Therefore, further research on RLK, NBS-LRR, CC-NBS-LRR, GRAS TF and MYB TF can lead to BYDV-PAV resistance in cereals.
Keywords: BYDV-PAV; RT-qPCR; barley; gene expression; resistance; wheat.
Conflict of interest statement
The authors declare no conflict of interest.
Figures
Similar articles
-
The effect of elevated temperature on Barley yellow dwarf virus-PAV in wheat.Virus Res. 2014 Jun 24;186:97-103. doi: 10.1016/j.virusres.2013.12.023. Epub 2013 Dec 25. Virus Res. 2014. PMID: 24374266
-
First Report of Barley yellow dwarf virus-MAV in Oat, Wheat, and Barley Grown in the Czech Republic.Plant Dis. 2009 Sep;93(9):964. doi: 10.1094/PDIS-93-9-0964B. Plant Dis. 2009. PMID: 30754562
-
First Report of Barley yellow dwarf virus-PAS in Wheat and Barley Grown in the Czech Republic.Plant Dis. 2008 Nov;92(11):1587. doi: 10.1094/PDIS-92-11-1587B. Plant Dis. 2008. PMID: 30764455
-
Epidemiology and integrated management of persistently transmitted aphid-borne viruses of legume and cereal crops in West Asia and North Africa.Virus Res. 2009 May;141(2):209-18. doi: 10.1016/j.virusres.2008.12.007. Epub 2009 Jan 17. Virus Res. 2009. PMID: 19152820 Review.
-
Host plant resistance in wheat to barley yellow dwarf viruses and their aphid vectors: a review.Curr Opin Insect Sci. 2021 Jun;45:59-68. doi: 10.1016/j.cois.2021.01.002. Epub 2021 Feb 2. Curr Opin Insect Sci. 2021. PMID: 33545435 Review.
Cited by
-
Meta-QTL analysis for mining of candidate genes and constitutive gene network development for viral disease resistance in maize (Zea mays L.).Heliyon. 2024 Dec 14;11(1):e40984. doi: 10.1016/j.heliyon.2024.e40984. eCollection 2025 Jan 15. Heliyon. 2024. PMID: 39807520 Free PMC article.
-
A phloem-limited RNA phytovirus infection does not positively modulate vector preference and fitness in primary and alternate hosts.Environ Entomol. 2025 Apr 17;54(2):341-351. doi: 10.1093/ee/nvaf005. Environ Entomol. 2025. PMID: 39903452 Free PMC article.
References
-
- Hewings A.D. Purification and virion characterization of barley yellow dwarf viruses. In: D’Arcy C.J., Burnett P.A., editors. Barley Yellow Dwarf, 40 Years of Progress. APS Press; St. Paul, MN, USA: 1995. pp. 165–179.
-
- Power A., Gray S. Aphid transmission of barley yellow dwarf viruses interactions between viruses, vectors, and host plants. In: D’Arcy J.C., Burnett P.A., editors. Barley Yellow Dwarf, 40 Years of Progress. APS Press; Saint Paul, MN, USA: 1995. pp. 255–291.
-
- Burnett P.A., Comeau A., Qualset C.O. Host plant tolerance or resistance for control of barley yellow dwarf. In: D’Arcy C.J., Burnett P.A., editors. Barley Yellow Dwarf, 40 Years of Progress. APS Press; St. Paul, MN, USA: 1995. pp. 321–344.
Publication types
MeSH terms
Substances
LinkOut - more resources
Full Text Sources
Other Literature Sources
Research Materials
Miscellaneous
