. 2023 Mar 21;15(3):794.
doi: 10.3390/v15030794.

Circulating Plasma Exosomal Proteins of Either SHIV-Infected Rhesus Macaque or HIV-Infected Patient Indicates a Link to Neuropathogenesis

Affiliations

Circulating Plasma Exosomal Proteins of Either SHIV-Infected Rhesus Macaque or HIV-Infected Patient Indicates a Link to Neuropathogenesis

Partha K Chandra et al. Viruses. .

Abstract

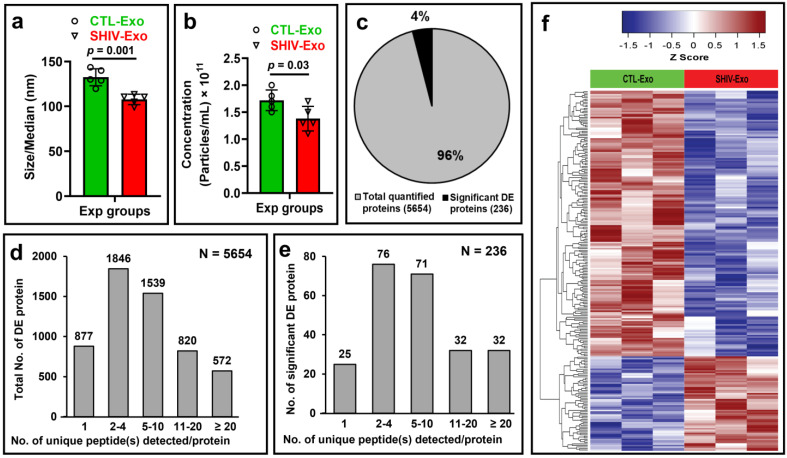
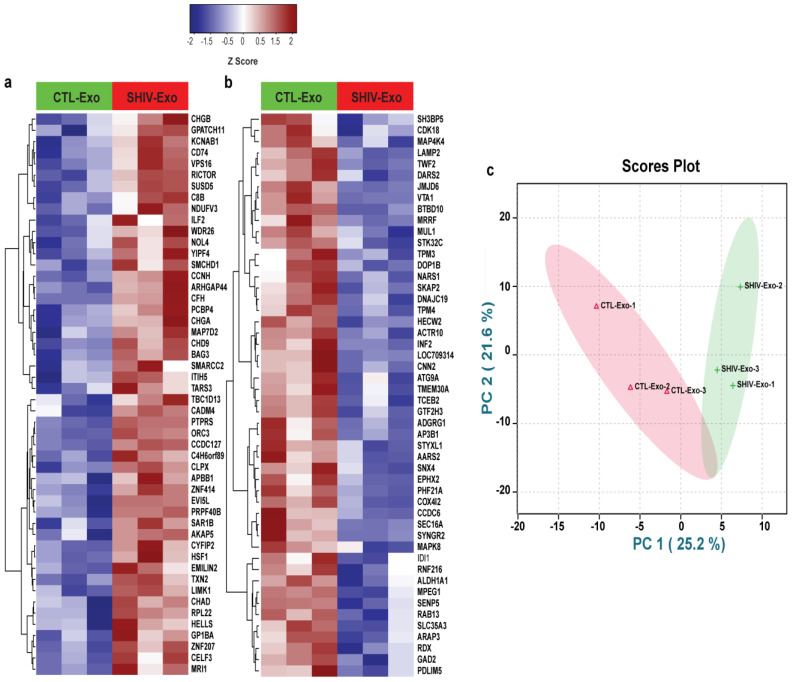
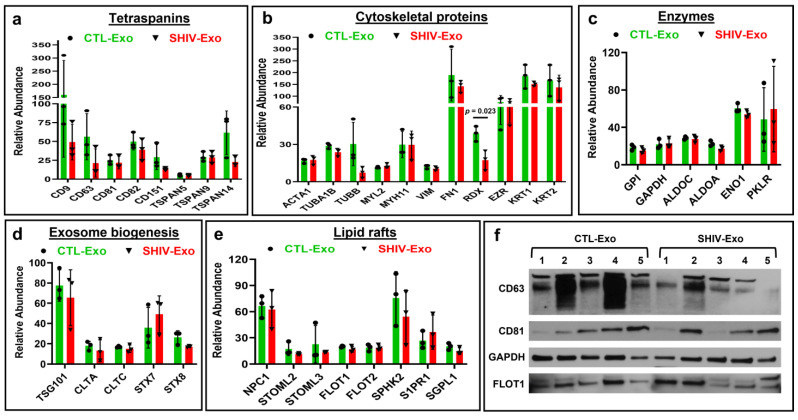
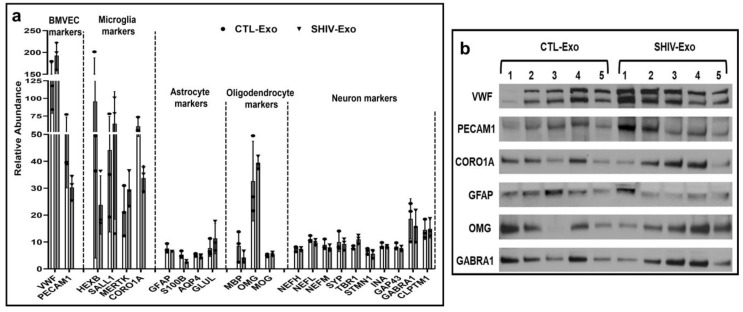
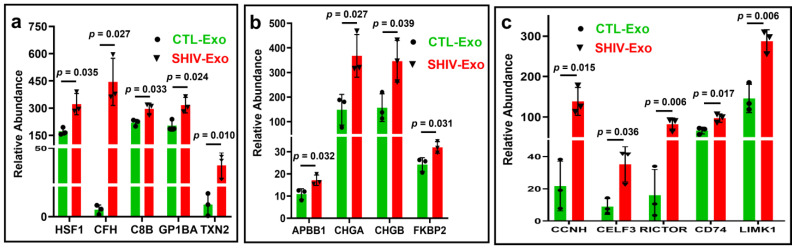
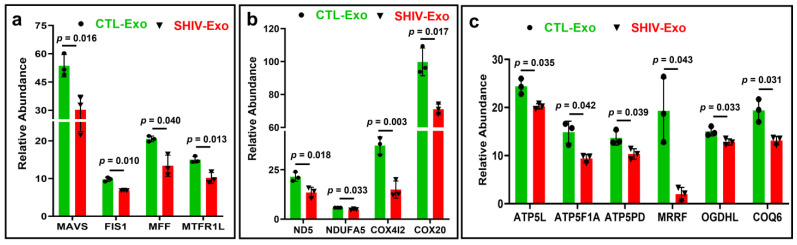
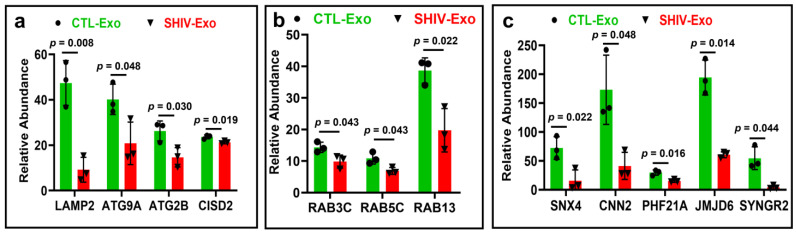
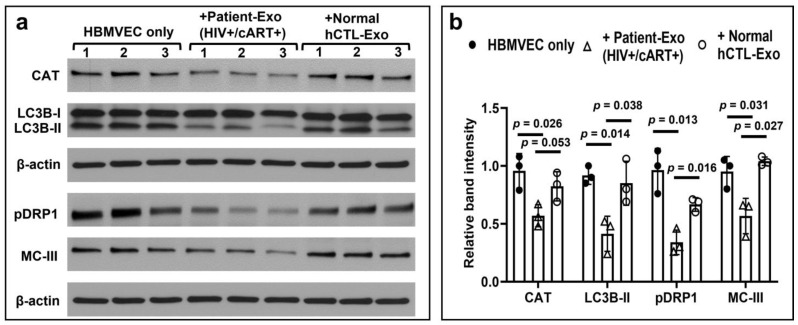
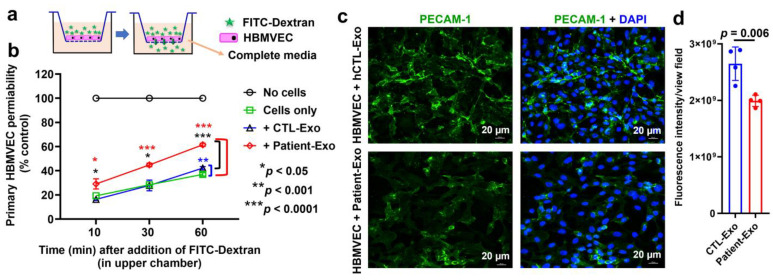
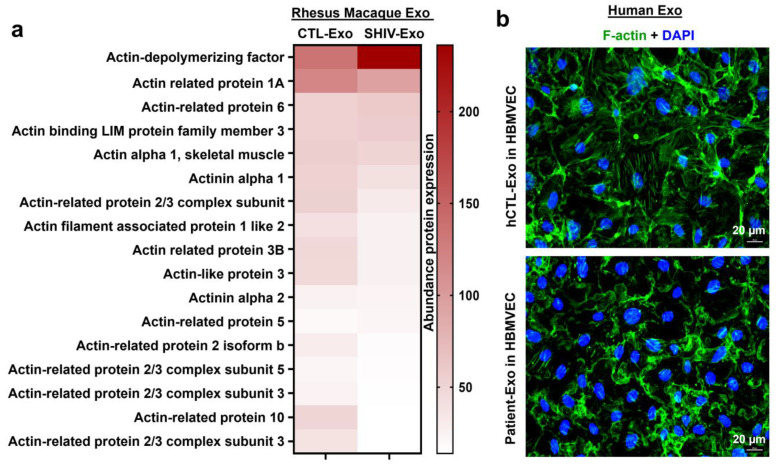
Despite the suppression of human immunodeficiency virus (HIV) replication by combined antiretroviral therapy (cART), 50-60% of HIV-infected patients suffer from HIV-associated neurocognitive disorders (HAND). Studies are uncovering the role of extracellular vesicles (EVs), especially exosomes, in the central nervous system (CNS) due to HIV infection. We investigated links among circulating plasma exosomal (crExo) proteins and neuropathogenesis in simian/human immunodeficiency virus (SHIV)-infected rhesus macaques (RM) and HIV-infected and cART treated patients (Patient-Exo). Isolated EVs from SHIV-infected (SHIV-Exo) and uninfected (CTL-Exo) RM were predominantly exosomes (particle size < 150 nm). Proteomic analysis quantified 5654 proteins, of which 236 proteins (~4%) were significantly, differentially expressed (DE) between SHIV-/CTL-Exo. Interestingly, different CNS cell specific markers were abundantly expressed in crExo. Proteins involved in latent viral reactivation, neuroinflammation, neuropathology-associated interactive as well as signaling molecules were expressed at significantly higher levels in SHIV-Exo than CTL-Exo. However, proteins involved in mitochondrial biogenesis, ATP production, autophagy, endocytosis, exocytosis, and cytoskeleton organization were significantly less expressed in SHIV-Exo than CTL-Exo. Interestingly, proteins involved in oxidative stress, mitochondrial biogenesis, ATP production, and autophagy were significantly downregulated in primary human brain microvascular endothelial cells exposed with HIV+/cART+ Patient-Exo. We showed that Patient-Exo significantly increased blood-brain barrier permeability, possibly due to loss of platelet endothelial cell adhesion molecule-1 protein and actin cytoskeleton structure. Our novel findings suggest that circulating exosomal proteins expressed CNS cell markers-possibly associated with viral reactivation and neuropathogenesis-that may elucidate the etiology of HAND.

Keywords: HIV-1; SHIV; circulating plasma exosomes; neuropathogenesis; proteomic analysis; rhesus macaque.


Conflict of interest statement

The authors declare no competing interest with respect to the research, authorship, and/or publication of this research article.

Figures

Figure 1
Figure 1
Characterization of circulating plasma exosomal proteome of SHIV-infected and uninfected Rhesus macaque (RM). (a,b) Exosomes were isolated by exoEasy Maxi Kit from the plasma of SHIV-infected and uninfected RM. The size (nm) and concentration (particles/mL) of the isolated exosomes were characterized by ZetaView Particle Metrix system. (c) Total and significantly differentially expressed (DE) proteins in plasma exosomes of SHIV-infected (SHIV-Exo) and control (CTL-Exo) RM quantified by proteomic analysis. (d) Comparison of the number of unique peptide(s) detected per quantified proteins. (e) Comparison of the number of unique peptide(s) detected in significant DE proteins. (f) A hierarchical cluster analysis of significant DE proteins. A heatmap was generated for all the 236 significant DE proteins using “Manhattan” clustering and “complete” linkage method.
Figure 2
Figure 2
(a,b) A hierarchical cluster analysis of significant top 50 up-/down-regulated proteins in SHIV-Exo. Proteins were filtered based on p < 0.05. Median values were calculated for CTL-Exo and SHIV-Exo to calculate the ratio (SHIV-/CTL-Exo). The ratio was used to generate the list of top 50 up and down regulated proteins. Z scores were calculated for each significant protein, and then heatmaps were generated for all the significant proteins: top 50 upregulated and top 50 downregulated proteins using “Manhattan” clustering and “complete” linkage method. Protein coding gene names are presented here. (c) To test if the dataset samples were separated, we performed a principal component analysis (PCA) analysis on all protein expression data and as observed the CTL-Exo (in red) are clustered separately from the SHIV-Exo (in green). Unsupervised PCA plot is generated in R Studio by using median normalized and log10 transformed data from each sample type. CTL-Exo: Plasma exosomes isolated from uninfected RM; SHIV-Exo: Plasma exosomes isolated from SHIV-infected RM.
Figure 3
Figure 3
Hallmark exosomal proteins quantified by proteomic analysis in circulating exosomes of SHIV-infected and uninfected RM. (ae) Relative abundance of quantified proteins in CTL-/SHIV-Exo. Proteins that exhibited group differences shown as bar graphs with green and red for CTL-Exo and SHIV-Exo, respectively. Plasma exosomes were isolated from three SHIV-infected and three uninfected RM (N = 3/group). Graphs show mean ± SD of relative abundance that was calculated from four experimental replicates of each sample. Protein group ‘b’ and ‘e’ passed the D’Agostino and Pearson normality test and protein group ‘c’ and ‘d’ passed the Shapiro–Wilk normality test. Protein group ‘a’ did not pass the normality test. The data sets were followed by unpaired t test with Welch correction, performed for normally distributed data. When the data did not pass the normality test, a non-parametric Mann–Whitney test was performed. Significant differences (p < 0.05) between groups are indicated. (f) The expression of CD63, CD81, GAPDH, and FLOT1 in CTL-/SHIV-Exo was further validated by Western blotting (N = 5/group). The protein coding gene names are presented here and were also described in the text. CTL-Exo: Plasma exosomes isolated from uninfected RM; SHIV-Exo: Plasma exosomes isolated from SHIV-infected RM.
Figure 4
Figure 4
Relative abundance of CNS cell markers in circulating plasma exosomes. (a) Central nervous system (CNS) cells-specific exosomal proteins in CTL-/SHIV-Exo were quantified by proteomic analysis. Proteins that exhibited group differences shown as bar graphs with white and gray for CTL-Exo and SHIV-Exo, respectively. Plasma exosomes were isolated from three SHIV-infected and three uninfected RM (N = 3/group). Graphs show mean ± SD of relative abundance calculated from four experimental replicates per sample. For a protein group not passing the normality test, a non-parametric Mann–Whitney test was performed. There were no significant differences (p < 0.05) between groups. (b) The indicated proteins were further validated by Western blotting. For this assay, plasma exosomes were isolated from five SHIV-infected and five uninfected RM (N = 5/group). Protein coding gene names are presented here and were described in the text. CTL-Exo: Plasma exosomes isolated from uninfected RM; SHIV-Exo: Plasma exosomes isolated from SHIV-infected RM. BMVEC: Brain microvascular endothelial cells.
Figure 5
Figure 5
Increased expression of proteins involved in viral reactivation, inflammation, and neuropathology-associated interactive/signaling proteins in SHIV-Exo. (ac) Relative protein abundance in CTL-/SHIV-Exo was quantified by proteomic analysis. Proteins that exhibited group differences are shown as bar graphs with green and red for CTL-Exo and SHIV-Exo, respectively. Plasma exosomes were isolated from three SHIV-infected and three uninfected RM (N = 3/group). Graphs show mean ± SD relative abundance that was calculated from four experimental replicates of each sample. All protein groups (ac) passed the Shapiro–Wilk normality test, and the data sets followed by unpaired t test with Welch correction for normally distributed data. The protein coding gene names are presented here, and they were described in the text. CTL-Exo: Plasma exosomes isolated from uninfected RM; SHIV-Exo: Plasma exosomes isolated from SHIV-infected RM. q-values for: (a) all of them are 0.035; (b) all of them are 0.040; and (c) 0.022, 0.036, 0.017, 0.022, 0.017. Age-adjusted p-values were presented in the Supplementary Materials File S1.
Figure 6
Figure 6
Decreased expression of proteins involved in mitochondrial biogenesis and ATP production in SHIV-Exo. (ac) Differential expression of mitochondrial proteins in CTL-/SHIV-Exo quantified by proteomic analysis. Proteins that exhibited group differences are shown as bar graphs with green and red for CTL-Exo and SHIV-Exo, respectively. Plasma exosomes were isolated from three SHIV-infected and three uninfected RM (N = 3/group). Graphs show mean ± SD of relative abundance calculated from four experimental replicates/sample. Protein group ‘a’ and ‘c’ passed the Shapiro–Wilk normality test and protein group ‘b’ passed the D’Agostino and Pearson normality test. The data sets were followed by unpaired t test with Welch correction for normally distributed data. The protein coding gene names are presented here, and they were described in the text. CTL-Exo: Plasma exosomes isolated from uninfected RM; SHIV-Exo: Plasma exosomes isolated from SHIV-infected RM. q-values for: (a) 0.022, 0.022, 0.039, 0.022; (b) 0.024, 0.037, 0.013, 0.024; and (c) all of them are 0.043. Age-adjusted p-values were presented in the Supplementary Materials File S1.
Figure 7
Figure 7
Decreased expression of proteins involved in autophagy, endosomal recycling, exocytosis, and sprouting angiogenesis in SHIV-Exo. (ac) Differential expression of proteins involved in autophagy, endosomal recycling, exocytosis, and sprouting angiogenesis in CTL-/SHIV-Exo quantified by proteomic analysis. Proteins exhibiting group differences are shown as bar graphs with green and red for CTL-Exo and SHIV-Exo, respectively. Graphs show mean ± SD of relative abundance calculated from four experimental replicates/sample. All protein groups passed the Shapiro–Wilk normality test. The data sets were followed by unpaired t test with Welch correction for normally distributed data. The protein coding gene names are presented here and were described in the text. CTL-Exo: Plasma exosomes isolated from uninfected RM; SHIV-Exo: Plasma exosomes isolated from SHIV-infected RM (N = 3/group). q-values for: (a) 0.036, 0.048, 0.041, 0.038; (b) all of them are 0.042; and (c) 0.037, 0.048, 0.037, 0.037, 0.048. Age-adjusted p-values were presented in the Supplementary Materials File S1.
Figure 8
Figure 8
The effect of HIV-infected and cART-treated Patient-Exo on primary HBMVECs. (a) Cells were treated with 10 µg/mL of both Patient-Exo as well as exosomes isolated from healthy human plasma (hCTL-Exo) for 24 h. The indicated proteins were qualitatively detected by Western blotting from equal amount (15 µg) of clarified cell lysates and β-actin was used as an internal control. Three independent experiments were performed and are presented by Arabic numbers. (b) The relative band intensities of CAT, LC3B-II, pDRP1, and MC-III were compared by Image-J software (version 1.50). Values were mean ± standard deviation (SD). The data set passed the Shapiro–Wilk normality test and unpaired t test with Welch correction was performed for normally distributed data. q-values: all of them are 0.041 for HBMVEC only vs Patient-Exo; and 0.054, 0.043, 0.041, 0.041 for hCTL-Exo vs. Patient-Exo.
Figure 9
Figure 9
In vitro BBB permeability assays and the detection of PECAM-1 by immunofluorescence confocal microscopy in primary HBMVECs exposed to HIV+ Patient-Exo. (a) Schematic diagram of transwell migration-based BBB permeability in vitro assay. (b) Graph showing the BBB permeability efficiency of fluorescence labeled high molecular weight dextran (FITC-Dextran, 150 kDa) in the absence (black line) and presence (red, blue, and green lines) of cell monolayer. Cells without treatment (Cells only) or treated with normal human plasma exosomes (+CTL-Exo) were used as controls. The increased BBB permeability in cells treated with HIV-infected and cART-treated patient plasma exosomes (+Patient-Exo) is indicated by the red line. N = 4 experimental replicates were performed. (c) Representative immunofluorescent confocal microscope images of HBMVEC expressing PECAM-1 after 24 h treatment (10 µg/mL) with either hCTL-Exo or Patient-Exo. (d) The relative fluorescence intensity of PECAM-1 per view field was compared.
Figure 10
Figure 10
Differential expression of actin cytoskeleton proteins in RM plasma exosomes and the expression pattern of F-actin in primary HBMVECs after exposure to HIV+ Patient-Exo. (a) The heat map of the abundance actin cytoskeleton proteins quantified by proteomic analysis was generated by using GraphPad Prism version 9.0.0 for Windows. (b) Representative immunofluorescent confocal microscope images of the HBMVEC expressing F-actin after 24 h treatment (10 µg/mL) with either hCTL-Exo or Patient-Exo.

Similar articles

Cited by

References

    1. UNAIDS Global HIV Statistics—Fact Sheet 2021. 2021. [(accessed on 14 March 2021)]. Available online: https://www.unaids.org/sites/default/files/media_asset/UNAIDS_FactSheet_....
    1. Alford K., Vera J.H. Cognitive Impairment in people living with HIV in the ART era: A Review. Br. Med. Bull. 2018;127:55–68. doi: 10.1093/bmb/ldy019. - DOI - PubMed
    1. Huang-Doran I., Zhang C.Y., Vidal-Puig A. Extracellular vesicles: Novel mediators of cell communication in metabolic disease. Trends Endocrinol. Metab. 2017;28:3–18. doi: 10.1016/j.tem.2016.10.003. - DOI - PubMed
    1. van Niel G., D’Angelo G., Raposo G. Shedding light on the cell biology of extracellular vesicles. Nat. Rev. Mol. Cell Biol. 2018;19:213–228. doi: 10.1038/nrm.2017.125. - DOI - PubMed
    1. Caobi A., Nair M., Raymond A.D. Extracellular Vesicles in the Pathogenesis of Viral Infections in Humans. Viruses. 2020;12:1200. doi: 10.3390/v12101200. - DOI - PMC - PubMed

Publication types

Substances