

Study on the COVID-19 epidemic in mainland China between November 2022 and January 2023, with prediction of its tendency
- PMID: 36992708
- PMCID: PMC10030260
- DOI: 10.1016/j.jobb.2023.03.001
Study on the COVID-19 epidemic in mainland China between November 2022 and January 2023, with prediction of its tendency
Abstract
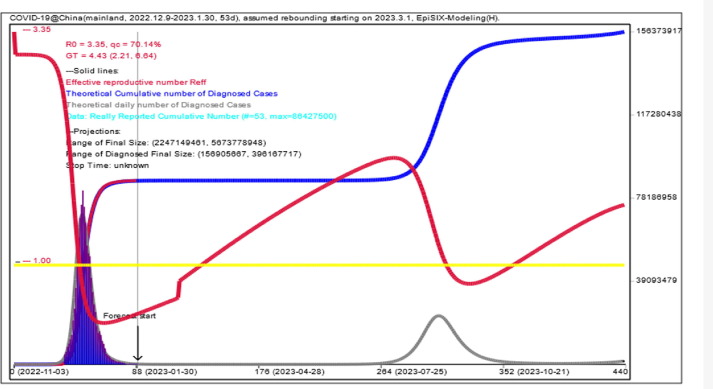
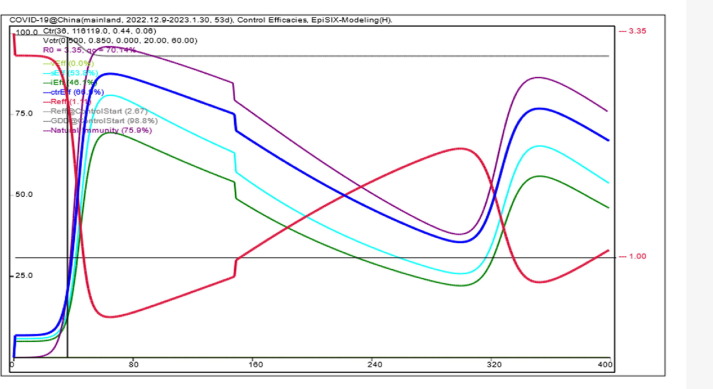
The prediction system EpiSIX was used to study the COVID-19 epidemic in mainland China between November 2022 and January 2023, based on reported data from December 9, 2022, to January 30, 2023, released by The Chinese Center for Disease Control and Prevention on February 1, 2023. Three kinds of reported data were used for model fitting: the daily numbers of positive nucleic acid tests and deaths, and the daily number of hospital beds taken by COVID-19 patients. It was estimated that the overall infection rate was 87.54% and the overall case fatality rate was 0.078%-0.116% (median 0.100%). Assuming that a new COVID-19 epidemic outbreak would start in March or April of 2023, induced by a slightly more infectious mutant strain, we predicted a possible large rebound between September and October 2023, with a peak demand of between 800,000 and 900,000 inpatient beds. If no such new outbreak was induced by other variants, then the current COVID-19 epidemic course in mainland China would remain under control until the end of 2023. However, it is suggested that the necessary medical resources be prepared to manage possible COVID-19 epidemic emergencies in the near future, especially for the period between September and October 2023.
Keywords: COVID-19; Case fatality rate; Epidemic; Infection rate; Prediction.
© 2023 Published by Elsevier B.V. on behalf of KeAi Communications Co., Ltd.
Conflict of interest statement
The authors declare that they have no known competing financial interests or personal relationships that could have appeared to influence the work reported in this paper.
Figures


References
-
- National Heath Commission of the People’s Republic of China (https://www.nhc.gov.cn), World Heath Organization (https://www.who.int).
-
- World Heath Organization. Classification of Omicron (B.1.1.529): SARS-CoV-2 Variant of Concern[EB/OL]. [2021-12-01][2022-09-21]. https://www.who.int/news/item/ 26-11-2021-classification-of-omicron-(b.1.1.529)-sars-cov-2-variant-of-concern.
-
- National Novel Coronavirus Infection Epidemic Situation(in Chinese and English). https://www.chinacdc.cn/jkzt/crb/zl/szkb_11803/jszl_13141/202302/t202302....
-
- Huang S. A new SEIR model with applications to the theory of eradication and control of diseases, and to the calculation of R0. Math Biosci. 2008;215:84–104. - PubMed
-
- Huang S., Peng Z., Jin Z. Studies of the strategies for controlling the COVID-19 epidemic in China: Estimation of control efficacy and suggestions for policy makers. Sci Sinica Math. 2020;50(6):885–898. doi: 10.1360/SSM-2020-0043. in Chinese. - DOI
LinkOut - more resources
Full Text Sources
Miscellaneous