. 2023 Mar 13:14:1125866.
doi: 10.3389/fphar.2023.1125866. eCollection 2023.

ALDH2 attenuates myocardial pyroptosis through breaking down Mitochondrion-NLRP3 inflammasome pathway in septic shock

Affiliations

ALDH2 attenuates myocardial pyroptosis through breaking down Mitochondrion-NLRP3 inflammasome pathway in septic shock

Ying Zhang et al. Front Pharmacol. .

Abstract

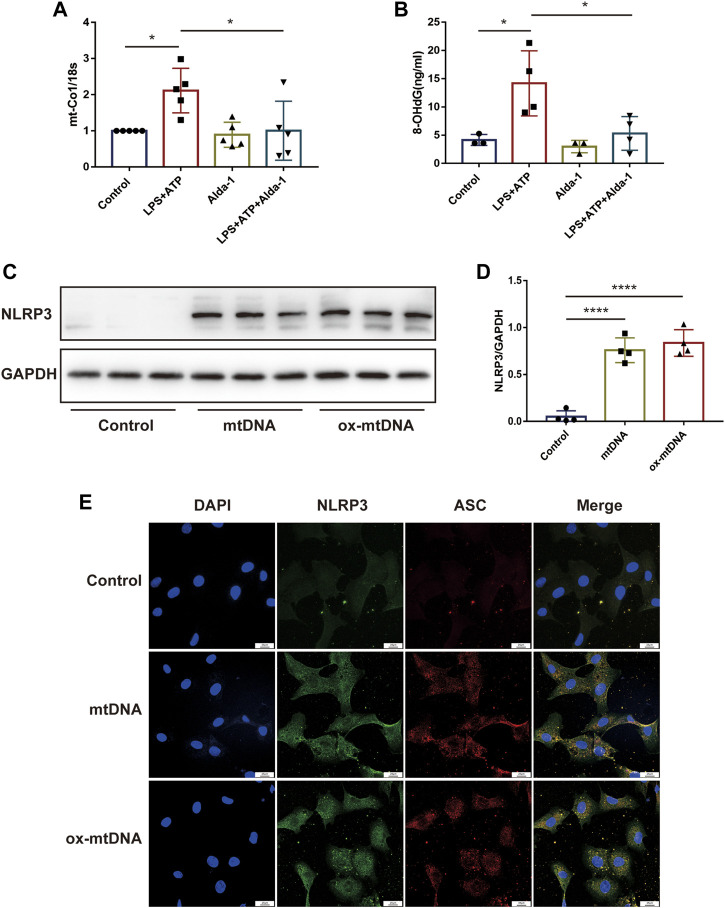
Cell survival or death is critical for cardiac function. Myocardial pyroptosis, as a newly recognized programmed cell death, remains poorly understood in sepsis. In this study, we evaluated the effect of aldehyde dehydrogenase (ALDH2) on myocardial pyroptosis and revealed the underlying mechanisms in sepsis. We established a septic shock mice model by intraperitoneal injection of Lipopolysaccharide (LPS, 15 mg/kg) 12 h before sacrifice. It was found that aldehyde dehydrogenase significantly inhibited NOD-like receptor protein 3 (NLRP3) inflammasome activation and Caspase-1/GSDMD-dependent pyroptosis, which remarkably improved survival rate and septic shock-induced cardiac dysfunction, relative to the control group. While aldehyde dehydrogenase knockout or knockdown significantly aggravated these phenomena. Intriguingly, we found that aldehyde dehydrogenase inhibited LPS-induced deacetylation of Hydroxyacyl-CoA dehydrogenase trifunctional multienzyme complex α subunit (HADHA) by suppressing the translocation of Histone deacetylase 3 (HDAC3) from nuclei to mitochondria. Acetylated HADHA is essential for mitochondrial fatty acid β-oxidation, and its interruption can result in accumulation of toxic lipids, induce mROS and cause mtDNA and ox-mtDNA release. Our results confirmed the role of Histone deacetylase 3 and HADHA in NOD-like receptor protein 3 inflammasome activation. Hdac3 knockdown remarkedly suppressed NOD-like receptor protein 3 inflammasome and pyroptosis, but Hadha knockdown eliminated the effect. aldehyde dehydrogenase inhibited the translocation of Histone deacetylase 3, protected ac-HADHA from deacetylation, and significantly reduced the accumulation of toxic aldehyde, and inhibited mROS and ox-mtDNA, thereby avoided NOD-like receptor protein 3 inflammasome activation and pyroptosis. This study provided a novel mechanism of myocardial pyroptosis through mitochondrial Histone deacetylase 3/HADHA- NOD-like receptor protein 3 inflammasome pathway and demonstrated a significant role of aldehyde dehydrogenase as a therapeutic target for myocardial pyroptosis in sepsis.

Keywords: HADHA; NLRP3 inflammasome; aldehyde dehydrogenase 2; myocardial pyroptosis; septic shock.


Conflict of interest statement

The authors declare that the research was conducted in the absence of any commercial or financial relationships that could be construed as a potential conflict of interest.

Figures

FIGURE 1
FIGURE 1
Effect of ALDH2 on LPS-induced cardiac dysfunction and mortality. (A) Experimental modeling. Mice were treated with or without LPS (15 mg/kg, i.p. for 12 h). Alda-1 (20 mg/kg, i.p.) was given 30min before LPS injection. (B) Murine Sepsis Score, n = 7 per group. (C) Survival rate was monitored up to 12 h. A Kaplan-Meier plot was used to show the survival rate of mice from each group, n = 12 per group. (D–G) Representative echocardiographic images from different groups and the quantitative analysis of echocardiography, n = 11 per group. (H) The quantitative analysis of ALDH2 enzymatic activity, n = 4 per group, Mean ± SEM. ****p < 0.0001; ***p < 0.001; **p < 0.01; *p < 0.05; ns = not significant.
FIGURE 2
FIGURE 2
ALDH2 attenuates LPS-induced myocardial pyroptosis and inflammation in septic shock. (A) Representative HE staining images of cardiac tissue, red arrows indicate inflammatory infiltration, scale bar: 100 μm. (B,C) Representative TUNEL staining images of cardiac tissue and the quantitative analysis, scale bar: 50 μm. (D) The quantitative analysis of LDH release levels, n = 4 per group. (E,F) The quantitative analysis of RT-qPCR and ELISA results including IL-1β, IL-6, and TNF-α. N = 3–5 per group. (G,H) Representative morphological changes of pyroptosis in bright field and PI staining and the quantitative analysis of the PI positive H9C2 cells, red arrows indicate bubbling of pyroptotic cells, scale bar: 25 μm. (I) The quantitative analysis of IL-18 release level, n = 4 per group. Mean ± SEM, ****p < 0.0001, ns = not significant.
FIGURE 3
FIGURE 3
ALDH2 inhibits myocardial pyroptosis through NLRP3/Caspase-1/GSDMD signaling pathway. (A-F) Representative immunoblots and quantification of N-GSDMD, GSDMD, NLRP3 and caspase-1 p20 protein in LPS-stimulated Aldh2 −/− and WT mice (GAPDH; loading control), n = 3-4 per group. (G) Representative immunofluorescence tissue images showing caspase-1 (green) and DAPI (blue), scale bar: 50 μm. (H) Representative immunohistochemical images showing caspase-1 (brown), scale bar: 50 μm. (I–L) H9C2 cells were stimulated by LPS plus ATP with or without pre-treated Alda-1. (I) Representative immunofluorescence images showing caspase-1 (green) and DAPI (blue), scale bar: 100 μm. (J,K) Representative flow cytometry graphs showing positive-caspase-1/PI double staining and the quantitative analysis of the double positive, n = 3 per group. (L) Representative immunofluorescence images showing NLRP3/ASC speck, scale bar: 25 μm. Mean ± SEM. ****p < 0.0001; ***p < 0.001; **p < 0.01; *p < 0.05; ns = not significant.
FIGURE 4
FIGURE 4
MtDNA and ox-mtDNA promotes NLRP3 expression and NLRP3 inflammasome activation. (A,B) The levels of total mtDNA or 8-OHdG (ox-mtDNA) in LPS plus ATP-stimulated or control H9C2 cells pre-incubated with or without Alda-1, n = 3-5 per group. (C,D) Representative immunoblots and the relative quantification analysis of NLRP3 with or without mtDNA or ox-mtDNA transfection, n = 4 per group. (E) Representative immunofluorescence images showing NLRP3/ASC speck, scale bar: 25 μm. Mean ± SEM. ****p < 0.0001; ***p < 0.001; *p < 0.05; ns = not significant.
FIGURE 5
FIGURE 5
ALDH2 suppresses myocardial toxic aldehyde accumulation, oxidative stress, and improves mitochondrial respiratory function. (A) Representative dihydroethidium (DHE) staining images in cardiac tissue, scale bar: 200 μm. (B,C) Representative immunoblots and quantification of 4-HNE-protein adducts in cardiac tissue, the LPS stimulated mice were pre-treated with or without Alda-1, n = 4 per group. (D–K) Mitochondrial respiration measurements of OCR in H9C2 cells treated with Aldh2 siRNA or negative control (NC) or Alda-1, quantification of basal respiration, ATP production, and maximal respiration. (L,M) The levels of total mtDNA or ox-mtDNA in 4-HNE-stimulated or control H9C2 cells pre-incubated with or without Alda-1, n = 4 per group. Mean ± SEM. ****p < 0.0001; ***p < 0.001; **p < 0.01; *p < 0.05; ns = not significant.
FIGURE 6
FIGURE 6
HADHA deacetylation is responsible for mitochondrial damage and cardiomyocytes pyroptosis, and ALDH2 suppresses HADHA deacetylation. (A) Representative immunoblots of HADHA acetylation levels in LPS plus ATP-stimulated or control H9C2 cells with or without pre-treated Alda-1, n = 3 per group. (B–E) Mitochondrial respiration measurements of OCR in Hadha silenced or negative control H9C2 cells with or without LPS plus ATP stimulation, quantification of basal respiration, ATP production, and maximal respiration. (F,G) Representative flow cytometry graphs showing positive-caspase-1/PI double staining in Hadha silenced or negative control H9C2 cells with or without LPS plus ATP stimulation and quantitative analysis of the double positive, n = 4 per group. Mean ± SEM. ****p < 0.0001; ***p < 0.001; *p < 0.05; ns = not significant.
FIGURE 7
FIGURE 7
ALDH2 suppresses the translocation of HDAC3 from nucleus to mitochondria. (A) Total levels of HDAC3 and the quantitative analysis, n = 3 per group. (B) Representative immunoblots of HADHA acetylation levels in Hdac3 silenced or Aldh2 silenced or negative control H9C2 cells with or without LPS plus ATP stimulation, n = 3 per group. (C) Representative confocal images showing HDAC3 (green), Mito Tracker (red) and DAPI (blue), scale bar: 10 μm. (D,E) Total levels of HDAC3, and the cytoplasmic and nuclear levels of HDAC3 proteins, and the quantitative analysis. Histone 3 and GAPDH were used as loading control of nuclear and cytoplasmic fractions, respectively, n = 3-4 per group. (F,G) The level of HDAC in mitochondrial and nuclei and the quantitative analysis. PCNA and COX4 were used as loading control of nuclear and mitochondrial fractions, respectively, n = 5 per group. (H) Representative immunofluorescence images showing NLRP3/ASC speck in Hdac3 silenced or Hadha silenced or negative control H9C2 cells with or without LPS plus ATP stimulation, scale bar: 25 μm. (I,J) Representative immunoblots and the quantification of Caspase-1 p20 protein in H9C2 cells (GAPDH; loading control), n = 6, Mean ± SEM. ****p < 0.0001; ***p < 0.001; *p < 0.05; ns = not significant.
FIGURE 8
FIGURE 8
A diagram showing ALDH2 as a therapeutic target to protect against septic shock-induced myocardial pyroptosis.

References

    1. Adamo L., Rocha-Resende C., Prabhu S. D., Mann D. L. (2020). Reappraising the role of inflammation in heart failure. Nat. Rev. Cardiol. 17, 269–285. 10.1038/s41569-019-0315-x - DOI - PubMed
    1. Bartoli-Leonard F., Saddic L., Aikawa E. (2020). Double-edged sword of ALDH2 mutations: One polymorphism can both benefit and harm the cardiovascular system. Eur. Heart J. 41, 2453–2455. 10.1093/eurheartj/ehaa444 - DOI - PMC - PubMed
    1. Beesley S. J., Weber G., Sarge T., Nikravan S., Grissom C. K., Lanspa M. J., et al. (2018). Septic cardiomyopathy. Crit. Care Med. 46, 625–634. 10.1097/CCM.0000000000002851 - DOI - PubMed
    1. Bergsbaken T., Fink S. L., Cookson B. T. (2009). Pyroptosis: Host cell death and inflammation. Nat. Rev. Microbiol. 7, 99–109. 10.1038/nrmicro2070 - DOI - PMC - PubMed
    1. Broz P., Dixit V. M. (2016). Inflammasomes: Mechanism of assembly, regulation and signalling. Nat. Rev. Immunol. 16, 407–420. 10.1038/nri.2016.58 - DOI - PubMed

LinkOut - more resources