[Preprint]. 2023 Mar 19:2023.03.14.23287284.
doi: 10.1101/2023.03.14.23287284.

The effect of M. tuberculosis lineage on clinical phenotype

Affiliations

The effect of M. tuberculosis lineage on clinical phenotype

Duc Hong Du et al. medRxiv. .

Update in

  • The effect of M. tuberculosis lineage on clinical phenotype.
    Du DH, Geskus RB, Zhao Y, Codecasa LR, Cirillo DM, van Crevel R, Pascapurnama DN, Chaidir L, Niemann S, Diel R, Omar SV, Grandjean L, Rokadiya S, Ortitz AT, Lân NH, Hà ĐTM, Smith EG, Robinson E, Dedicoat M, Nhat LTH, Thwaites GE, Van LH, Thuong NTT, Walker TM. Du DH, et al. PLOS Glob Public Health. 2023 Dec 20;3(12):e0001788. doi: 10.1371/journal.pgph.0001788. eCollection 2023. PLOS Glob Public Health. 2023. PMID: 38117783 Free PMC article.

Abstract

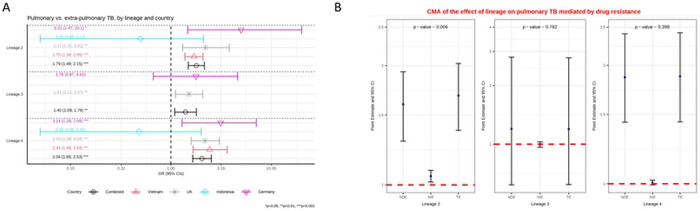
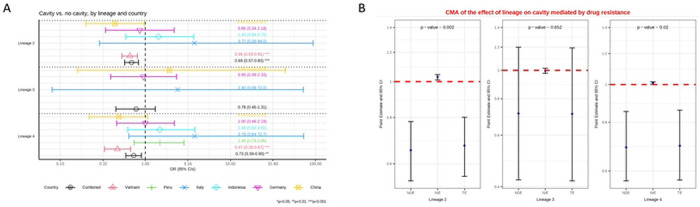
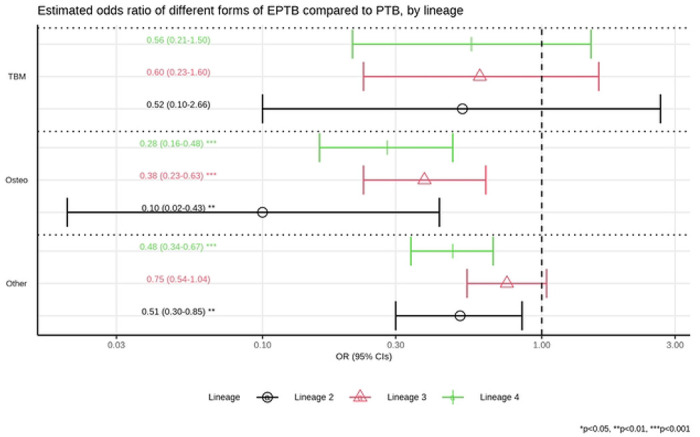
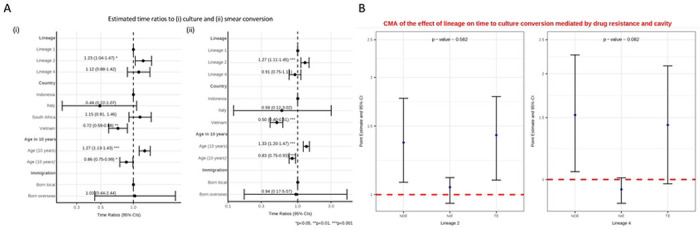
Eight lineages of Mycobacterium tuberculosis sensu stricto are described. Single-country or small observational data suggest differences in clinical phenotype between lineages. We present strain lineage and clinical phenotype data from 12,246 patients from 3 low-incidence and 5 high-incidence countries. We used multivariable logistic regression to explore the effect of lineage on site of disease and on cavities on chest radiography, given pulmonary TB; multivariable multinomial logistic regression to investigate types of extra-pulmonary TB, given lineage; and accelerated failure time and Cox proportional-hazards models to explore the effect of lineage on time to smear and culture-conversion. Mediation analyses quantified the direct effects of lineage on outcomes. Pulmonary disease was more likely among patients with lineage(L) 2, L3 or L4, than L1 (adjusted odds ratio (aOR) 1.79, (95% confidence interval 1.49-2.15), p<0.001; aOR=1.40(1.09-1.79), p=0.007; aOR=2.04(1.65-2.53), p<0.001, respectively). Among patients with pulmonary TB, those with L1 had greater risk of cavities on chest radiography versus those with L2 (aOR=0.69(0.57-0.83), p<0.001) and L4 strains (aOR=0.73(0.59-0.90), p=0.002). L1 strains were more likely to cause osteomyelitis among patients with extra-pulmonary TB, versus L2-4 (p=0.033, p=0.008 and p=0.049 respectively). Patients with L1 strains showed shorter time-to-sputum smear conversion than for L2. Causal mediation analysis showed the effect of lineage in each case was largely direct. The pattern of clinical phenotypes seen with L1 strains differed from modern lineages (L2-4). This has implications for clinical management and could influence clinical trial selection strategies.


Figures

Figure 1:
Figure 1:
A: Multivariable logistic regression model on the association between lineage and pulmonary versus extra-pulmonary tuberculosis (TB) controlling for age and immigration. Estimated odd ratios (ORs) and bars representing 95% confidence intervals (CIs) are shown on the x-axis for lineage 2, 3 and 4, compared to lineage 1 as reference, for each country as well as for all these countries combined. P-values denote evidence of the associations of lineage and pulmonary TB. B: Causal mediation analysis (CMA) on the effect of lineage on pulmonary TB, mediated by drug resistance. Estimated odds ratio (ORs) and bars representing 95% confidence intervals (CIs) are shown on the y-axis for each decomposition effect including NDE: natural direct effect odds ratio; NIE: natural indirect effect odds ratio; and TE: total effect odds ratio for lineage 2, lineage 3, and lineage 4, compared to lineage 1 as reference. All multivariable models adjusted for country, immigration, and age are shown. P-values denote evidence of natural indirect effect of lineage on pulmonary TB mediated through drug resistance. The red horizontal lines indicate the thresholds of the results (ORs) of interest.
Figure 2:
Figure 2:
A: Multivariable logistic regression model on the association between lineage and the presence of cavity versus no cavity among patients with pulmonary TB, controlling for age and immigration. Estimated odd ratios (ORs) and bars representing 95% confidence intervals (CIs) are shown on the x-axis for lineage 2, 3 and 4, compared to lineage 1 as reference, for each country as well as for all these countries combined. P-values denote evidence of the associations of lineage and cavity. B: Causal mediation analysis (CMA) on the effect of lineage on cavity, mediated by drug resistance. Estimated odds ratio (ORs) and bars representing 95% confidence intervals (CIs) are shown on the y-axis for each of the decomposition effect including NDE: natural direct effect odds ratio; NIE: natural indirect effect odds ratio; and TE: total effect odds ratio of lineage 2, lineage 3, and lineage 4, compared to lineage 1 as reference. All multivariable models adjusted for country, immigration, and age are shown. P-values denote evidence of natural indirect effect of lineage on cavity mediated through drug resistance. The red horizontal lines indicate the thresholds of the results (ORs) of interest.
Figure 3:
Figure 3:
Multinomial, multivariable regression for pulmonary tuberculosis (TB) vs. three types of extra-pulmonary TB (TB meningitis, TB osteomyelitis, and other forms of extra-pulmonary TB), by lineage, controlling for country and immigration. Estimated odd ratios (ORs) and bars representing 95% confidence intervals (CIs) are shown on the x-axis for the odds ratios of being lineage 2, 3 and 4, compared to lineage 1 as reference, comparing pulmonary TB to each of form of extra-pulmonary TB (“TBM” - TB meningitis, “Osteo” - TB osteomyelitis, and “Other” - other forms of extra-pulmonary TB) on the y-axis. P-values denote evidence of the association between lineages and different forms of extra-pulmonary TB compared to pulmonary TB.
Figure 4:
Figure 4:
A: Interval censored regression using accelerated failure time models on the association between lineage and time to culture (i) and smear (ii) conversion controlling for age, country and immigration status. Estimated time ratios and bars representing 95% confidence intervals (CIs) are shown on the x-axis. Data from Indonesia, Italy and South Africa all had interval censored data whereas the data from Vietnam were binary (<=60 days or >60 days). The Vietnamese data were therefore converted to interval data (“0 to 60” if <=60; and “61 to ∞” if >60). P-values denote evidence of the associations of lineage and time to culture or smear conversion. B: Causal mediation analysis (CMA) on the effect of lineage on time to culture conversion mediated by drug resistance and cavity. Estimated time ratios and bars representing 95% confidence intervals (CIs) are shown on the y-axis for each of the decomposition effect including NDE: natural direct effect odds ratio; NIE: natural indirect effect odds ratio; and TE: total effect odds ratio of lineage 2 and lineage 4, compared to lineage 1 as reference. All multivariable models adjusted for country, immigration, and age are shown. P-values denote evidence of natural indirect effect of lineage on time to culture conversion mediated through drug resistance and cavity. The red horizontal lines indicate the thread holds of the results (ORs) of interest.

References

    1. World Health Organization. Global tuberculosis report 2021 [Internet]. Geneva: World Health Organization; 2021. [cited 2021 Oct 14]. Available from: https://apps.who.int/iris/handle/10665/346387
    1. Ngabonziza JCS, Loiseau C, Marceau M, Jouet A, Menardo F, Tzfadia O, et al. A sister lineage of the Mycobacterium tuberculosis complex discovered in the African Great Lakes region. Nat Commun. 2020. Dec;11(1):2917. - PMC - PubMed
    1. Coscolla M, Gagneux S, Menardo F, Loiseau C, Ruiz-Rodriguez P, Borrell S, et al. Phylogenomics of Mycobacterium africanum reveals a new lineage and a complex evolutionary history. Microbial Genomics. 2021. February 1;7(2). - PMC - PubMed
    1. Gagneux S, DeRiemer K, Van T, Kato-Maeda M, de Jong BC, Narayanan S, et al. Variable host-pathogen compatibility in Mycobacterium tuberculosis. Proc Natl Acad Sci USA. 2006. Feb 21;103(8):2869–73. - PMC - PubMed
    1. Pasipanodya JG, Moonan PK, Vecino E, Miller TL, Fernandez M, Slocum P, et al. Allopatric tuberculosis host–pathogen relationships are associated with greater pulmonary impairment. Infection, Genetics and Evolution. 2013. Jun;16:433–40. - PMC - PubMed

Publication types