[Preprint]. 2023 Mar 16:2023.03.15.532836.
doi: 10.1101/2023.03.15.532836.

Bipartite invariance in mouse primary visual cortex

Affiliations

Bipartite invariance in mouse primary visual cortex

Zhiwei Ding et al. bioRxiv. .

Abstract

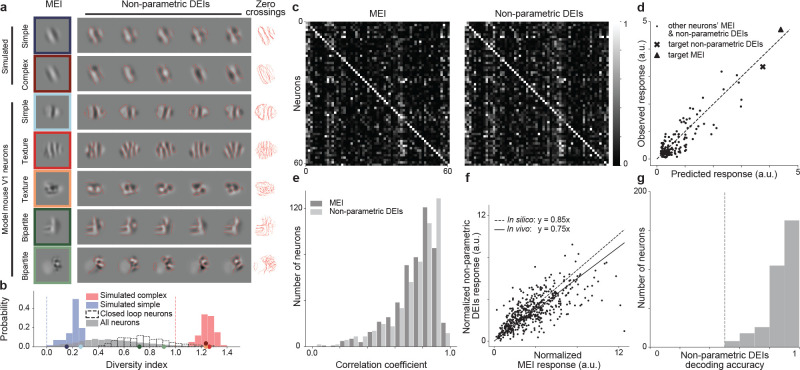
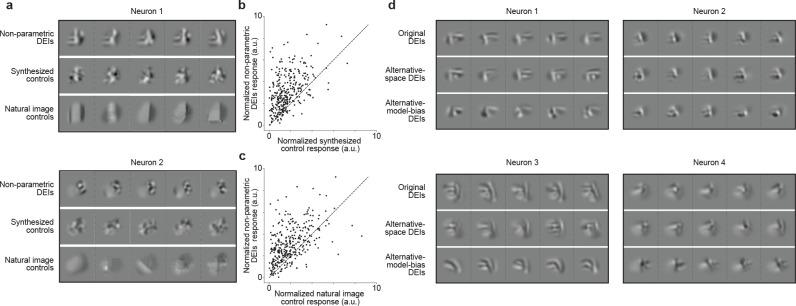
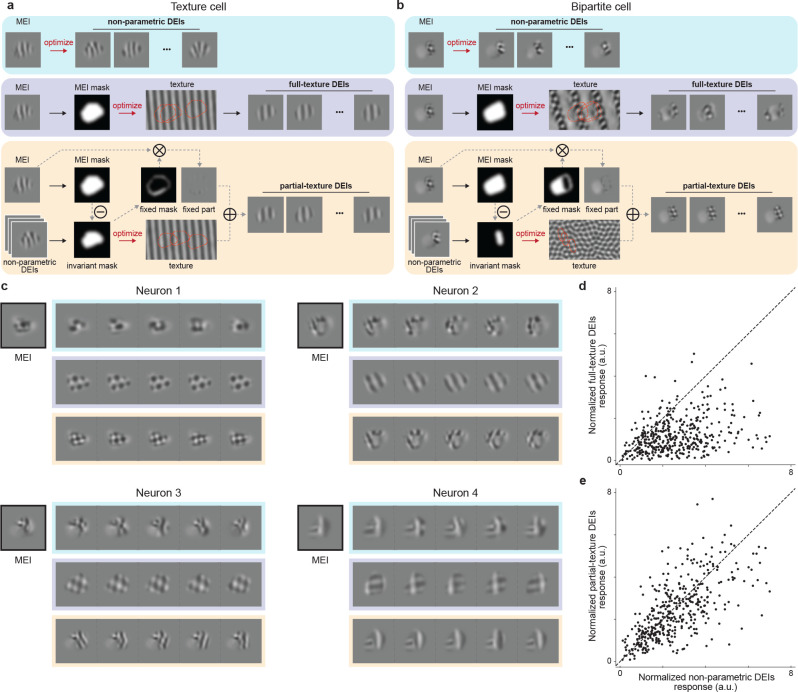
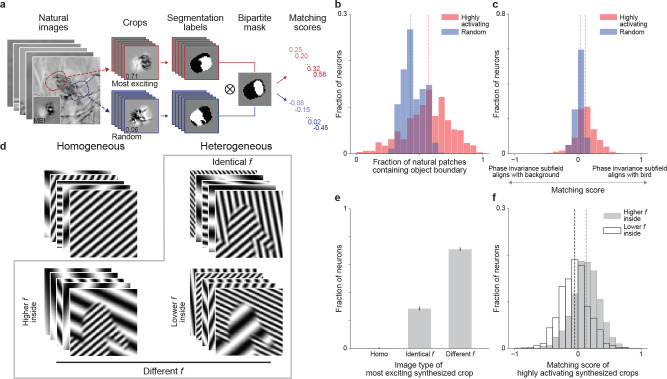
A defining characteristic of intelligent systems, whether natural or artificial, is the ability to generalize and infer behaviorally relevant latent causes from high-dimensional sensory input, despite significant variations in the environment. To understand how brains achieve generalization, it is crucial to identify the features to which neurons respond selectively and invariantly. However, the high-dimensional nature of visual inputs, the non-linearity of information processing in the brain, and limited experimental time make it challenging to systematically characterize neuronal tuning and invariances, especially for natural stimuli. Here, we extended "inception loops" - a paradigm that iterates between large-scale recordings, neural predictive models, and in silico experiments followed by in vivo verification - to systematically characterize single neuron invariances in the mouse primary visual cortex. Using the predictive model we synthesized Diverse Exciting Inputs (DEIs), a set of inputs that differ substantially from each other while each driving a target neuron strongly, and verified these DEIs' efficacy in vivo. We discovered a novel bipartite invariance: one portion of the receptive field encoded phase-invariant texture-like patterns, while the other portion encoded a fixed spatial pattern. Our analysis revealed that the division between the fixed and invariant portions of the receptive fields aligns with object boundaries defined by spatial frequency differences present in highly activating natural images. These findings suggest that bipartite invariance might play a role in segmentation by detecting texture-defined object boundaries, independent of the phase of the texture. We also replicated these bipartite DEIs in the functional connectomics MICrONs data set, which opens the way towards a circuit-level mechanistic understanding of this novel type of invariance. Our study demonstrates the power of using a data-driven deep learning approach to systematically characterize neuronal invariances. By applying this method across the visual hierarchy, cell types, and sensory modalities, we can decipher how latent variables are robustly extracted from natural scenes, leading to a deeper understanding of generalization.


Figures

Fig. 1.
Fig. 1.. Deep neural network well captures mouse V1 responses to natural scenes.
a, Illustration of the optimization of Most Exciting Inputs (MEI) and Diverse Exciting Inputs (DEIs).The vertical axes represent the activation of a model neuron with no obvious invariance (left) and another model neuron with phase invariance to its optimal stimulus (right) as a function of two example image dimensions. The black curves depict optimization trajectories of the same MEI (left) starting from different initializations and of the DEIs (right) as different perturbations starting from the MEI along the invariance ridge. b, Schematic of the inception loop paradigm. On day 1, we presented sequences of natural images and recorded in vivo neuronal activity using two-photon calcium imaging. Overnight, we trained an ensemble of CNNs to reproduce the measured neuronal responses and synthesized artificial stimuli for each target neuron in silico . On day 2, we showed these stimuli back to the same neurons in vivo to compare the measured and the predicted responses. c, We presented 5,100 unique natural images to an awake mouse for 500 ms, interleaved with gray screen gaps of random length between 300 and 500 ms. A subset of 100 images was repeated 10 times each to estimate the reliability of neuronal responses. Neuronal activity was recorded at 8 Hz in V1 L2/3 using a wide-field two-photon microscope. Behavioral traces including pupil dilation and locomotion velocity were also recorded. d, Schematic of the CNN model architecture. Our network consists of a 3-layer convolutional core followed by a single-point readout predicting neuronal responses, a shifter network accounting for eye movements, and a behavior modulator predicting an adaptive gain for each neuron (10, 12). Traces on the right show average responses (gray) to test images of two example neurons and corresponding model predictions (black). e, Normalized correlation coefficient (CCnorm, see Methods) (14) between measured and predicted responses to test images for all 22,083 unique neurons across 10 mice selected for MEI and DEIs generation, a metric measuring the fraction of variation in neuronal responses to identical stimuli accounted for by the model prediction(median = 0.71 as indicated by the dashed line). Neurons with CCmax smaller than 0.1 (0.31%) were excluded and CCnorm larger than 1 (1.19%) were clipped to 1 in the histogram.
Fig. 2.
Fig. 2.. Non-parametric DEIs evoked strong and selective responses in target neurons while containing perceivable differences.
a, Examples of MEI and non-parametric DEIs for simulated simple and complex cells and model mouse V1 neurons. Zero crossing contours from individual DEIs are overlaid for easier comparison of the spatial pattern across the images. While DEIs strongly resemble the MEI, they exhibit complex features different from the MEI and also among themselves. We observed 2 types of novel invariances: global phase invariance (texture) and local phase invariance (bipartite). b, Diversity indexes for 60 simulated complex cells (red), 60 simulated simple cells (blue), and 6464 model V1 neurons (gray), 617 among which we tested in closed-loop experiments (unfilled). The expected diversity index of a noiseless simple cell (blue dashed line) and a noiseless complex cell (red dashed line) are shown for reference. Example neurons from a were indicated on the x axis with the corresponding colors. c, Both MEI and DEIs activated neurons with high specificity. The confusion matrices show the responses of each neuron to MEI (left) and DEIs (right) of 61 neurons in mouse 3. MEI response was averaged across 20 repeats of the same image while DEIs response was averaged across 20 different images with single repeat each. The responses of each neuron were normalized, and each row was scaled so the maximum response across all images equals 1. Responses of neurons to their own MEI and DEIs (along the diagonal) were larger than those to other MEIs and DEIs respectively (one-sided permutation test, P < 10−9 for both cases). d, Predicted versus observed responses of one example neuron (from mouse 2) to its own MEI and DEIs and 79 other neurons’ MEI and DEIs. e, Pearson correlation coefficients between predicted and observed responses to all the presented MEI and DEIs for all 500 neurons pooled across 8 mice (median = 0.74 for MEI and 0.75 for DEIs). f, Each point corresponds to the normalized response of a single neuron to its MEI and DEIs. The linear relationship between DEIs and MEI responses was estimated by averaging over 1000 repeats of robust linear regression using the RANSAC algorithm (21). DEIs stimulated in vivo closely to the level predicted in silico with respect to MEI (75% versus 85%) (two-sided Wilcoxon signed-rank test, W = 51360, P =4.92 × 10⁻⁴), with only 12.8% of all neurons showing different responses between DEIs and 85% of MEI (P < 0.05, two-tailed Welch’s t-test with 34.4 average d.f.). g, Differences between the most different pair of DEIs in pixel space are distinguishable by the mouse V1 population. Logistic regression classifiers were used to decode DEI identity of individual trials from V1 population responses. Decoding accuracies across neurons (median=0.9) were higher than chance level (0.5 as indicated by the dashed line) (one sample t-test, t = 70.1,P < 10−9). Data were pooled over 320 neurons from 4 mice.
Fig. 3.
Fig. 3.. DEIs evoked stronger responses than synthesized and natural control stimuli in target neurons and generalized across different synthesis conditions.
a, Examples of non-parametric DEIs (top), synthesized controls (middle), and natural controls (bottom) for 2 neurons. Synthesized controls were generated by perturbing the MEI in random directions while natural controls were found by searching through random natural patches. Both natural and synthesized controls were restricted to be strictly closer to the MEI in pixel space than all DEIs. b-c, Each point corresponds to the normalized activity of a single neuron in response to its DEIs versus its synthesized controls (b) or natural (c) controls. Response to each stimulus type was averaged over 20 different images with single-repeat. DEIs activated their target neurons stronger than their corresponding synthesized (one-sided Wilcoxon signed-rank test, W = 3258, P < 10−9) and natural image controls (one-sided Wilcoxon signed-rank test, W = 6442, P < 10−9) with 47.2% and 41.0% of all neurons showing greater response to DEIs respectively (P < 0.05, one-tailed Welch’s t-test with 30.4 and 31.1 average d.f., respectively). Data were pooled over 318 neurons from 5 mice. d, Examples of non-parametric DEIs synthesized with diversity evaluated as Euclidean distance in pixel space (top), or as Pearson correlation in in silico population responses (middle), or using a predictive model of different architecture and trained on different stimulus domain (bottom).
Fig. 4.
Fig. 4.. Partial-texture DEIs activated target neurons similarly as non-parametric DEIs.
a-b, Schematic of non-parametric (DEIs), full-texture (DEIsfull), and partial-texture (DEIs partial) DEIs synthesis for an example texture cell (left) and an example bipartite cell (right). DEIsfull were synthesized by optimizing an underlying texture canvas from which uniformly sampled cropped by the MEI mask maximally activate the target neuron. In contrast, DEIspartial are composed of two non-overlapping subfields: a fixed one masked directly from the MEI, and a phase invariant one synthesized similarly to DEIsfull except that the mask used for texture optimization is only part of MEI mask. c, MEI, DEIs, DEIsfull, and DEIspartial of 4 example neurons, with each type of DEIs indicated by the corresponding color in a. DEIspartial visually resembles non-parametric DEIs for most neurons while DEIsfull captures non-parametric DEIs only for texture-like neurons. d-e, Normalized responses to DEIsfull (d) and DEIspartial (e) responses versus non-parametric DEIs. Each point corresponds to the normalized activity of a single neuron, averaged over 20 different images with single repeat. d, DEIsfull failed to stimulate their target neurons compared to non-parametric DEIs (one-sided Wilcoxon signed-rank test, W = 4389, P < 10−9) with 52.9% of all neurons showing lower responses to DEIsfull (P < 0.05, one-tailed Welch’s t-test with 29.4 average d.f.). e, DEIspartial activated their target neurons similarly to non-parametric DEIs (two-sided Wilcoxon signed-rank test, W = 32429, P = 7.01 × 10⁻⁴) with only 8.7% of all neurons showing different responses (P < 0.05, two-tailed Welch’s t-test with 33.5 average d.f.). Data were pooled over 8 mice, displaying a total of 401 neurons.
Fig. 5.
Fig. 5.. Invariant and fixed subfields detect object boundaries defined by spatial frequency differences
a, We standardized and passed 1 million crops from the Caltech-UCSD Birds-200–2011 (CUB) data set through our predictive model to find the 100 most highly activating (red) and 100 random (blue) crops with their corresponding manual segmentation labels for each neuron. Then for each crop, we computed a matching score based on the segmentation label and the target neuron’s bipartite mask identified by DEIspartial. A score of 1 indicates perfect matching between the phase invariant subfield and bird content (white to white) within the RF while a score of −1 indicates the opposite. b, Highly activating natural crops were more likely to contain object boundaries compared to randomly crops (one-sided Wilcoxon signed-rank test, W = 472123, P < 10−9, for more details see Methods). c, Highly activating CUB crops yielded median matching scores that were positive (one-tailed one sample t-test, t = 21.4, P < 10−9) and higher than those for random natural crops (one-sided Wilcoxon signed-rank test, W = 597254, P < 10−9) with 59.25% of all neurons showing greater matching to highly activating crops than to random crops (P < 0.05, one-tailed Welch’s t-test with 186.4 average d.f.). d, We constructed a parametric data set termed “CUB-grating” using four different image types: (1) homogeneous stimuli containing single gratings (2 millions), (2) heterogeneous stimuli with boundaries borrowed from the CUB data set, but the bird and the background were replaced with either identical frequency (2 millions), (3) higher frequencies within inside the bird (1 million), or (4) higher frequencies outside of the bird (1 million). All images in the data set were synthesized with independent uniformly sampled orientations and phases, with identical mean and contrast. Additionally, we used a Gaussian filter to blur the boundaries between birds and backgrounds to avoid edge artifacts. e, In the CUB-grating data set, neurons preferred heterogeneous crops with frequency differences (71.08%) more than crops with identical frequency (28.58%) or crops with homogeneous signals (0.34%) (one-way chi-squared test, χ2 = 913.2, P < 10−9; one-sided test using bootstrapping, P < 10−9 for both comparisons). Error bars were bootstrapped STD. f, Highly activating CUB-grating crops with higher frequency inside the bird yielded positive median matching scores (one-tailed one sample t-test, t = 18.5, P < 10−9) while those with lower frequency inside the bird yield negative median matching scores (one-tailed one sample t-test, t = −8.7, P < 10−9). Remarkably, the matching scores between highly activating CUB-grating crops with higher frequency inside the bird and highly activating CUB crops were not significantly different (two-sided Wilcoxon signed-rank test, W = 347557, P = 0.82). Responses were normalized by the corresponding MEI activation. Data were pooled over 6 mice, displaying a total of 1200 neurons.

References

    1. Gross Charles G, de Rocha-Miranda CE, and Bender DB. Visual properties of neurons in inferotemporal cortex of the macaque. Journal of neurophysiology, 35(1):96–111, 1972. - PubMed
    1. Tsao Doris Y, Freiwald Winrich A, Tootell Roger BH, and Livingstone Margaret S. A cortical region consisting entirely of face-selective cells. Science, 311(5761):670–674, 2006. - PMC - PubMed
    1. Yamins Daniel LK and DiCarlo James J. Using goal-driven deep learning models to understand sensory cortex. Nature neuroscience, 19(3):356–365, 2016. - PubMed
    1. Cadieu Charles, Kouh Minjoon, Pasupathy Anitha, Connor Charles E, Riesenhuber Maximilian, and Poggio Tomaso. A model of v4 shape selectivity and invariance. Journal of neurophysiology, 98(3):1733–1750, 2007. - PubMed
    1. Sharpee Tatyana O, Kouh Minjoon, and Reynolds John H. Trade-off between curvature tuning and position invariance in visual area v4. Proceedings of the National Academy of Sciences, 110(28):11618–11623, 2013. - PMC - PubMed

Publication types