[Preprint]. 2023 Mar 25:2023.03.25.534211.
doi: 10.1101/2023.03.25.534211.

Inducible protein degradation as a strategy to identify Phosphoprotein Phosphatase 6 substrates in RAS-mutant colorectal cancer cells

Affiliations

Inducible protein degradation as a strategy to identify Phosphoprotein Phosphatase 6 substrates in RAS-mutant colorectal cancer cells

Natasha C Mariano et al. bioRxiv. .

Update in

Abstract

Protein phosphorylation is an essential regulatory mechanism that controls most cellular processes, including cell cycle progression, cell division, and response to extracellular stimuli, among many others, and is deregulated in many diseases. Protein phosphorylation is coordinated by the opposing activities of protein kinases and protein phosphatases. In eukaryotic cells, most serine/threonine phosphorylation sites are dephosphorylated by members of the Phosphoprotein Phosphatase (PPP) family. However, we only know for a few phosphorylation sites which specific PPP dephosphorylates them. Although natural compounds such as calyculin A and okadaic acid inhibit PPPs at low nanomolar concentrations, no selective chemical PPP inhibitors exist. Here, we demonstrate the utility of endogenous tagging of genomic loci with an auxin-inducible degron (AID) as a strategy to investigate specific PPP signaling. Using Protein Phosphatase 6 (PP6) as an example, we demonstrate how rapidly inducible protein degradation can be employed to identify dephosphorylation SITES and elucidate PP6 biology. Using genome editing, we introduce AID-tags into each allele of the PP6 catalytic subunit (PP6c) in DLD-1 cells expressing the auxin receptor Tir1. Upon rapid auxin-induced degradation of PP6c, we perform quantitative mass spectrometry-based proteomics and phosphoproteomics to identify PP6 substrates in mitosis. PP6 is an essential enzyme with conserved roles in mitosis and growth signaling. Consistently, we identify candidate PP6c-dependent phosphorylation sites on proteins implicated in coordinating the mitotic cell cycle, cytoskeleton, gene expression, and mitogen-activated protein kinase (MAPK) and Hippo signaling. Finally, we demonstrate that PP6c opposes the activation of large tumor suppressor 1 (LATS1) by dephosphorylating Threonine 35 (T35) on Mps One Binder (MOB1), thereby blocking the interaction of MOB1 and LATS1. Our analyses highlight the utility of combining genome engineering, inducible degradation, and multiplexed phosphoproteomics to investigate signaling by individual PPPs on a global level, which is currently limited by the lack of tools for specific interrogation.


Figures

Figure 1:
Figure 1:. Effects of AID tag variants on PP6c activity in vitro.
A) Schematic displaying the mechanism of degradation by the Auxin Inducible Degron (AID) system. Upon the addition of IAA, rapid and targeted proteasomal degradation of the AID-tagged PP6c protein occurs via recruitment of the SCF ubiquitin ligase complex. B) Diagram of all AID tag variants. C) Quantification of phosphatase activity of 3xFLAG-PP6c when fused to the different AID tag variants. D) Quantification of phosphatase activity of 3xFLAG-PP6c compared to 3xFLAG-PP6c fused to the AID short tag variant (sAID). E) Scatter plot of log2 protein intensities quantified in 3xFLAG-PP6c and 3xFLAG-sAID-PP6c protein AP-MS experiments. PP6c and known PP6c interactors are shown in purple.
Figure 2:
Figure 2:. Endogenous tagging of PPP6c genomic loci in DLD-1 cells.
A) Schematic depicting the PPP6c genomic alleles in DLD-1 cells upon homologous recombination with the targeting constructs. From left to right: left homology arm (light grey) consisting of the 5'UTR, a resistance marker (white), P2A ribosomal skip site (cyan), 3xFLAG tag (magenta), the sAID tag (orange), and the right homology arm consisting of Exon 1 (dark grey) and the beginning of Intron 1 (light grey). B) Agarose gel analysis of genomic PCRs for the PPP6c loci in wild-type (WT) and homozygously tagged 3x-FLAG-sAID-PP6c DLD-1 cells. We will refer to these cells from here on as AID-PP6c DLD-1s and to the tagged protein as AID-PP6c. C) Western blot analysis of endogenous PP6c protein in WT and AID-PP6c DLD-1 cells. D) Top: Western blot analysis of time course experiment demonstrating inducible degradation of AID-PP6c protein upon addition of IAA. Bottom: Quantification of AID-PP6c protein abundance overtime. Data are presented as means ± standard deviations from three independent experiments. The AID-PP6c protein half-life was calculated by fitting exponential regressions to the averages from triplicate quantifications.
Figure 3:
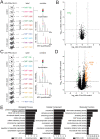
Figure 3:. Quantitative proteomics and phosphoproteomics reveal potential PP6c substrate dephosphorylation sites.
A) Workflow for TMT multiplex proteomic analysis of mitotic AID-PP6c DLD-1 cells wherein, three channels were assigned to control conditions (n=3), four channels to 2 hours IAA treatment conditions (n=4), and three channels to 4 hours IAA treatment conditions (n=3). B) Volcano plot of the log2 ratio fold-change of proteins identified and quantified in the 2-hour IAA treated versus untreated cells. The vertical lines represent fold-change cutoffs of −1 and 1, the horizontal line represents a significance cutoff of a p-value of 0.05, and each dot represents one protein. PP6c is indicated in green. C) Workflow for TMT multiplex phosphoproteomic analysis of mitotic AID-PP6c DLD-1 cells wherein four channels were assigned to control conditions (n=4), four channels to 2 hours IAA treatment conditions (n=4), and three channels to 4 hours IAA treatment conditions (n=3). D) Volcano plot, showing the log2 ratio fold-change of phosphorylation sites identified and quantified in the 2 hours IAA treated versus untreated cells. The vertical lines represent fold-change cutoffs of −0.6 and 0.6, the horizontal line represents a significance cutoff of a p-value of 0.05, and each dot represents a phosphorylation site. Significantly increased phosphorylation sites are highlighted in orange, while decreased sites are shown in green E) Top 10 categories from gene ontology analysis of proteins with significantly upregulated phosphorylation sites as input.
Figure 4:
Figure 4:. MOB1 T35 phosphorylation is regulated by PP6c activity.
A) Top left: Western blot analysis of the abundance of AID-PP6c protein and MOB1 T35 phosphorylation in untreated versus IAA-treated AID-PP6c DLD-1 cells, with β-actin used as a loading control. Bottom left: Quantification of MOB1 T35 phosphorylation relative to the β-actin control. Top right: Western blot analysis of the abundance of AID-PP6c and MOB1 protein in untreated versus IAA-treated AID-PP6c DLD-1 cells, with β-actin used as a loading control, using the same lysates as on the left. Bottom right: Quantification of MOB1 total protein relative to the β-actin control. For both bar graphs, data are presented as means ± SD using lysates from the same three independent experiments, and individual data points are indicated. *p < 0.05, ns – not significant by Student's t-test. B) Top: Western blot analysis of an in vitro dephosphorylation assay using affinity-isolated PP6c holoenzyme incubated with affinity-purified phosphorylated MOB1 (pMOB1) in either the presence or absence of 1 μM calyculin A inhibitor (CalA). Bottom: Quantification of MOB1 T35 phosphorylation relative to the level of MOB1 total protein. On the x-axis: "M" is pMOB1 only, "M+P" is pMOB1 combined with active PP6 holoenzyme and "M+P+C" is pMOB1 combined with PP6 plus the addition of CalA. Data are presented as means ± SD from three independent experiments, and individual data points are indicated. *p < 0.05, ns – not significant by Fisher's exact t-test. C) Left: Western blot analysis of input and affinity-purified MOB1 and its downstream interactor LATS1 in untreated compared to IAA treated AID-PP6c DLD-1 cells exogenously expressing twin-Strep-tagged MOB1. Right: Quantification of LATS1 abundance relative to the amount of MOB1 that was pulled down. Data are presented as means ± SD from three independent experiments, and individual data points are indicated. *p < 0.05, ns – not significant by Student t-test. D) Representative diagram showing a proposed model for PP6c's negative regulation of the Hippo Pathway's core signaling cascade.

References

    1. Sharma K., D’Souza R. C., Tyanova S., Schaab C., Wisniewski J. R., Cox J., and Mann M. (2014) Ultradeep human phosphoproteome reveals a distinct regulatory nature of Tyr and Ser/Thr-based signaling. Cell Rep. 8, 1583–1594 - PubMed
    1. Hornbeck P. v., Kornhauser J. M., Latham V., Murray B., Nandhikonda V., Nord A., Skrzypek E., Wheeler T., Zhang B., and Gnad F. (2019) 15 years of PhosphoSitePlus ® : Integrating post-translationally modified sites, disease variants and isoforms. Nucleic Acids Res. 47, 433–441 - PMC - PubMed
    1. Damle N. P., and Köhn M. (2019) The human DEPhOsphorylation Database DEPOD: 2019 update. Database (Oxford). baz133, 1–7 - PMC - PubMed
    1. Brautigan D. L. (2013) Protein Ser/Thr phosphatases--the ugly ducklings of cell signalling. FEBS J. 280, 324–345 - PubMed
    1. Brautigan D. L., and Shenolikar S. (2018) Protein Serine/Threonine Phosphatases: Keys to Unlocking Regulators and Substrates. Annu Rev Biochem. 87, 921–964 - PubMed

Publication types