[Preprint]. 2023 Aug 19:2023.03.13.532469.
doi: 10.1101/2023.03.13.532469.

Aversive experience drives offline ensemble reactivation to link memories across days

Affiliations

Aversive experience drives offline ensemble reactivation to link memories across days

Yosif Zaki et al. bioRxiv. .

Update in

  • Offline ensemble co-reactivation links memories across days.
    Zaki Y, Pennington ZT, Morales-Rodriguez D, Bacon ME, Ko B, Francisco TR, LaBanca AR, Sompolpong P, Dong Z, Lamsifer S, Chen HT, Carrillo Segura S, Christenson Wick Z, Silva AJ, Rajan K, van der Meer M, Fenton A, Shuman T, Cai DJ. Zaki Y, et al. Nature. 2025 Jan;637(8044):145-155. doi: 10.1038/s41586-024-08168-4. Epub 2024 Nov 6. Nature. 2025. PMID: 39506117 Free PMC article.

Abstract

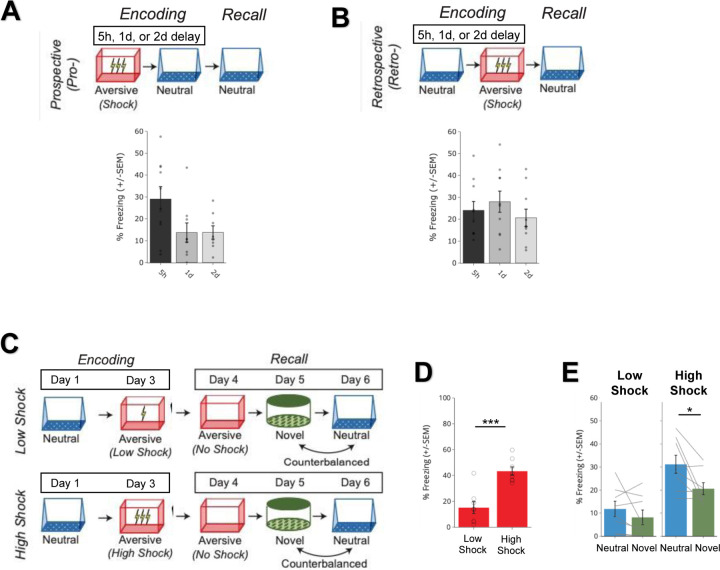
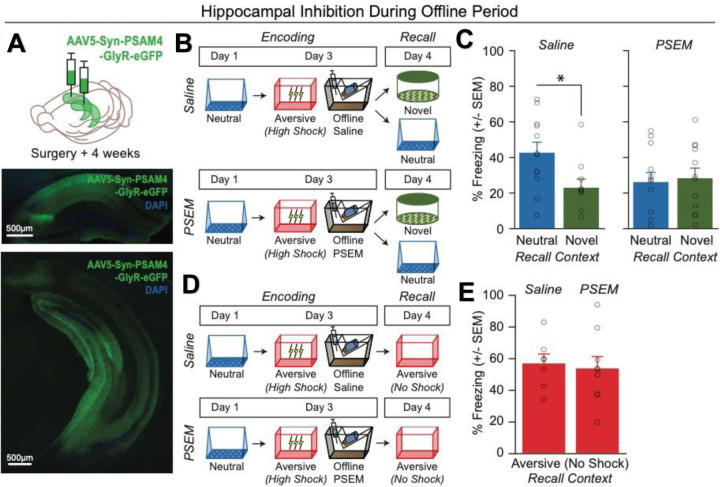
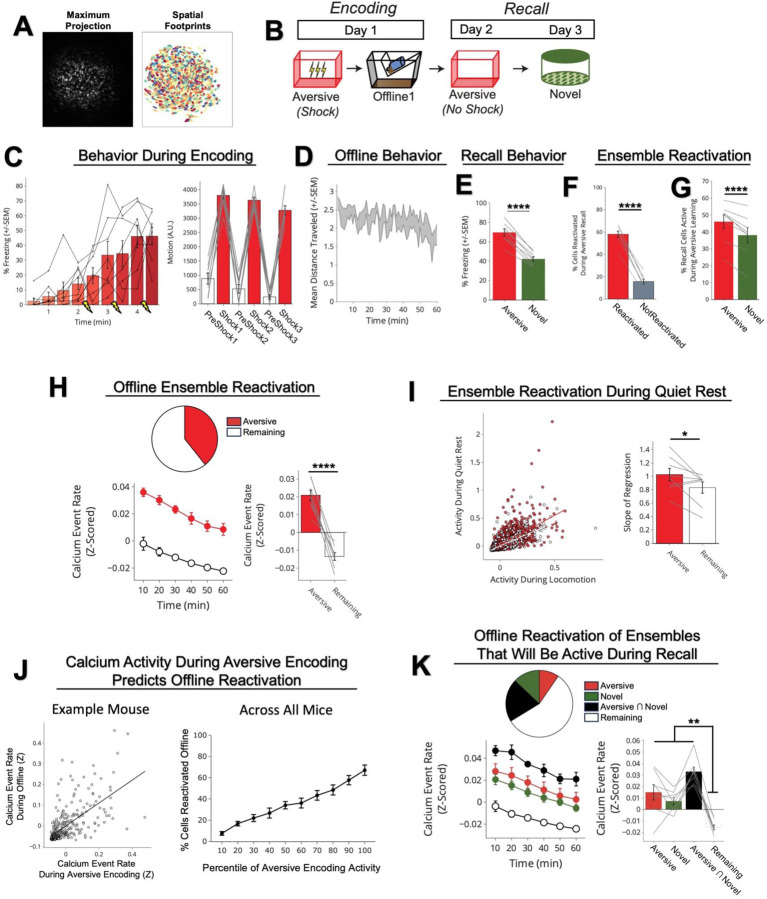
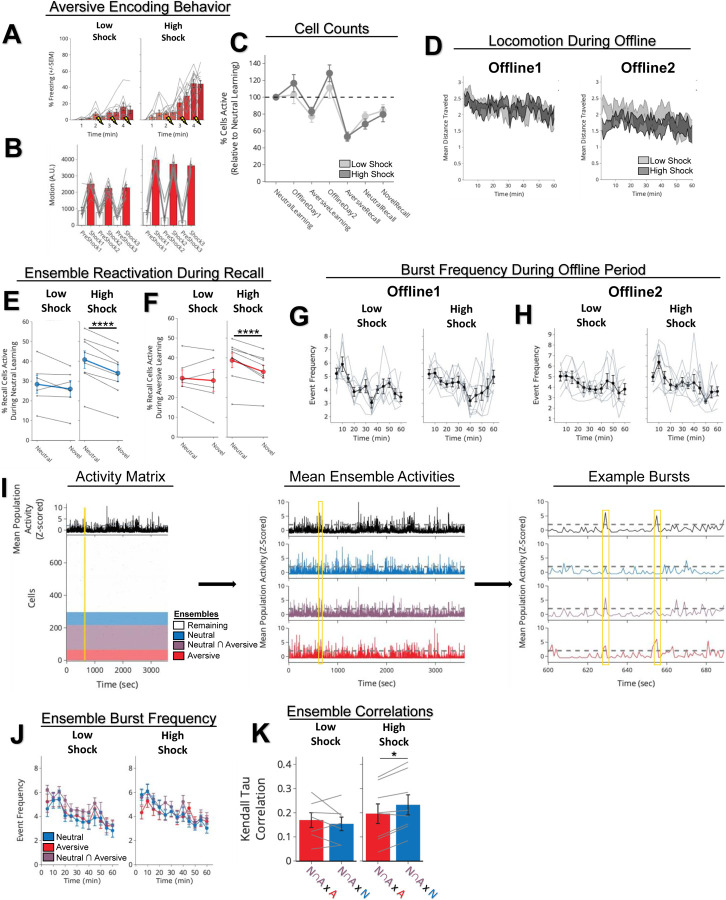
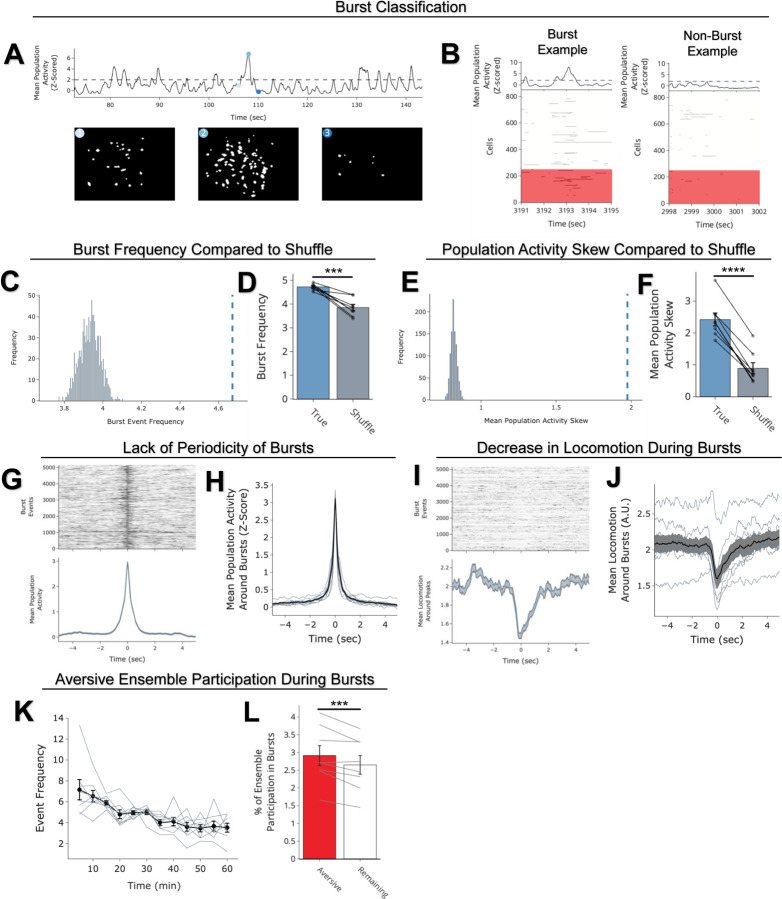
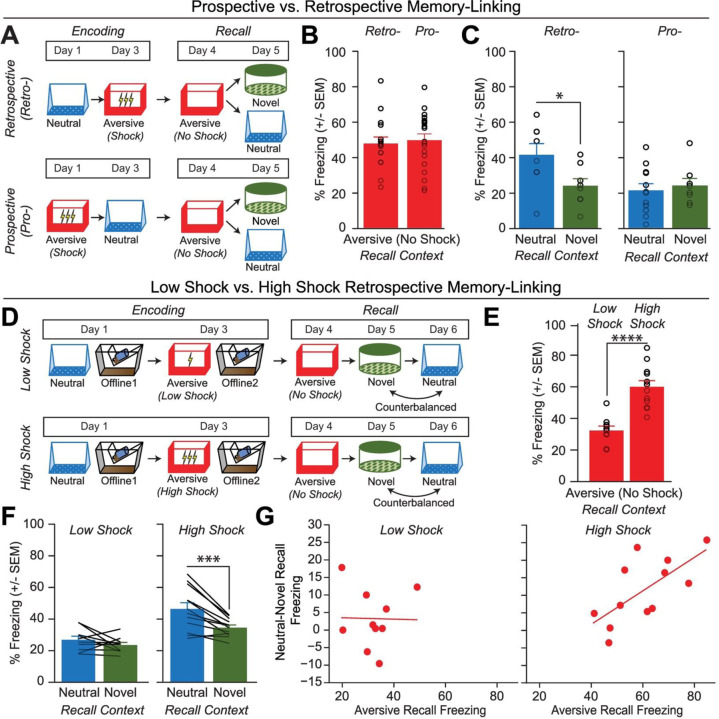
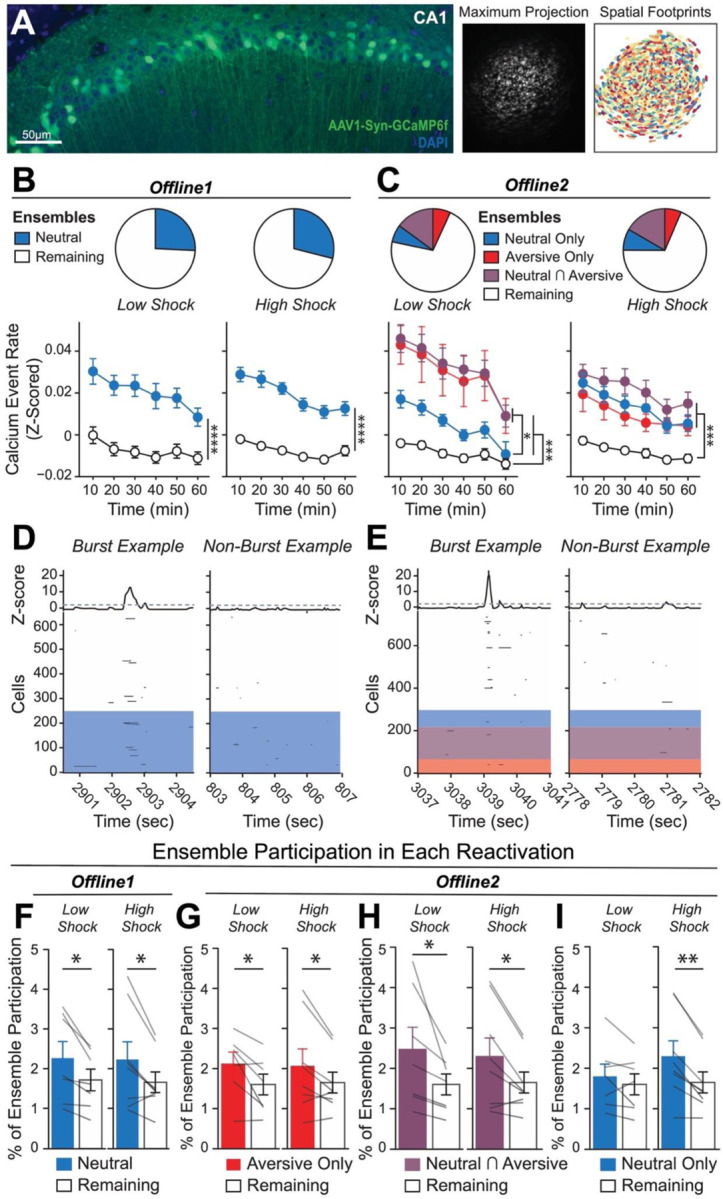
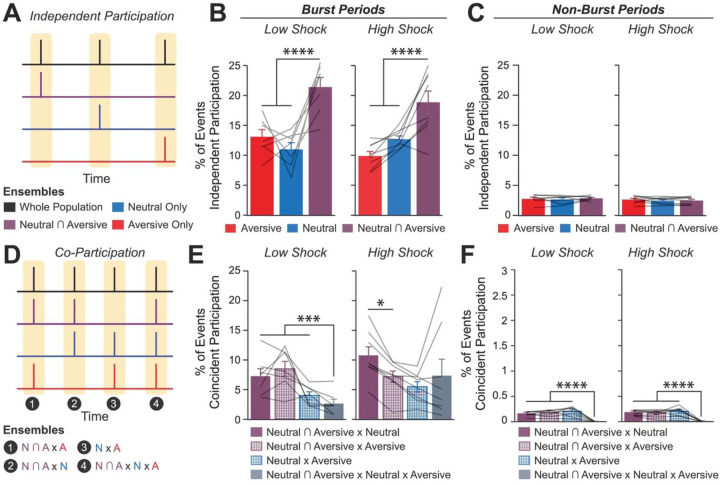
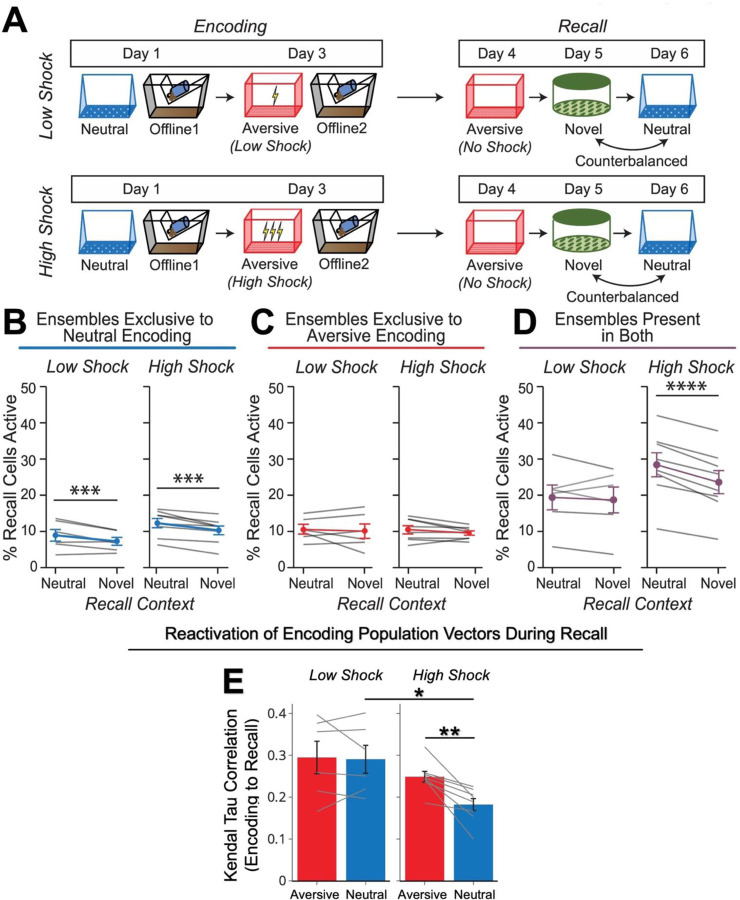
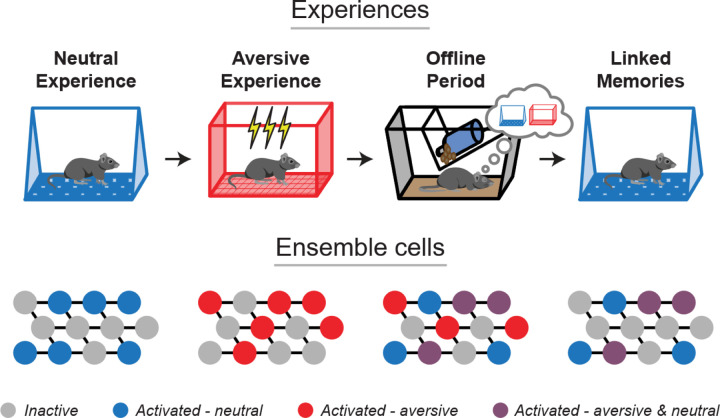
Memories are encoded in neural ensembles during learning and stabilized by post-learning reactivation. Integrating recent experiences into existing memories ensures that memories contain the most recently available information, but how the brain accomplishes this critical process remains unknown. Here we show that in mice, a strong aversive experience drives the offline ensemble reactivation of not only the recent aversive memory but also a neutral memory formed two days prior, linking the fear from the recent aversive memory to the previous neutral memory. We find that fear specifically links retrospectively, but not prospectively, to neutral memories across days. Consistent with prior studies, we find reactivation of the recent aversive memory ensemble during the offline period following learning. However, a strong aversive experience also increases co-reactivation of the aversive and neutral memory ensembles during the offline period. Finally, the expression of fear in the neutral context is associated with reactivation of the shared ensemble between the aversive and neutral memories. Taken together, these results demonstrate that strong aversive experience can drive retrospective memory-linking through the offline co-reactivation of recent memory ensembles with memory ensembles formed days prior, providing a neural mechanism by which memories can be integrated across days.

Keywords: PTSD; co-firing; ensemble; hippocampus; memory integration; memory-linking; offline periods; reactivation; stress.


Conflict of interest statement

Competing Interests The authors declare no competing interests.

Figures

Extended Figure 1.
Extended Figure 1.. Behavioral experiment controls.
A) Schematic to test the timecourse of prospective memory-linking (top). Mice underwent Aversive encoding and then either 5h, 1d, or 2d later they underwent Neutral encoding. The following day, mice were tested in the previously experienced Neutral context. Mice froze significantly more in the Neutral context when the Neutral context occurred within 5h of the Aversive context, compared to when it occurred one day or more after Aversive encoding (bottom). Main effect of timepoint (F2,24 = 3.689, p = 0.04) (5h, N = 10 mice; 1d, N = 9 mice; 2d, N = 8 mice). Post-hoc tests revealed a trend for higher freezing in the 5h timepoint compared to the 1d or 2d timepoints: 1d (t16.38 = 2.137, p = 0.07), 2d (t13.45 = 2.38, p = 0.07). B) Schematic to test the timecourse of retrospective memory-linking (top). Mice underwent Neutral encoding, followed by Aversive encoding in a separate context 5h, 1d, or 2d later. The day following Aversive encoding, they were tested in the previously experienced Neutral context. Mice froze no differently in the Neutral context regardless of how long before Aversive encoding the Neutral context was experienced (bottom). No main effect of timepoint (F2,27 = 0.73, p = 0.49) (5h, N = 10 mice; 1d, N = 10 mice; 2d, N = 10 mice). C) Schematic of low vs high shock retrospective memory-linking experiment (without calcium imaging as a replication). Mice underwent Neutral encoding followed by a low or high shock Aversive encoding two days later. In the subsequent 3 days, mice were tested in the Aversive context, and then Neutral and Novel contexts, counterbalanced. D) Mice froze more in the Aversive context in High Shock vs Low Shock mice (t14 = 5.04, p = 0.00018) (Low Shock, N = 8 mice; High Shock, N = 8 mice). E) High Shock mice exhibited higher freezing in Neutral vs Novel recall, while Low Shock mice did not. A priori post-hoc test: High Shock (t7 = 2.65, p = 0.033), Low Shock (t7 = 1.21, p = 0.133) (Low Shock, N = 8 mice; High Shock N = 8 mice).
Extended Figure 2.
Extended Figure 2.. Offline hippocampal activity is necessary to drive retrospective memory-linking
A) Representative histological verification of viral expression in dorsal and ventral hippocampus. Blue represents DAPI and green represents AAV5-Syn-PSAM-GFP. B) Schematic of the behavioral experiment disrupting hippocampal activity during the offline period. Mice were injected with AAV5-Syn-PSAM-GFP into dorsal and ventral hippocampus. Mice all had a Neutral experience and two days later a strong Aversive experience. Right after Aversive encoding, mice either had the hippocampus inactivated for 12hrs using the PSAM agonist, PSEM, or were given saline as a control. To do this, mice were injected four times, every three hours, to extend the manipulation across a 12-hour period. Two days later, mice were tested in the Neutral or a Novel context for freezing. C) Control (saline-treated) mice displayed retrospective memory-linking (i.e., higher freezing during Neutral vs Novel recall), while mice that received hippocampal inhibition (PSEM-treated) no longer displayed retrospective memory-linking. Significant interaction between Experimental Group (PSEM vs Sal) and Context (Neutral vs Novel) (F1,42 = 4.00, p = 0.05) (Saline Neutral, N = 12 mice; Saline Novel, N = 10 mice; PSEM Neutral, N = 12 mice; PSEM Novel, N = 12 mice). Post-hoc tests demonstrate higher freezing in Neutral vs Novel contexts in the Sal group (t19.84 = 2.57, p = 0.03) and no difference in freezing in Neutral vs Novel contexts in the PSEM group (t22 = 0.31, p = 0.76). D) Schematic of the behavioral experiment as above, but this time to test the effects of hippocampal inactivation on Aversive memory recall. Mice all underwent the Neutral and Aversive experiences as before, as well as PSEM or saline injections following Aversive encoding (as in Extended Figure 2B); however, two days following Aversive encoding, mice were tested in the Aversive context to test for an intact aversive memory. E) Mice froze no differently in the Aversive context whether they had received hippocampal inhibition or not (t13.9 = 0.32, p = 0.748) (Saline, N = 7 mice; PSEM, N = 9 mice).
Extended Figure 3.
Extended Figure 3.. Neurons active during Aversive encoding are selectively reactivated offline and during Aversive recall.
A) Representative maximum intensity projection of the field-of-view of one example session (left). Spatial footprints of all recorded cells during the session, randomly color-coded (right). B) Schematic of a single aversive experience. Mice had an Aversive experience followed by a 1hr offline session in the homecage. The next day, mice were tested in the Aversive context, followed by a test in a Novel context one day later. Calcium imaging in hippocampal CA1 was performed during all sessions. C) Mice acquired within-session freezing during Aversive encoding (left); main effect of time (F8,56 = 12.59, p = 3.87e-10, N = 8 mice). And mice responded robustly to all three foot shocks, though their locomotion generally decreased across shocks, driven by increased freezing (right); main effect of shock number (F2,14 = 7.45, p = 0.0154, N = 8 mice) and main effect of PreShock vs Shock (F1,7 = 581, p = 5.38e-8, N = 8 mice), and no interaction. D) Mice displayed a modest decrease in locomotion across the 1hr offline period (R2 = 0.064, p = 1.9e-8, N = 8 mice). E) Mice froze significantly more in the Aversive context than in a Novel context during recall (t7 = 165, p = 4e-6, N = 8 mice). F) Cells that were active during Aversive encoding and reactivated offline were significantly more likely to be reactivated during Aversive recall than cells active during Aversive encoding and not reactivated offline (t7 = 19.41, p = 2e-7, N = 8 mice). G) A larger fraction of cells active during Aversive recall than during Novel recall were previously active during Aversive encoding (t7 = 6.897, p = 0.0002, N = 8 mice). H) During the offline period, ~40% of the population was made up of cells previously active during Aversive encoding (top). This Aversive ensemble was much more highly active than the rest of the population during the offline period (bottom; A.U.) (t7 = 8.538, p = 0.00006, N = 8 mice). I) Each cell’s activity was compared during locomotion vs during quiet rest (left; A.U.). A regression line was fit to the cells in the Aversive ensemble and in the Remaining ensemble separately, for each mouse. The Remaining ensemble showed greater activity during locomotion than during quiet rest (i.e., a less positive slope). The Aversive ensemble showed relatively greater activity during quiet rest than locomotion (i.e., a more positive slope) across mice (right) (t7 = 5.76, p = 0.047, N = 8 mice). J) Cells that had high levels of activity (A.U.) during Aversive encoding continued to have high levels of activity during the offline period (example mouse; left). There was a linear relationship between how active a cell was during Aversive encoding and how likely it was to be reactivated during the offline period (all mice; right) (R2 = 0.726, p = 1.25e-23, N = 8 mice). K) During the offline period, cells that would go on to become active during recall were more highly active than the Remaining ensemble during the offline period. The top represents the proportion of each ensemble (legend to its right). The cells that would become active during both Aversive and Novel recall were most highly active (A.U.). There was no difference in activity in the cells that would go on to be active in Aversive or Novel. Main effect of Ensemble (F3,21 = 27.81, p = 1.65e-7, N = 8 mice). Post-hoc tests: for Aversive vs Novel (t7 = 1.33, p = 0.22), for Remaining vs Aversive ∩ Novel (t7 = 11.95, p = 0.000007), for Remaining vs Aversive (t7 = 3.97, p = 0.005), for Remaining vs Novel (t7 = 7.47, p = 0.0001).
Extended Figure 4.
Extended Figure 4.. Low vs High Shock calcium imaging supplementary analyses.
A) Mice acquired within-session freezing during Aversive encoding. Mice that received high shocks (1.5mA) displayed more freezing than mice that received low shocks (0.25mA) (Low Shock, N = 10 mice; High Shock, N = 12 mice). B) Mice responded robustly to each foot shock. High shock mice responded more strongly to each shock than low mice did (Low Shock, N = 10 mice; High Shock, N = 12 mice). C) Relative to the first calcium imaging recording, mice showed comparable fractions of observed cells across the remaining sessions (Low Shock, N = 8 mice; High Shock, N = 10 mice). D) Locomotion across the 1hr offline period after Neutral encoding (Offline1) and after Aversive encoding (Offline2) in Low and High Shock mice. Mice showed decreased locomotion across the offline period on both days. Low Shock mice did not locomote differently from High Shock mice during either offline period (Low Shock, N = 10 mice; High Shock, N = 12 mice). E) In High Shock mice, Neutral recall cells were composed of more Neutral encoding cells being reactivated, compared to Novel recall cells. In Low Shock mice, Neutral recall cells and Novel recall cells were composed of similar fractions of Neutral encoding cells being reactivated. Significant interaction between Context (Neutral vs Novel) and Amplitude (Low vs High Shock) (F1,12 = 6.81, p = 0.022) (Low Shock, N = 6 mice; High Shock, N = 8 mice). Post-hoc tests, Low Shock (t5 = 1.34, p = 0.24), High Shock (t7 = 10.22, p = 0.000037). F) In High Shock mice, Neutral recall cells were composed of more Aversive encoding cells being reactivated, compared to Novel recall cells. In Low Shock mice, Neutral recall cells and Novel recall cells were composed of similar fractions of Aversive encoding cells being reactivated. Significant interaction between Context (Neutral vs Novel) and Amplitude (Low vs High Shock) (F1,12 = 4.75, p = 0.0499) (Low Shock, N = 6 mice; High Shock, N = 8 mice). Post-hoc tests, Low Shock (t5 = 0.59, p = 0.58), High Shock (t7 = 5.46, p = 0.0019). G) During Offline1, burst event frequency gradually decreased across the hour (F11,143 = 4.43, p = 1.0e-5). No difference across shock amplitudes (F11,13 = 0.31, p = 0.587) (Low Shock, N = 7 mice; High Shock, N = 8 mice). Significant interaction between Time and Amplitude (F11,143 = 1.87, p = 0.047). Follow-up repeated measures ANOVAs showed that both Low and High Shock groups showed a significant decrease in event rate across time (Low Shock: F11,66 = 4.13, p = 0.0001; High Shock: (F11,77 = 2.43, p = 0.01). H) During Offline2, burst event frequency decreased across time (F11,143 = 6.69, p = 0.000054). No difference across shock amplitudes (F1,13 = 0.0056, p = 0.94) (Low Shock, N = 7 mice; High Shock, N = 8 mice). I) Example process of identifying ensemble co-participations during bursts. Data in this panel are down-sampled from 30Hz to 1Hz for visualization purposes. On the left, the bottom matrix represents the neuronal activities for all neurons recorded across the offline period, color-coded by ensemble (see Ensembles legend). The top black trace represents the z-scored mean population activity across the hour. The yellow line represents a time slice of representative bursts (expanded on the right). In the middle, the whole population mean population activity is shown again, with the mean population activity of the Neutral, Neutral ∩ Aversive, and Aversive ensembles shown below. From these population activities, the time periods above threshold for the whole population were considered whole population bursts, and within those, we measured how frequently the other ensembles participated in these bursts. On the right, we zoom into two example whole population bursts in yellow. In the first one, at 629 sec into the recording, the Neutral ∩ Aversive and Aversive ensembles participated, and in the second one, at 655 sec, only the Aversive ensemble participated. J) During Offline2, bursts as defined by each ensemble (rather than by whole population) decreased across the hour, with comparable frequencies across ensembles and amplitudes (Low Shock, N = 7 mice; High Shock, N = 8 mice). K) Time-lagged cross correlations between the N∩A ensemble and the Neutral and Aversive ensembles during the offline period. Each of the three ensembles (N∩A, Neutral, and Aversive) were binned into 120 sec bins. Each time bin of N∩A ensemble activity was cross-correlated with the corresponding time bin of Neutral ensemble and Aversive ensemble activity. Cross-correlations were computed with a maximum time lag of 5 frames (or, ~160ms). For each mouse, the correlations were averaged across all time bins to get an average cross-correlation between the N∩A ensemble and Neutral ensemble (i.e., N∩A x N) and the N∩A ensemble by Aversive ensemble (i.e., N∩A x A). There was a significant interaction between Ensemble Combination and Low vs High Shock group (F1,13 = 6.70, p = 0.02) (Low Shock, N = 7 mice; High Shock, N = 8 mice). Post-hoc tests revealed that in High Shock mice, N∩A x N correlations were higher than N∩A x A correlations (t7 = 3.97, p = 0.01) whereas they were no different in Low Shock mice (t6 = 0.83, p = 0.44).
Extended Figure 5.
Extended Figure 5.. Neurons active during Aversive encoding selectively participate in burst events offline.
A) Example of a burst event quantified in this figure. The top trace represents the z-scored mean population activity within one of the offline recordings. Three timepoints were chosen (overlaid in circles), the middle representing the peak of a burst event, and the timepoints to its left and right representing t-2sec and t+2sec from the peak, respectively. The bottom three matrices represent binarized spatial footprints depicting the spatial footprints of the cells sufficiently active to participate in a burst (z>2). The matrices represent the timepoints of the three datapoints above it, ordered by time. B) Representative process of extracting ensemble participations (one mouse example). The left is an example burst period, with the rows in the heatmap representing the activity of the recorded cells during that session, binarized by z>2 and color-coded by whether they were previously active during Aversive encoding (Aversive ensemble, blue) or if they were not previously active (Remaining ensemble, grey). The black trace above represents the z-scored mean population activity during this period, demonstrating a brief burst in activity accompanied by participation by a significant fraction of neurons. On the right is an example non-burst period, where mean population activity remains below threshold. C) Neuron activities were circularly shuffled 1000 times relative to one another and the mean population activity was re-computed each time. This shuffling method preserved the autocorrelations for each neuron while disrupting the co-firing relationships between neurons. The burst frequency was computed for each of these shuffles to produce a shuffled burst frequency distribution (gray histogram), to which the true burst frequency was compared (blue dotted line). This is an example mouse. D) The mean burst frequency for the shuffled distribution was computed and compared to the true burst frequency for each mouse. True burst frequencies were greater than shuffled burst frequencies in every mouse (t7 = 6.159, p = 0.000463, N = 8 mice), suggesting that during the offline period, hippocampal CA1 neurons fire in a more coordinated manner than would be expected from shuffled neuronal activities. E) As in Extended Figure 5C, neuron activities were shuffled, and mean population was re-computed each time. From this population activity trace, the skew of the distribution was computed. If there were distinct periods where many neurons simultaneously fired, we hypothesized that the true distribution of mean population activity would be more skewed with a strong right tail demonstrating large and brief deflections, compared to shuffled neuronal activities. We computed the skew of each shuffled mean population activity, to produce a distribution (gray histogram), to which the true mean population’s skew was compared (blue dotted line). This is an example mouse. F) The mean skew for the shuffled distribution was computed and compared to the true skew of the mean population activity for each mouse. The true skew was greater than the shuffled skew in every mouse (t7 = 13.36, p = 0.000003, N = 8 mice), supporting the idea that the mean population activity undergoes brief burst-like activations requiring the coordinated activity of groups of neurons. G) Matrix of burst events for an example mouse, stacked along the y-axis and centered on time t=0 (top), and the average mean population activity around each burst event (bottom). H) As in Extended Figure 5G but averaged across all mice. Each thin line represents one mouse, and the thick black line represents the mean across mice with the grey ribbon around it representing the standard error (N = 8 mice). There is no periodicity to when these burst events occur. I) Locomotion of an example mouse during each burst event stacked along the y-axis (top), and the mean locomotion around burst events (bottom). Mice showed a robust and brief slowing down ~1sec before each burst event, before increasing locomotion back up ~2sec later. J) As in Extended Figure 5I but averaged across all mice. Each thin line represents one mouse, and the thick black line represents the mean across mice with the grey ribbon around it representing the standard error (N = 8 mice). This demonstrates a robust and reliable decrease in locomotion around the onset of burst events. K) The burst event frequency decreased across the hour (F11,77 = 6.91, p = 5.66e-8, N = 8 mice). L) A larger fraction of the Aversive ensemble vs the Remaining ensemble participated in each burst event (left) (t7 = 3.68, p = 0.0079, N = 8 mice).
Figure 1.
Figure 1.. Strong aversive experience drives retrospective memory-linking to a neutral context learned days ago.
A) Schematic of prospective vs retrospective memory-linking behavior experiment. Mice either received a Neutral experience followed by an Aversive experience two days later (Retrospective) or the Aversive experience followed by Neutral (Prospective). One day after the second experience, mice were tested in the Aversive context they were shocked in. The following day, mice were tested in either the previously experienced Neutral context or a Novel context. B) Freezing during Aversive recall in Prospective vs Retrospective groups. There was no difference in Aversive recall freezing between Prospective & Retrospective conditions (t34 = 0.36, p = 0.72) (Retrospective, N = 16 mice; Prospective, N = 20 mice). C) Freezing during Neutral vs Novel recall in Prospective vs Retrospective groups. There was a significant interaction between freezing in Neutral vs Novel recall in the Retrospective vs Prospective groups, suggesting the Aversive experience retrospectively linked to the Neutral memory, but not prospectively. Significant interaction between Direction (Prospective vs Retrospective) and Context (Neutral vs Novel), (F1,32 = 4.90, p = 0.034) (Retrospective Neutral, N = 8 mice; Retrospective Novel, N = 8 mice; Prospective Neutral, N = 12 mice, Prospective Novel, N = 8 mice). Post-hoc, Retrospective (t32 = 2.586, p = 0.029), Prospective (t32 = 0.452, p = 0.6546). D) Schematic of Low Shock vs High Shock retrospective memory-linking experiment. Mice received a Neutral experience followed by a 1hr offline session in their homecage. Two days later, they received either 3 low shocks (0.25mA) or 3 high shocks (1.5mA, same amplitude as in Figure 1A) in an Aversive context, followed by another 1hr offline session in their homecage. The following day they were tested in the Aversive context, and for the following two days they were tested in the Neutral and Novel contexts, counterbalanced. Calcium imaging was performed during all the sessions. E) Freezing during Aversive recall in Low vs High Shock mice. Mice froze more in the Aversive context after receiving a high shock vs low shock (t18.8 = 5.877, p = 0.000012) (Low Shock, N = 10 mice; High Shock, N = 12 mice). F) Freezing during Neutral vs Novel recall in Low vs High Shock mice. Mice only displayed enhanced freezing in Neutral vs Novel (i.e., retrospective memory-linking) after High Shock and not Low Shock. Significant effect of Context (Neutral vs Novel) (F1,20 = 17.32, p = 0.000048) and significant interaction between Context and Amplitude (F1,20 = 4.99, p = 0.037) (Low Shock, N = 10 mice; High Shock, N = 12 mice). High Shock mice froze more in the Neutral vs Novel contexts (t11 = 4.37, p = 0.002) while Low Shock mice froze no differently in the two contexts (t9 = 1.23, p = 0.249). G) Correlation between Aversive recall freezing and memory-linking strength. The strength of the aversive memory was correlated with the degree of retrospective memory-linking in High Shock mice (R2 = 0.45, p = 0.016), but not in Low Shock mice (R2 = 0.0003, p = 0.963) (Low Shock, N = 10 mice; High Shock, N = 12 mice).
Figure 2.
Figure 2.. Strong aversive experience drives reactivation of a past neutral ensemble.
A) Representative histology (left) of GCaMP6f expression in hippocampal CA1, imaged with a confocal microscope. Green represents AAV1-Syn-GCaMP6f expression, while blue represents a cellular DAPI stain. Maximum intensity projection of an example mouse across one recording session, imaged with a Miniscope (middle), with the spatial footprints of all recorded cells during that session (right) randomly color-coded. B) During Offline1 after Neutral encoding, cells that were active during Neutral encoding (Neutral ensemble) made up ~25–30% of the offline cell population (pie charts) (X2 = 0.122, df = 1, p = 0.73). The Neutral ensemble was more highly active than the Remaining ensemble during the offline period (line graphs; A.U.). There was a main effect of Ensemble (F1,159 = 59.19, p = 1.4e-12), no effect of Amplitude (F1,13 = 0.039, p = 0.85), and an effect of Time (F1,159 = 4.33, p = 0.039), and all interactions p > 0.05 (Low Shock, N = 7 mice; High Shock, N = 8 mice). C) During Offline2 after Aversive encoding, similar proportions of previously active cells were reactivated across Low and High shock groups (pie charts) (X2 = 0.326, df = 3, p = 0.955). However, ensembles were differentially reactivated based upon the amplitude of the Aversive experience (Ensemble x Amplitude: F3,331 = 5.36, p = 0.0013) (line graphs; A.U.). In Low Shock mice, the Neutral, Aversive, and Neutral ∩ Aversive ensembles were more highly active than the Remaining ensemble (contrast, t18 = 4.22, p = 0.0005). Additionally, these ensembles were differentially active relative to one another (F2,12 = 4.03, p = 0.046). This was driven by the Neutral ensemble being less active. The Neutral ensemble was less active than the Aversive and Neutral ∩ Aversive ensembles (t12 = 2.83, p = 0.03) while the Aversive ensemble was no differently active than the Neutral ∩ Aversive ensemble (t12 = 0.19, p = 0.85). In High Shock mice, the Neutral, Aversive, and Neutral ∩ Aversive ensembles were all more highly active than the Remaining ensemble (t21 = 4.36, p = 0.0003), but these three ensembles were no differently active from each other (F2,14 = 1.52, p = 0.25) (Low Shock, N = 7 mice; High Shock, N = 8 mice). D) During the offline periods, hippocampal activity displayed brief bursts of neural activity. To detect these bursts, we computed the z-scored mean activity of the entire recorded population and applied a threshold of z=2 and defined burst periods as all the timepoints above this threshold. The left raster represents an example burst period during Offline1, during which mean population activity briefly reached above threshold. Each row of the raster represents the activity of every recorded neuron, color-coded based on the ensemble it was a part of (blue represents Neutral ensemble and grey represents Remaining ensemble; see legend in Figure 2B). The top black trace represents the z-scored mean population activity. The right raster represents an example non-burst period. E) Same as D but an example burst and non-burst period for Offline2. Each row of the raster again is color-coded based on the ensemble it was a part of (Aversive in red, Neutral ∩ Aversive in purple, Neutral in blue, and Remaining in grey; see legend in Figure 2C). F) During Offline1 in both Low and High Shock groups, a larger fraction of the Neutral ensemble participated in bursts than the Remaining ensemble did (Ensemble: F1,13 = 16.33, p = 0.001; Amplitude: F1,13 = 0.009, p = 0.925; Ensemble x Amplitude: F1,13 = 0.0058, p = 0.940) (Low Shock, N = 7 mice; High Shock, N = 8 mice). G) During Offline2 in both Low and High Shock groups, a larger fraction of the Aversive ensemble participated in bursts than the Remaining ensemble (Ensemble: F1,13 = 13.57, p = 0.0028; Amplitude: F1,13 = 0.000078, p = 0.99; Ensemble x Amplitude: F1,13 = 0.16, p = 0.69) (Low Shock, N = 7 mice; High Shock, N = 8 mice). H) During Offline2 in both Low and High Shock groups, a larger fraction of the Neutral ∩ Aversive ensemble participated in bursts than the Remaining ensemble (Ensemble: F1,13 = 13.95, p = 0.0025; Amplitude: F1,13 = 0.014, p = 0.91; Ensemble x Amplitude: F1,13 = 0.31, p = 0.58) (Low Shock, N = 7 mice; High Shock, N = 8 mice). I) During Offline2, Neutral and Remaining ensembles differentially participated in bursts in High and Low Shock groups (Ensemble x Amplitude: F1,13 = 5.186, p = 0.040). High Shock mice showed higher participation of the Neutral ensemble relative to Remaining ensemble (t7 = 4.88, p = 0.0036), whereas Low Shock mice showed no different participation between the two ensembles (t6 = 1.33, p = 0.23) (Low Shock, N = 7 mice; High Shock, N = 8 mice).
Figure 3.
Figure 3.. Strong aversive experience drives co-reactivation of the Neutral ensemble with the Neutral ∩ Aversive ensemble.
A) Representation of the quantification of independent participation during bursts versus non-bursting periods. Burst events were defined by the whole recorded population, as in Figure 2E (outlined by yellow rectangles). However, now the z-scored mean population activity of the Aversive, Neutral, and Neutral ∩ Aversive ensembles was computed to ask how frequently each ensemble participated in whole population bursts independently of one another. Independent participation meant one ensemble participated while the other two did not. B) During burst periods, the Neutral ∩ Aversive ensemble participated independently in more bursts than the Aversive ensemble (t14 = 7.95, p = 0.000002) and more than the Neutral ensemble (t14 = 5.59, p = 0.0001) but there was no difference in participation across Low vs High Shock mice (F1,13 = 1.43, p = 0.25) and no interaction (F2,26 = 2.49, p = 0.10) (Low Shock, N = 7 mice; High Shock, N = 8 mice). C) During non-burst periods, there was no difference in participation across ensembles (F2,26 = 0.38, p = 0.69) or between Low and High Shock mice (F1,13 = 0.73, p = 0.41), and no interaction (F2,26 = 0.36, p = 0.70) (Low Shock, N = 7 mice; High Shock, N = 8 mice). D) Representation of the quantification of co-participation during bursts vs non-bursting periods. As in Figure 3B, the whole population was used to define bursts and the z-scored mean population activities were used to define participation of each ensemble. Co-participation was defined as a whole population burst (outlined by yellow rectangles) during which multiple ensembles participated simultaneously. There were four possible combinations (from left to right: N∩A x N, N∩A x A, N x A, N∩A x N x A) (N∩A = Neutral ∩ Aversive; N = Neutral; A = Aversive). E) During burst periods, there was a significant interaction between Ensemble Combination and Low vs High Shock (p = 0.01), suggesting that the patterns of co-bursting varied in Low vs High Shock mice. Post-hoc tests revealed that in Low Shock mice, co-participation between all 3 ensembles was less likely to occur than the other combinations (t18 = 4.73, p = 0.0003), while in High Shock mice, co-participation between all 3 ensembles occurred no differently than the other combinations (t21 = 0.358, p = 0.72). Additionally, in the High Shock group, the N∩A ensemble preferentially co-participated with the Neutral ensemble compared to with the Aversive ensemble (t21 = 2.373, p = 0.05), whereas in the Low Shock group, the N∩A ensemble participated no differently with the Neutral and Aversive ensembles (t18 = 1.196, p = 0.25) (Low Shock, N = 7 mice; High Shock, N = 8 mice). F) During non-burst periods, co-participation between all 3 ensembles was less likely than the other combinations (t39 = 10.92, p = 1.98e-13); however, there was no effect of Low vs High Shock (F1,13 = 0.038, p = 0.847) and no interaction (F3,39 = 0.198, p = 0.897) (Low Shock, N = 7 mice; High Shock, N = 8 mice).
Figure 4.
Figure 4.. Strong aversive experience drives Neutral ∩ Aversive ensemble reactivation during Neutral context recall.
A) Behavioral schematic of calcium imaging experiment, as in Figure 1D. Here, we focused on hippocampal activity during the Aversive, Neutral, and Novel recall sessions. B) Cells active only during the Neutral experience and not the Aversive experience were more likely to be reactivated when mice were placed back in the Neutral context, compared to when they were placed in a Novel context (F1,12 = 24.44, p = 0.0003). There was no effect of shock amplitude (F1,12 = 3.08, p = 0.10) (Low Shock, N = 6 mice; High Shock, N = 8 mice). C) Cells active during the Aversive experience and not the Neutral experience were no differently reactivated in Neutral vs Novel contexts. (Amplitude: F1,12 = 0.029, p = 0.869; Context: F1,12 = 1.39, p = 0.261; Amplitude x Context: F1,12 = 0.14, p = 0.71) (Low Shock, N = 6 mice; High Shock, N = 8 mice). D) Cells active during both the initial Neutral and Aversive experiences were subsequently more likely to be reactivated in the Neutral context compared to Novel context in High Shock mice (t7 = 8.53, p = 0.00012), but not Low Shock mice (t5 = 0.55, p = 0.61; Context x Amplitude: F1,12 = 10.33, p = 0.007) (Low Shock, N = 6 mice; High Shock, N = 8 mice). E) In High Shock mice, population activity patterns in the Neutral context changed significantly from Neutral encoding to Neutral recall (Amplitude: F1,12 = 5.65; SessionPair: F1,12 = 10.42; Amplitude x SessionPair: F1,12 = 6.22). During Neutral recall in High Shock mice, population activity vectors were less correlated with the average Neutral encoding population vector than Aversive recall activity was with the average Aversive encoding population vector (t7 = 4.10, p = 0.009). Neutral encoding-to-recall correlations were also lower in High vs Low Shock mice (t6.92 = 2.98, p = 0.042). Aversive encoding-to-recall correlations were no different in High vs Low Shock mice (t6.11 = 1.13, p = 0.30). In Low Shock mice, Neutral and Aversive encoding-to-recall correlations were no different (t5 = 0.23, p = 0.83) (Low Shock, N = 6 mice; High Shock, N = 8 mice).
Figure 5.
Figure 5.. Offline ensemble reactivation drives retrospective memory-linking across days.
After single experiences, the cells active during learning are reactivated to support their consolidation. After a strong aversive experience, memories are linked retrospectively across days by the co-reactivation of the ensembles representing both the recent and the past neutral memory ensembles. During recall of the neutral memory, many of the cells that were active during both the neutral and aversive experiences are reactivated to drive fear in the neutral context.

References

    1. Reijmers L. G., Perkins B. L., Matsuo N. & Mayford M. Localization of a stable neural correlate of associative memory. Science 317, 1230–1233 (2007). https://doi.org:10.1126/science.1143839 - DOI - PubMed
    1. Liu X. et al. Optogenetic stimulation of a hippocampal engram activates fear memory recall. Nature 484, 381–385 (2012). https://doi.org:10.1038/nature11028 - DOI - PMC - PubMed
    1. Han J. H. et al. Neuronal competition and selection during memory formation. Science 316, 457–460 (2007). https://doi.org:10.1126/science.1139438 - DOI - PubMed
    1. Rogerson T. et al. Synaptic tagging during memory allocation. Nat Rev Neurosci 15, 157–169 (2014). https://doi.org:10.1038/nrn3667 - DOI - PMC - PubMed
    1. Josselyn S. A. & Frankland P. W. Memory Allocation: Mechanisms and Function. Annu Rev Neurosci 41, 389–413 (2018). https://doi.org:10.1146/annurev-neuro-080317-061956 - DOI - PMC - PubMed

Methods References

    1. Cai D. J. et al. A shared neural ensemble links distinct contextual memories encoded close in time. Nature 534, 115–118 (2016). https://doi.org:10.1038/nature17955 - DOI - PMC - PubMed
    1. Pennington Z. T. et al. ezTrack: An open-source video analysis pipeline for the investigation of animal behavior. Sci Rep 9, 19979 (2019). https://doi.org:10.1038/s41598-019-56408-9 - DOI - PMC - PubMed
    1. Dong Z. et al. Minian, an open-source miniscope analysis pipeline. Elife 11 (2022). https://doi.org:10.7554/eLife.70661 - DOI - PMC - PubMed
    1. Sheintuch L. et al. Tracking the Same Neurons across Multiple Days in Ca(2+) Imaging Data. Cell Rep 21, 1102–1115 (2017). https://doi.org:10.1016/j.celrep.2017.10.013 - DOI - PMC - PubMed
    1. Rubel O. et al. The Neurodata Without Borders ecosystem for neurophysiological data science. Elife 11 (2022). https://doi.org:10.7554/eLife.78362 - DOI - PMC - PubMed

Publication types