[Preprint]. 2023 Jun 30:2023.03.24.534141.
doi: 10.1101/2023.03.24.534141.

Proteomic survey of the DNA damage response in Caulobacter crescentus

Affiliations

Proteomic survey of the DNA damage response in Caulobacter crescentus

Tommy F Tashjian et al. bioRxiv. .

Update in

Abstract

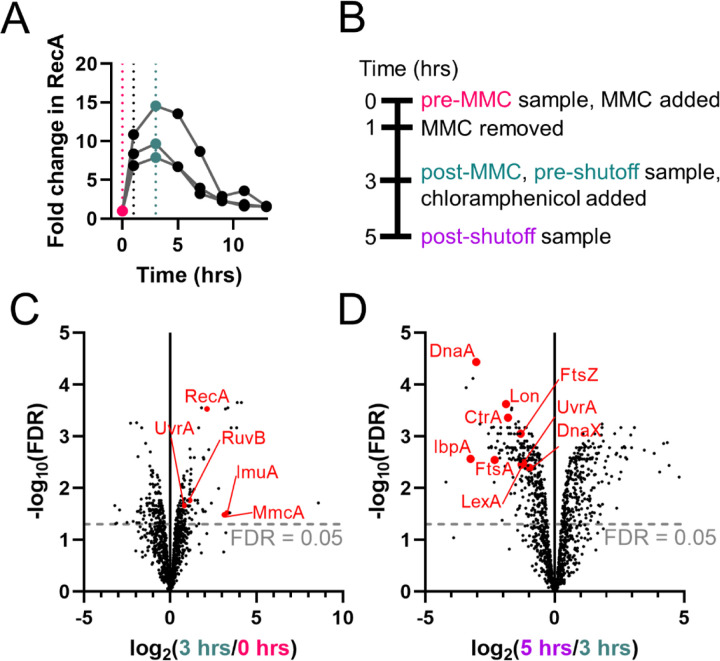
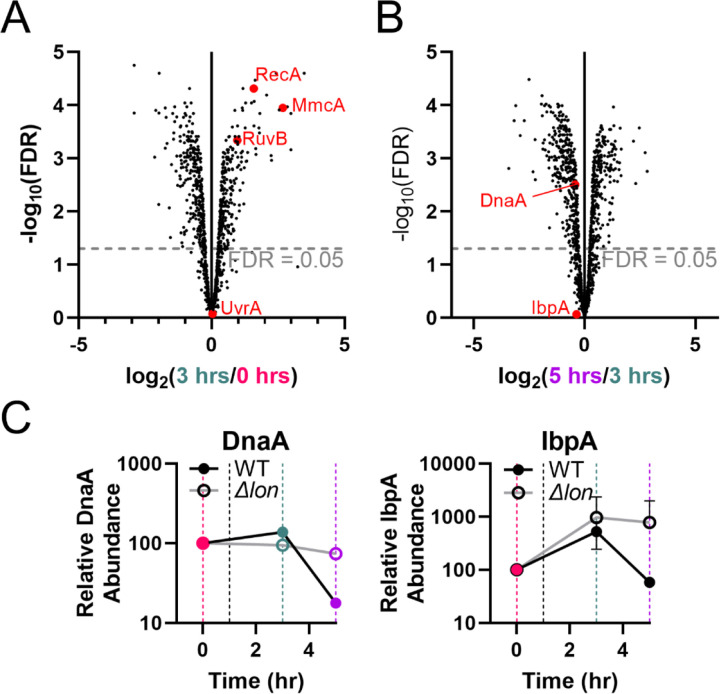
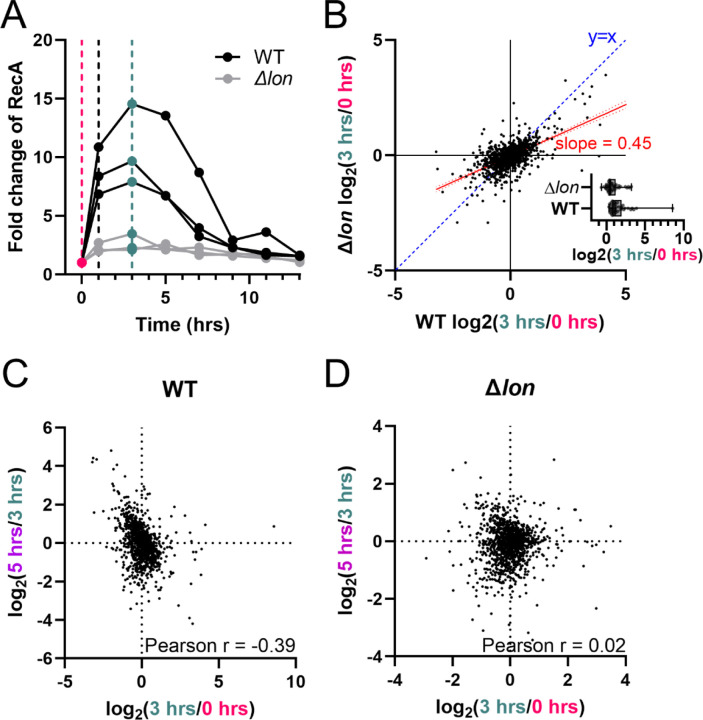
The bacterial DNA damage response is a critical, coordinated response to endogenous and exogenous sources of DNA damage. Response dynamics are dependent on coordinated synthesis and loss of relevant proteins. While much is known about its global transcriptional control, changes in protein abundance that occur upon DNA damage are less well characterized at the system level. Here, we perform a proteome-wide survey of the DNA damage response in Caulobacter crescentus . We find that while most protein abundance changes upon DNA damage are readily explained by changes in transcription, there are exceptions. The survey also allowed us to identify the novel DNA damage response factor, YaaA, which has been overlooked by previously published, transcription- focused studies. A similar survey in a Δ lon strain was performed to explore lon's role in DNA damage survival. The Δ lon strain had a smaller dynamic range of protein abundance changes in general upon DNA damage compared to the wild type strain. This system-wide change to the dynamics of the response may explain this strain's sensitivity to DNA damage. Our proteome survey of the DNA damage response provides additional insight into the complex regulation of stress response and nominates a novel response factor that was overlooked in prior studies.

Importance: The DNA damage response helps bacteria to react to and potentially survive DNA damage. The mutagenesis induced during this stress response contributes to the development of antibiotic resistance. Understanding how bacteria coordinate their response to DNA damage could help us to combat this growing threat to human health. While the transcriptional regulation of the bacterial DNA damage response has been characterized, this study is the first to our knowledge to assess the proteomic response to DNA damage in Caulobacter .


Figures

Figure 1.
Figure 1.. Survey of Caulobacter DNA damage response distinguishes known DNA damage response factors and protease substrates.
(A) A western blot for RecA protein levels was used to determine peak protein induction (3 hours) to use for post-MMC timepoint for proteomics survey. Quantification of western blot for three replicates is shown, representative blot shown in Figure S1. RecA quantification was normalized to ClpP band and then to time 0 (Figure S1). (B) Samples for proteomics were taken before treatment (0 hours, pink line). Cells were treated with MMC for 1 hour and recovered in fresh medium for 2 additional hours before the post-treatment proteomics sample was taken (3 hours, teal line). At 3 hours chloramphenicol was added to shutoff translation and a post-shutoff sample was taken at 5 hours. (C) A volcano plot of proteomics data compares the statistical confidence (−log10(false discovery rate)) versus the change in protein abundance after MMC treatment log2(3 hrs/0 hrs). Several of the proteins that are significantly upregulated after DNA damage treatment are known DNA damage response proteins (highlighted in red). (D) A volcano plot of proteomics data compares the statistical confidence (−log10(false discovery rate)) versus the change in protein abundance after translation shutoff log2(5 hrs/3 hrs). Several of the proteins that are significantly downregulated after chloramphenicol treatment are known protease substrates (highlighted in red). FDR, false discovery rate.
Figure 2.
Figure 2.. YaaA is upregulated upon MMC treatment and is important for survival to MMC, H2O2, and UV light.
(A) A comparison between our proteomics and previously published microarray experiment that uses similar MMC treatment conditions (19). Graph on the right is an enlargement of the red box in the graph on the left. Proteins highlighted in red are known DNA damage response genes that are upregulated at the RNA and protein levels. YaaA is highlighted in blue. CCNA_02118, CCNA_00591, and CCNA_00276 are highlighted in purple. Graph cropped to upper right quadrant to highlight proteins that are upregulated. One gene is excluded (CCNA_03825) due to its extremely high induction to make other points more visible. (B and C) When each mKate2-expressing test strain is competed in co-culture against a wild type Venus-expressing fluorescent control strain, only the ΔyaaA mutant shows a competitive disadvantage that is exacerbated by the presence of (B) 0.1 μg/mL MMC or (C) 25 μM hydrogen peroxide. A reciprocal experiment in which test strains are marked with Venus and wild type control is marked with mKate2 is shown in Figure S3B and S3C. (D) The wild type and ΔyaaA strains were exposed to 0 or 100 J/m2 of ultra-violet light and 10-fold dilutions were plated. The ΔyaaA strain is more sensitive to ultra-violet light than the wild type strain.
Figure 3.
Figure 3.. Proteomics Survey in Δlon strain distinguishes known Lon substrates.
(A) A volcano plot of proteomics data compares the statistical confidence (−log10(false discovery rate)) versus the log2(3 hrs/0 hrs). Known DNA damage proteins shown in Figure 1B are highlighted here in red. ImuA was not identified in the proteomics of the Δlon strain and so is absent. (B) A volcano plot compares the statistical confidence (−log10(false discovery rate)) versus the log2(5 hrs/3 hrs) for the Δlon strain. Known Lon substrates DnaA and IbpA show a smaller decrease in protein abundance after translation shutoff than in the wild type strain (compare to Figure 1D). (C) Protein abundance of known Lon substrates DnaA and IpbA significantly increases upon MMC treatment (0–3 hours, pink and teal lines) and then decreases upon translation shutoff in a lon-dependent manner (3–5 hours, teal and purple lines). Note that protein abundances are not directly comparable between the two strains. FDR, false discovery rate.
Figure 4.
Figure 4.. Protein abundance changes upon DNA damage are generally smaller in the Δlon strain compared to in the wild type strain.
(A) A western blot to determine RecA protein levels was used to determine when to sample for protein abundance changes after DNA damage treatment in the Δlon strain. Note that the wild type data here is repeated from Figure 1A for easy comparison. Quantification of western blot for three replicates is shown, representative blot shown in Figure S1. Sampling for proteomics was performed as described in Figure 1B. RecA quantification was normalized to ClpP band and then to time 0 (see Figure S1). (B) Comparison of the log2(3 hrs/0 hrs) for the Δlon versus wild type strain shows that fold changes of protein abundance are generally lower in the Δlon strain. Blue dashed line represents an y=x line. The red line represents the trendline of the data with 95% CI drawn (slope = 0.45). The inset plots log2(3 hrs/0 hrs) for all proteins that are significantly upregulated (FDR < 0.05). Comparison of protein changes upon MMC treatment and translational shutoff indicates a negative correlation in the wild type strain (C) that is absent in the (D) Δlon strain.

Similar articles

References

    1. Cirz RT, Chin JK, Andes DR, de Crécy-Lagard V, Craig WA, Romesberg FE. 2005. Inhibition of mutation and combating the evolution of antibiotic resistance. PLoS Biol 3:e176. - PMC - PubMed
    1. Norton MD, Spilkia AJ, Godoy VG. 2013. Antibiotic resistance acquired through a DNA damage-inducible response in Acinetobacter baumannii. J Bacteriol 195:1335–1345. - PMC - PubMed
    1. Beaber JW, Hochhut B, Waldor MK. 2004. SOS response promotes horizontal dissemination of antibiotic resistance genes. Nature 427:72–74. - PubMed
    1. Ubeda C, Maiques E, Knecht E, Lasa I, Novick RP, Penadés JR. 2005. Antibiotic-induced SOS response promotes horizontal dissemination of pathogenicity island-encoded virulence factors in staphylococci. Mol Microbiol 56:836–844. - PubMed
    1. Maiques E, Ubeda C, Campoy S, Salvador N, Lasa I, Novick RP, Barbé J, Penadés JR. 2006. beta-lactam antibiotics induce the SOS response and horizontal transfer of virulence factors in Staphylococcus aureus. J Bacteriol 188:2726–2729. - PMC - PubMed

Publication types