[Preprint]. 2023 Jun 30:2023.03.21.533689.
doi: 10.1101/2023.03.21.533689.

Endocytic myosin-1 is a force-insensitive, power-generating motor

Affiliations

Endocytic myosin-1 is a force-insensitive, power-generating motor

Ross Ta Pedersen et al. bioRxiv. .

Update in

Abstract

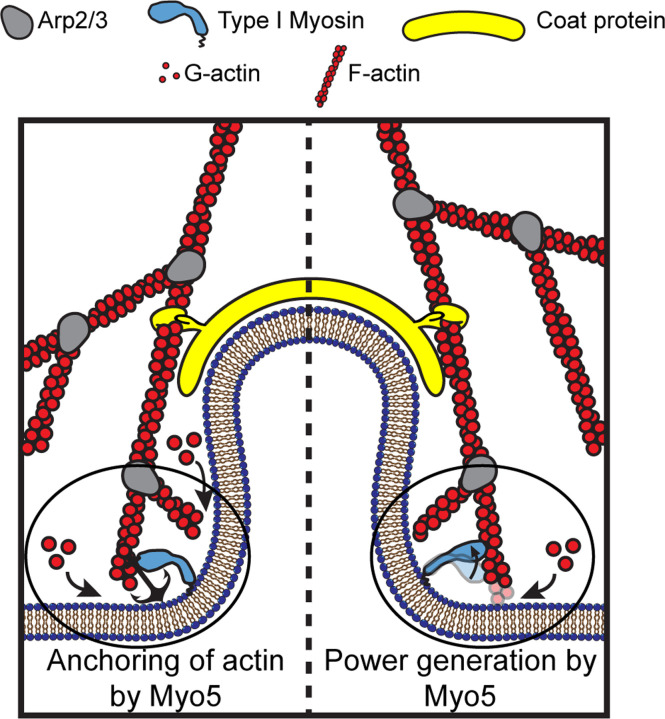
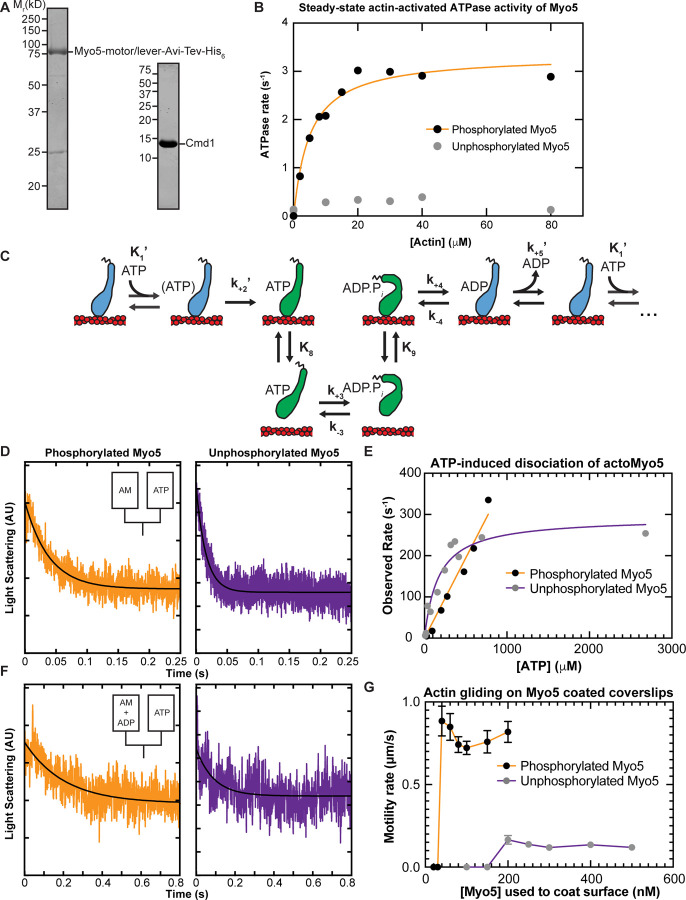
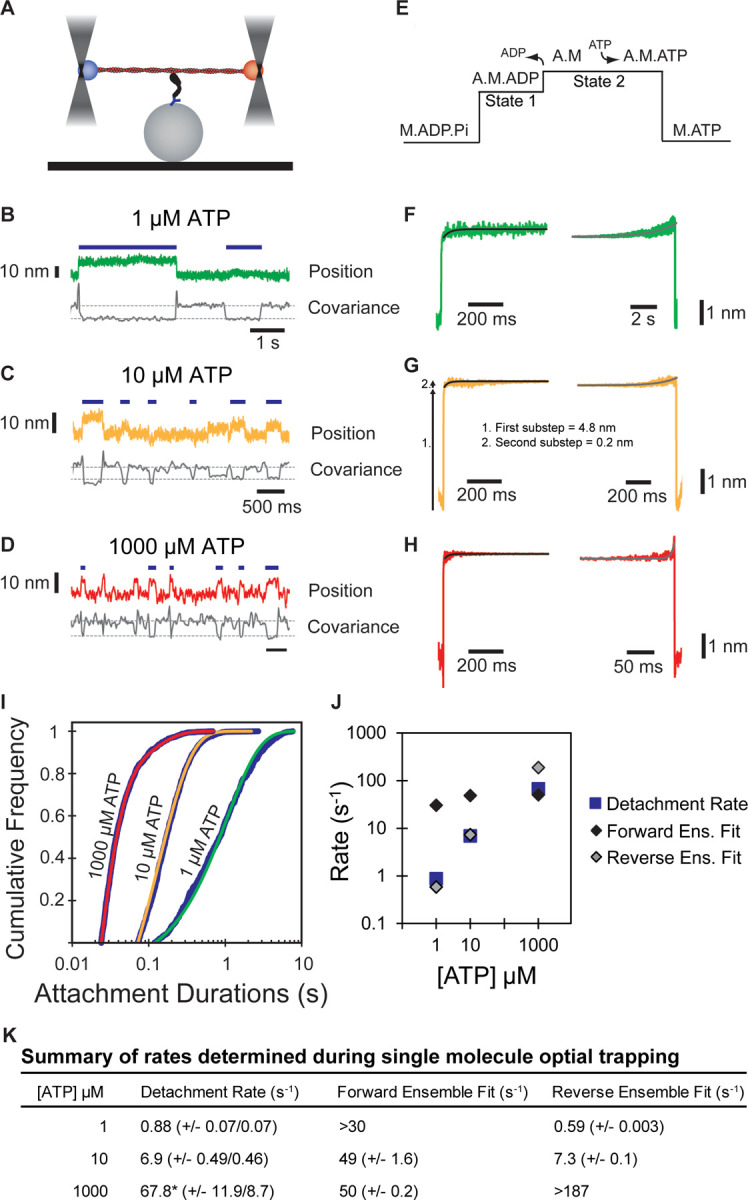
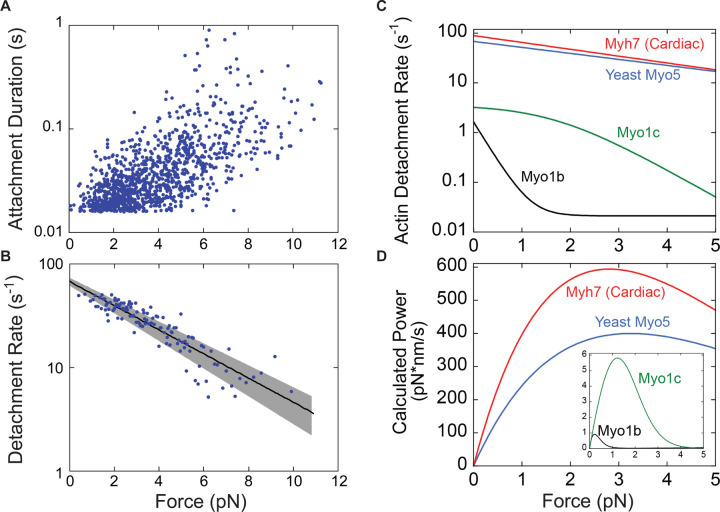
Myosins are required for clathrin-mediated endocytosis, but their precise molecular roles in this process are not known. This is, in part, because the biophysical properties of the relevant motors have not been investigated. Myosins have diverse mechanochemical activities, ranging from powerful contractility against mechanical loads to force-sensitive anchoring. To better understand the essential molecular contribution of myosin to endocytosis, we studied the in vitro force-dependent kinetics of the Saccharomyces cerevisiae endocytic type I myosin called Myo5, a motor whose role in clathrin-mediated endocytosis has been meticulously studied in vivo. We report that Myo5 is a low-duty-ratio motor that is activated ∼10-fold by phosphorylation, and that its working stroke and actin-detachment kinetics are relatively force-insensitive. Strikingly, the in vitro mechanochemistry of Myo5 is more like that of cardiac myosin than like that of slow anchoring myosin-1s found on endosomal membranes. We therefore propose that Myo5 generates power to augment actin assembly-based forces during endocytosis in cells.

Summary: Pedersen, Snoberger et al. measure the force-sensitivity of the yeast endocytic the myosin-1 called Myo5 and find that it is more likely to generate power than to serve as a force-sensitive anchor in cells. Implications for Myo5's role in clathrin-mediated endocytosis are discussed.


Figures

Figure 1:
Figure 1:. Models for the functions of actin assembly and myosin activity during membrane deformation for clathrin-mediated endocytosis
Cartoon diagram illustrating the organization of actin filaments and Myo5 molecules at endocytic sites. Actin filaments are bound by coat proteins at the tip of the growing membrane invagination and oriented with their growing ends toward the plasma membrane, powering membrane invagination. The type I myosin Myo5 could either anchor the actin network in a favorable orientation (left) or provide an assisting force (right).
Figure 2:
Figure 2:. In-solution, population biochemical characterization of Myo5
(A) Coomassie-stained SDS-polyacrylamide gels showing example preparations of the purified Myo5 motor/lever construct and calmodulin (Cmd1, light chain) used in all experiments. (B) The actin concentration dependence of the steady-state ATPase activity of 100 nM unphosphorylated (grey circles) and phosphorylated Myo5 (black circles). Each data point represents the average of 6–7 time courses, which were 100 s each. The orange line is a best fit of the phosphorylated Myo5 data to a rectangular hyperbola. (C) Schematic pathway for the Myo5 ATPase cycle. Blue motors are in tightly bound conformations, green motors are weakly bound/unbound. (D) Example light scattering transients reporting on ATP-induced dissociation of phosphorylated (left, kobs=17s1) and unphosphorylated (right, kobs=64.1s1) actoMyo5, obtained by mixing 100 nM actoMyo5 (AM) with 94 µm and 72 µM ATP, respectively, as shown in the inset schematic. The black line is the fit of a single exponential function to the data. (E) ATP concentration dependence of dissociation of 100 nM unphosphorylated (grey circles) and phosphorylated actoMyo5 (black circles). Each data point represents 3–6 time courses averaged and fit to a single exponential decay function. The orange line is a linear best fit of the phosphorylated Myo5 data. The purple line is a best fit of the unphosphorylated Myo5 data to a rectangular hyperbola. (F) Example light scattering transients reporting ATP-induced dissociation of ADP-saturated phosphorylated (left) and unphosphorylated (right) actoMyo5, obtained by preincubating 200 nM actoMyo5 (AM) with 100 µM ADP, then mixing rapidly with 2.5 mM ATP, as shown in the inset schematic. The black line is the fit of a single exponential function to the data. (G) Velocity of actin filament gliding, measured at varying surface densities of Phospho-Myo5 (black circles, orange line) and unphosphorylated Myo5 (gray circles, purple line) in in vitro motility assays. Myosin concentrations indicate the quantity of protein incubated in the flow chamber before washing. Each data point represents the average velocity of 30 – 60 filaments, and the error bars are standard deviations.
Figure 3:
Figure 3:. Single molecule, optical trap analysis of Myo5 step size and kinetics
(A) Cartoon schematic of the 3-bead optical trapping setup. A biotinylated actin filament is tethered between two neutravidin-coated beads that are trapped in a dual beam optical trap. This bead-actin-bead “dumbbell” is lowered onto pedestal beads that have been sparsely coated with His6 antibody to attach Myo5-motor/lever-Avi-Tev-His9. (B-D) Single Myo5 displacements of a single bead position and covariance traces, calculated using both beads, showing single molecule interactions acquired in the presence of 1 µM (B) 10 µM (C) and 1000 µM ATP. (D). Blue bars indicate attachment events as identified by covariance (gray) decreases. The threshold of event detection by the covariance traces are indicated by dashed gray lines. (E) Schematic of displacement traces depicting the 2-step nature of actomyosin displacements in the optical trap. (F-H) Binding events were synchronized at their beginnings (left) or ends (right) and averaged forward or backward in time, respectively. Measured total displacement of Myo5 was 5.0 nm at 10 µM ATP, with the 1st substep contributing a 4.8 nm displacement (arrow 1. in G) and the 2nd substep contributing a 0.2 nm displacement (arrow 2. In G). (F-H, left) Forward-averaged ensembles synchronized at the beginnings of events. (F-H, right) Reverse-averaged ensembles synchronized at the ends of events. Black and gray lines are single exponential fits in the forward and reverse ensembles, respectively. (I) Cumulative distributions of attachment durations for Myo5 at 1, 10, and 1000 µM ATP. Blue lines show cumulative frequency of attachment durations at the indicated ATP concentrations, and the red, yellow, and green lines indicate fitted exponential distributions at 1, 10, and 1000 µM ATP, respectively. 1 and 10 µM ATP were fit well to single exponentials, and the 1000 µM ATP data were best described by the sum of two exponentials. (J) Summary of rates at 1, 10, and 1000 µM ATP calculated from (F-H). Blue boxes are the fitted exponential distributions from (I), black diamonds are forward ensemble fits from (F-H, left), and gray diamonds are reverse ensemble fits from (F-H, right). At lower concentrations of ATP (1 and 10 µM), the rate of detachment is limited by ATP association, corresponding to the reverse ensemble fits, while at saturating ATP concentration (1000 µM), the detachment rate is limited by the rate of ADP dissociation, corresponding to the forward ensemble fits. (K) Summary of rates determined via single molecule optical trapping. Errors for detachment rates are 95% confidence intervals. Errors for forward and reverse ensemble fits are standard errors of the fits. *Detachment rates at 1000 µM ATP were best fit to the sum of 2 exponents. The major component of the fit (67.8 s−1) comprises 92.1% of the total with the remaining 7.9% having a rate of 11.6 s−1.
Figure 4:
Figure 4:. Myo5 attachment lifetimes are substantially less force-dependent than other known type I myosins
An isometric optical force clamp was utilized to determine the force-sensitivity of the detachment of Myo5 from actin. (A) Durations of individual actomyosin attachments as a function of force, plotted on a semi-log scale (B) The solid black line shows the force dependence of the detachment rates determined by MLE fitting of unaveraged points in A. For illustration purposes, attachment durations from (A) were binned by force at every 10 points, averaged, and converted to rates. Best- fit parameters were determined by MLE fitting and 95% confidence intervals were calculated via bootstrapping. The solid black line is calculated from best fit parameters (k=67.6s1, d=1.14nm), while the gray shaded region is the 95% confidence interval (k=67.672.9s1, d=1.031.26nm). All MLE fitting was performed on unaveraged data and was corrected for instrument deadtime. (C) The force dependent detachment rate of Myo5 (from panel B) plotted alongside the force dependent detachment rates for Myo1b, Myo1c, and β-cardiac muscle myosin, Myh7. (D) Power output for the same four myosins calculated over a range of forces by multiplying the functions from (C) by the applied force F, and the step size and duty ratios of each myosin.

Similar articles

References

    1. Aghamohammadzadeh S., and Ayscough K.R. 2009. Differential requirements for actin during yeast and mammalian endocytosis. Nat. Cell Biol. 11:1039–1042. doi:10.1038/ncb1918. - DOI - PMC - PubMed
    1. Akamatsu M., Vasan R., Serwas D., Ferrin M., Rangamani P., and Drubin D.G. 2020. Principles of self-organization and load adaptation by the actin cytoskeleton during clathrin-mediated endocytosis. Elife. 9:1–40. doi:10.7554/eLife.49840. - DOI - PMC - PubMed
    1. Almeida C.G., Yamada A., Tenza D., Louvard D., Raposo G., and Coudrier E. 2011. Myosin 1b promotes the formation of post-Golgi carriers by regulating actin assembly and membrane remodelling at the trans-Golgi network. Nat. Cell Biol. 13:779–789. doi:10.1038/ncb2262. - DOI - PubMed
    1. Basu R., Munteanu E.L., and Chang F. 2013. Role of turgor pressure in endocytosis in fission yeast. Mol. Biol. Cell. 25:679–87. doi:10.1091/mbc.E13-10-0618. - DOI - PMC - PubMed
    1. Bement W.M., and Mooseker M.S. 1995. TEDS rule: A molecular rationale for differential regulation of myosins by phosphorylation of the heavy chain head. Cell Motil. Cytoskeleton. 31:87–92. doi:10.1002/cm.970310202. - DOI - PubMed

Publication types