[Preprint]. 2023 Mar 28:2023.03.24.23287659.
doi: 10.1101/2023.03.24.23287659.

Genetic regulation of fetal hemoglobin across global populations

Affiliations

Genetic regulation of fetal hemoglobin across global populations

Liam D Cato et al. medRxiv. .

Abstract

Human genetic variation has enabled the identification of several key regulators of fetal-to-adult hemoglobin switching, including BCL11A, resulting in therapeutic advances. However, despite the progress made, limited further insights have been obtained to provide a fuller accounting of how genetic variation contributes to the global mechanisms of fetal hemoglobin (HbF) gene regulation. Here, we have conducted a multi-ancestry genome-wide association study of 28,279 individuals from several cohorts spanning 5 continents to define the architecture of human genetic variation impacting HbF. We have identified a total of 178 conditionally independent genome-wide significant or suggestive variants across 14 genomic windows. Importantly, these new data enable us to better define the mechanisms by which HbF switching occurs in vivo. We conduct targeted perturbations to define BACH2 as a new genetically-nominated regulator of hemoglobin switching. We define putative causal variants and underlying mechanisms at the well-studied BCL11A and HBS1L-MYB loci, illuminating the complex variant-driven regulation present at these loci. We additionally show how rare large-effect deletions in the HBB locus can interact with polygenic variation to influence HbF levels. Our study paves the way for the next generation of therapies to more effectively induce HbF in sickle cell disease and β-thalassemia.


Figures

Extended Data Figure 1
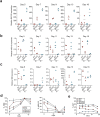
Supplementary Figure 1. QQ-plots for meta-analysis and ancestry-specific analyses from MAMA.
Extended Data Figure 2
Supplementary Figure 2. a, Heritability enrichments from LDAK for 64 functional categories in the BLD model. b, Genetic correlations between HbF with various red and white blood cell parameters. c, Conditionally independent analysis revealed a number of potential lead variants per locus, and after fine-mapping, 95% credible sets are shown. d, Functional consequences of the fine-mapped variants are shown.
Extended Data Figure 3
Supplementary Figure 3. a, UMAP projection SCAVENGE cell-stage enrichment results from single cell ATAC-seq data. b, Data in bulk.
Extended Data Figure 4
Supplementary Figure 4. Enhancer perturbations were quantified by qPCR and shown as a percentage of total alleles in the bulk population. Plotted are wild-type alleles, inversions, and deletions for the AAVS1 negative control and both enhancer deletion pairs.
Extended Data Figure 5
Supplementary Figure 5. MDN1, CASP8AP2, and MAP3K7 transcript abundance normalized to ACTB in the AAVS1 negative control and enhancer deletion samples.
Extended Data Figure 6
Supplementary Figure 6. a-e, Lentivirus increased expression of BACH2 in primary human CD34+ hematopoietic stem and progenitor cells sorted on the top (hi) and bottom (lo) 30% of GFP+ cells subjected to erythroid differentiation. Each point represents an independent transduction. a, BACH2 b, HBG1/2 and c, HBB transcript abundance across erythroid differentiation in each sorted population. d, % HBB and HBG1/2 transcripts across erythroid differentiation. e, Frequency of F-cells detected across erythroid differentiation.
Extended Data Figure 7
Supplementary Figure 7. a-b, Lentivirus increased expression of BACH2 in primary human CD34+ hematopoietic stem and progenitor cells sorted on the top (hi) and bottom (lo) 30% of GFP+ cells subjected to erythroid differentiation. Each point represents an independent transduction. a-b, Frequency of CD71CD235a CD71+CD235a, CD71+CD235a+, CD71CD235a+ cells on a, day 6 and b, day 10 of erythroid differentiation. a-b, Each point represents an independent transduction.
Extended Data Figure 8
Supplementary Figure 8. Lentivirus increased expression of BACH2 in primary human CD34+ hematopoietic stem and progenitor cells sorted on the top (hi) and bottom (lo) 30% of GFP+ cells subjected to erythroid differentiation. Cells were harvested on day 11 of erythroid differentiation culture and prepared by cytospin. Cell morphology was assessed by May Grunwald-Giemsa staining and imaging on a Nikon II Eclipse E800 microscope at 60x magnification. Shown is representative of three independent transductions across 30 fields.
Extended Data Figure 9
Supplementary Figure 9. A zoomed locus plot of part of BCL11A intron 2 region from Figure 3a. Showing the well known BCL11A variant rs1427407, and previously described DHS sites at +55, +58 and +62 kBp from the TSS in the context of ancestry and other potential causative loci. Diamond shaped points show ancestry based conditionally independent signals. Erythroid promoter-capture Hi-C interactions are shown, followed by ATAC-seq data for erythroid lineages. Finemapped signals in the fixed-effects analysis are highlighted by a triangle. Significant conditionally independent SNPs found in significant ATAC peaks are highlighted by a colored circle. Colored ranges above ATAC tracks correspond to statistically significant peaks.
Extended Data Figure 10
Supplementary Figure 10. a, Calculated polygenic risk scores (PRS) perform well in HbF discrimination in a test set b, PRS shows spread of distribution by deletion.
Extended Data Figure 11
Supplementary Figure 11. Genetic interactions between common variant polygenic risk score (PRS) and deletions on normalized HbF in Thai population in a Generalized Additive Model, corrected for age, sex and principal components of ancestry. * p<0.05, ** p<0.01, *** p<0.001.
Fig. 1
Fig. 1. GWAS of HbF across global populations with enrichment of fine-mapped variants in erythroid cells. ∣
a, Population geography of included studies and associated sample numbers. †, the Thai population had a proportion of individuals selected for elevated HbF and thus is not a general population. *, cohorts that employed gene expression measurements. b, Combined meta-analysis of fetal hemoglobin details several unexplored loci. Gene symbols shown are the most likely impacted gene nominated using several approaches (Supplementary Table 3). Window boxes are drawn over significant and suggestive signals identified via conditional analysis (Methods). Colored shading represents significant windows (p<5e-8), while gray represents a suggestive signal (p<1e-6). c, d, e, show ancestry specific analyses conducted using MAMA (Methods) for African (AFR), European (EUR), and Thai ancestry backgrounds, respectively. Areas of differential signal indicate potential ancestry-specific effects on HbF, y-axis was limited to p>1e-100. f, SCAVENGE analysis using scATAC-seq data, within the enriched erythroid population there is particular enhancement of the trait relevance score (TRS) in the mid-late erythroid population. g, Spearman correlations between SCAVENGE TRS and chromVAR TF motif enrichment scores across erythroid cells to identify co-regulated transcription factor motifs.
Fig. 2
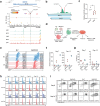
Fig. 2. Defining BACH2 as a genetically-nominated regulator of HbF. ∣
a, The BACH2 locus, with sentinel variant rs* shown as a purple diamond, and LD R^2 colored from red (high) to yellow (low). Two variants rs1010473 and rs1010474 display high LD (both in EUR and AFR populations) with the sentinel and are positioned in a peak of accessible chromatin in HSC cells, tracks of bulk ATAC-seq for erythroid relevant trajectories are shown below. b, HSC chromatin accessibility around rs1010473 and rs1010474 and the two CRISPR− Cas9 guide RNA pairs (ENH1 and ENH2) used to delete this region. sgRNA, single-guide RNA. c, Expression of BACH2 transcript in bulk human primary CD34+ hematopoietic stem and progenitor cells (HSPCs) three days after deletion of the BACH2 enhancer (n=6) compared to AAVS1 editing (n=3). ENH1 and ENH2 gRNA results were combined due to similar editing efficiencies. d, Schematic representation of lentivirus-mediated increased expression of BACH2 in HSPCs. Transduced HSPCs were sorted on the top and bottom 30% of GFP+ cells (GFPhi and GFPlo, respectively) and subjected to erythroid differentiation and functional evaluation. e, BACH2-GFP expression in FACS sorted populations across erythroid differentiation. Mean fluorescence intensities are indicated. f, Relative BACH2 transcript abundance on days 7 and 13 of erythroid differentiation in transduced HSPCs. g, Proportion of HBG1/2 expression relative to overall HBG1/2+HBB expression on days 7 and 13 of erythroid differentiation in transduced HSPCs. h, Frequency of F-cells across erythroid differentiation in transduced HSPCs quantified by intracellular staining of fetal hemoglobin (HbF). %HbF+ and HbF are indicated. i, Erythroid differentiation status of transduced HSPCs on days 6 and 10 of erythroid differentiation culture as assessed by surface expression of CD71 and CD235a. Note in (d-h) Each data point is representative of individual transductions.
Fig. 3
Fig. 3. Overlap of potentially causal variants at known HbF loci. ∣
Comprehensive study of the a, BCL11A and b, HBS1L-MYB loci shows many potential ancestry-specific causal effects (diamond shaped points) overlapping with accessible chromatin at various cell stages of human erythropoiesis. These regions are linked to other regions via erythroid promoter-capture Hi-C interactions. Finemapped signals in the fixed-effects analysis are highlighted by a triangle. Significant conditionally independent SNPs found in significant ATAC peaks are highlighted by a colored circle. Colored ranges above ATAC tracks correspond to statistically significant peaks. c, d, Overlap between ancestry groups of independent sentinel variants, those in accessible chromatin and 95% credible set fine mapped variants in accessible chromatin are shown at the c, BCL11A and d, HBS1L-MYB loci. Specific variants are described in Supplementary Table 9.
Fig. 4
Fig. 4. Stratification of impact on HbF levels by large-effect structural variants by polygenic variation. ∣
a, Rare deletions identified previously in individuals of Thai ancestry from case studies are shown in relation to affected genes, on hg38 coordinates. These deletions were identified in the included Thai population using a combination of mapping approaches. b, Within each known deletion category, individuals carrying these deletions show variable effects on HbF (%) levels and polygenic trait scores (PRS) derived from common single nucleotide variation, low and high were determined by less than or greater than median global PRS value, respectively.

References

    1. Sankaran VG, Orkin SH. The switch from fetal to adult hemoglobin. Cold Spring Harb Perspect Med. 2013;3(1):a011643. - PMC - PubMed
    1. Uda M, Galanello R, Sanna S, et al. Genome-wide association study shows BCL11A associated with persistent fetal hemoglobin and amelioration of the phenotype of beta-thalassemia. Proc Natl Acad Sci U S A. 2008;105(5):1620–1625. - PMC - PubMed
    1. Lettre G, Sankaran VG, Bezerra MAC, et al. DNA polymorphisms at the BCL11A, HBS1L-MYB, and beta-globin loci associate with fetal hemoglobin levels and pain crises in sickle cell disease. Proc Natl Acad Sci U S A. 2008;105(33):11869–11874. - PMC - PubMed
    1. Menzel S, Garner C, Gut I, et al. A QTL influencing F cell production maps to a gene encoding a zinc-finger protein on chromosome 2p15. Nat Genet. 2007;39(10):1197–1199. - PubMed
    1. Sankaran VG, Menne TF, Xu J, et al. Human fetal hemoglobin expression is regulated by the developmental stage-specific repressor BCL11A. Science. 2008;322(5909):1839–1842. - PubMed

Publication types