[Preprint]. 2023 Mar 15:2023.03.14.532666.
doi: 10.1101/2023.03.14.532666.

Modulation of FGF pathway signaling and vascular differentiation using designed oligomeric assemblies

Affiliations

Modulation of FGF pathway signaling and vascular differentiation using designed oligomeric assemblies

Natasha I Edman et al. bioRxiv. .

Update in

  • Modulation of FGF pathway signaling and vascular differentiation using designed oligomeric assemblies.
    Edman NI, Phal A, Redler RL, Schlichthaerle T, Srivatsan SR, Ehnes DD, Etemadi A, An SJ, Favor A, Li Z, Praetorius F, Gordon M, Vincent T, Marchiano S, Blakely L, Lin C, Yang W, Coventry B, Hicks DR, Cao L, Bethel N, Heine P, Murray A, Gerben S, Carter L, Miranda M, Negahdari B, Lee S, Trapnell C, Zheng Y, Murry CE, Schweppe DK, Freedman BS, Stewart L, Ekiert DC, Schlessinger J, Shendure J, Bhabha G, Ruohola-Baker H, Baker D. Edman NI, et al. Cell. 2024 Jul 11;187(14):3726-3740.e43. doi: 10.1016/j.cell.2024.05.025. Epub 2024 Jun 10. Cell. 2024. PMID: 38861993 Free PMC article.

Abstract

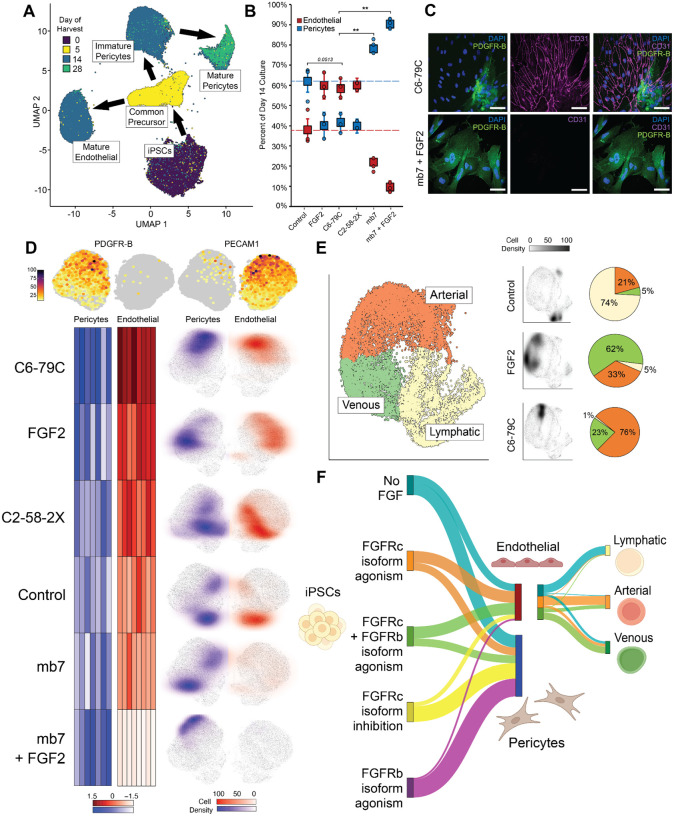
Growth factors and cytokines signal by binding to the extracellular domains of their receptors and drive association and transphosphorylation of the receptor intracellular tyrosine kinase domains, initiating downstream signaling cascades. To enable systematic exploration of how receptor valency and geometry affects signaling outcomes, we designed cyclic homo-oligomers with up to 8 subunits using repeat protein building blocks that can be modularly extended. By incorporating a de novo designed fibroblast growth-factor receptor (FGFR) binding module into these scaffolds, we generated a series of synthetic signaling ligands that exhibit potent valency- and geometry-dependent Ca2+ release and MAPK pathway activation. The high specificity of the designed agonists reveal distinct roles for two FGFR splice variants in driving endothelial and mesenchymal cell fates during early vascular development. The ability to incorporate receptor binding domains and repeat extensions in a modular fashion makes our designed scaffolds broadly useful for probing and manipulating cellular signaling pathways.

Keywords: De novo protein design; FGF signaling; binder design; cryo-EM; endothelial cell differentiation; iPSCs; oligomeric scaffolds.


Conflict of interest statement

Competing interests The authors filed a patent application.

Figures

Figure 1:
Figure 1:. Biophysical characterization of designed protein oligomers.
From left to right: design model, size-exclusion chromatogram, SAXS data comparison of model to experimental data (A) C4–181, (B) C4–717, (C) C6–714, (D) C6–46, (E) C4–131 design model, size-exclusion chromatogram, SAXS data analysis, Right: cryo-EM 2D class average, cryo-EM map overlay to design model (cyan) top and side view (F) C4–814 design model, size-exclusion chromatogram, SAXS data analysis, Right: cryo-EM 2D class average, cryo-EM map superimposed to design model (cyan) top and side view (G) C6–79 SEC characterization and SAXS fit using both the C8 design model and the C6 dock. Right: cryo-EM 2D class average, cryo-EM map superimposed to design model top and side view.
Figure 2:
Figure 2:. Repeat extensions of designed oligomers.
(A) Depiction of DHR-based repeat extension for oligomers. Each extension unit consists of 2 repeats. (B) C4–71 4-repeat, 6-repeat and 8-repeat cryo-EM maps superimposed with design model, top and side-view class averages and SAXS characterization below the cryo-EM maps of the different repeat extension variants. Bottom Left: SEC overlay of the individual structures. (C) C6–71 4-repeat, 6-repeat and 8-repeat cryo-EM maps superimposed with design model, top and side-view class averages and SAXS characterization below the cryo-EM maps of the different repeat extension variants. Bottom Left: SEC overlay of the individual structures. (D) C8–71 4-repeat, 6-repeat and 8-repeat cryo-EM maps superimposed with design model, top and side-view class averages and SAXS characterization below the cryo-EM maps of the different repeat extension variants. Bottom Left: SEC overlay of the individual structures.
Figure 3:
Figure 3:. Cryo-EM structural analysis.
(A) C6–79 alignment of design model (grey) with cryo-EM structure (cyan) in top and side view. Structures align well with an RMSD of 2.85 Å (B) C8–71 alignment of design model (grey) with cryo-EM structure (cyan) in top and side view. Structures are in good agreement with an RMSD of 1.79 Å.
Figure 4:
Figure 4:. Modulation of FGFR signaling by designed agonists.
(A) Cartoon model of C6–79C_mb7 oligomer (blue and purple) engaging six FGFR2 receptors (grey). Top left: Cartoon model of mb7 engaging FGFR4 domain 3 (pdb ID: 7N1J). Right: Natural geometry of signaling competent FGF2 (orange) with FGFR1c (grey) and heparin (red) (pdb ID: 1FQ9) together with superimposed mb7 (purple). (B) Signaling response to a library of oligomers presenting mb7 in CHO-R1c cells, analyzed through western blot. Top: Cartoons of oligomers presenting mb7 at their N- or C-termini; distances between neighboring chains are shown above their respective treatments. Total FGFR1 and ERK loading controls can be found in Supplementary Figure 23. (C) Dose-response curves of selected designs via phosphoflow for pERK1/2 stimulation. Error bars represent SEM from three independent biological repeats. (D) Single-particle tracking of FGFR1 receptors on the cell surface. (E) Intensity histograms of receptor clusters on the cell surface reveals receptor clustering induced via oligomerization. (F) Signaling response to FGF2, mb7, C6–79C_mb7 or mb7 + FGF2 in L6-R1c (top) or L6-R1b (bottom) cells (G) Dose-response curves of selected designs through intracellular calcium release. Error bars represent SEM from three independent biological repeats. (H) Comparison of a calcium intensity signaling trajectory after treatment with FGF2 (with or without heparin) or C6–79C_mb7 at 10 nM each. Right: Exemplary images comparing the calcium response exhibited in CHO-R1c cells following treatment with FGF2 or C6–79C_mb7 at 10 nM over three different timepoints (0:00, 2:20 and 7:30 min). Scale Bars: 2 μm (D), 66.3 μm(H).
Figure 5:
Figure 5:. Control over vascular differentiation with designed agonists and inhibitors.
(A) UMAP graph of all sequenced cells colored by day of harvest, along with given cluster annotations. (B) Proportion of endothelial and pericyte cells generated at day 14 following treatment with FGF2, C2–58-2X_mb7, C6–79C_mb7, mb7 alone, or mb7 in combination with FGF2. Error bars represent SEM from three independent biological repeats. (C) Representative immunofluorescence staining of differentiated cells treated with C6–79C_mb7 or mb7 in combination with FGF2, with anti-PDGFR-B and anti-CD31 to specifically mark pericytes and endothelial cells, respectively. Scale bar: 20 μm. (D) Clustered heatmap comparing the normalized average expression of selected endothelial and pericyte cell maturity markers across all analyzed treatment conditions. Marker gene names in the heatmap (left to right) can be found in Supplementary Table VII in the endothelial or pericyte rows (top to bottom) respectively. The cell density plots show specific cell populations enriched by the individual treatments. (E) Proportion of arterial, lymphatic or venous endothelial cells generated at day 14 following treatment with FGF2 or C6–79C_mb7. (F) Control over vascular differentiation. At the first bifurcation, the designs enable selective formation of endothelial cells or pericytes, and in subsequent endothelial cell differentiation, synthetic agonist treatments bias towards arterial fate.

References

    1. Garcia-Parajo M. F., Cambi A., Torreno-Pina J. A., Thompson N. & Jacobson K. Nanoclustering as a dominant feature of plasma membrane organization. J. Cell Sci. 127, 4995–5005 (2014). - PMC - PubMed
    1. Wu H. Higher-order assemblies in a new paradigm of signal transduction. Cell 153, 287–292 (2013). - PMC - PubMed
    1. Mayer B. J. & Yu J. Protein Clusters in Phosphotyrosine Signal Transduction. J. Mol. Biol. 430, 4547–4556 (2018). - PMC - PubMed
    1. Westerfield J. M. & Barrera F. N. Membrane receptor activation mechanisms and transmembrane peptide tools to elucidate them. J. Biol. Chem. 295, 1792–1814 (2020). - PMC - PubMed
    1. Zhang K., Gao H., Deng R. & Li J. Emerging Applications of Nanotechnology for Controlling Cell-Surface Receptor Clustering. Angewandte Chemie - International Edition 58, 4790–4799 (2019). - PubMed

Publication types