[Preprint]. 2023 Mar 20:2023.03.16.532940.
doi: 10.1101/2023.03.16.532940.

Stability and heterogeneity in the anti-microbiota reactivity of human milk-derived Immunoglobulin A

Affiliations

Stability and heterogeneity in the anti-microbiota reactivity of human milk-derived Immunoglobulin A

Chelseá B Johnson-Hence et al. bioRxiv. .

Update in

Abstract

Immunoglobulin A (IgA) is secreted into breast milk and is critical to both protecting against enteric pathogens and shaping the infant intestinal microbiota. The efficacy of breast milk-derived maternal IgA (BrmIgA) is dependent upon its specificity, however heterogeneity in BrmIgA binding ability to the infant microbiota is not known. Using a flow cytometric array, we analyzed the reactivity of BrmIgA against bacteria common to the infant microbiota and discovered substantial heterogeneity between all donors, independent of preterm or term delivery. We also observed intra-donor variability in the BrmIgA response to closely related bacterial isolates. Conversely, longitudinal analysis showed that the anti-bacterial BrmIgA reactivity was relatively stable through time, even between sequential infants, indicating that mammary gland IgA responses are durable. Together, our study demonstrates that the anti-bacterial BrmIgA reactivity displays inter-individual heterogeneity but intra-individual stability. These findings have important implications for how breast milk shapes the development of the infant microbiota and protects against Necrotizing Enterocolitis.

Summary: We analyze the ability of breast milk-derived Immunoglobulin A (IgA) antibodies to bind the infant intestinal microbiota. We discover that each mother secretes into their breast milk a distinct set of IgA antibodies that are stably maintained over time.


Figures
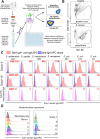
Figure 1 –
Figure 1 –. A flow cytometric array for measuring the anti-bacterial specificity of breast milk-derived IgA.
A) Design of the flow cytometric array. Made with BioRender.com B) Examples of SYTO BC+/SSCDim staining used to discriminate bacteria from debris/bubbles in the flow cytometer (control is empty well stained with SYTO BC). Numbers represent the percent of events inside the gate. C) Examples of the magnitude of anti-bacterial IgA binding detected in our array comparing two donors (9 and 10) that differ in their anti-bacterial IgA responses. The bottom row shows the reactivity of an anti-HIV IgA antibody against the same bacterial isolates. Numbers in red represent the gMFI of that sample. D) Breast milk-derived IgA reactivity, from several donors (as indicated) against the environmental bacteria Bradyrhizobium japonicum.
Figure 2 –
Figure 2 –. Heterogeneity in the anti-bacterial reactivity of breast milk-derived IgA.
Donor milk samples (term infants; >37 weeks gestational age) were analyzed with our flow cytometric array (1A). A) Heat map of normalized anti-bacterial IgA binding affinity of different donors. Hierarchical clustering (Spearman). The range of the normalized values across each row is indicated on the left hand column. B) Scatter graph showing the normalized anti-bacterial IgA binding values for each donor (each color represents a different donor). C) Scatter graph of the normalized BrmIgA binding to different isolates of E. coli separated according to donors selected from the analysis in (2A). D-E) A correlation network analysis was performed to describe which anti-bacterial IgA responses were predictive. D) Network diagram indicating significantly correlated anti-bacterial IgA responses. E) Heat map indicating the level of correlation between different bacteria in our array. Black box drawn around Enterobacteriaceae family taxa.
Figure 3 –
Figure 3 –. Heterogeneity in the breast milk-derived anti-bacterial IgA reactivity from donors who delivered preterm infants.
Donor milk samples (preterm infants; 24–35 weeks gestational age) were analyzed with our flow cytometric array (1A). A) Bar graph showing the concentration of IgA purified from donor milk samples from mothers of term and preterm infants (ELISA). B) Heat map of normalized anti-bacterial binding affinity of different preterm donors. (Spearman). Samples where no data was collected due to insufficient bacteria in the well are colored grey. C) Scatter graph showing the normalized anti-bacterial IgA binding values for each preterm donor (each color represents a different donor). D) Principal Component Analysis (PCA) comparing aggregate anti-bacterial IgA binding between preterm and term samples.
Figure 4 –
Figure 4 –. Temporal stability of anti-bacterial maternal IgA reactivity within one childbirth/infant.
Multiple milk samples were collected from different donors over time and analyzed with our flow cytometric array (1A). A) Heat map of normalized anti-bacterial binding affinity of different donors. Hierarchical clustering (Spearman) of various donors is indicated by colored bars above and below the heatmap. Date of collection indicated on heatmap: D##, where the number is days post-delivery) B) Scatter graph showing the normalized anti-bacterial IgA binding values for each sample from longitudinally collected donors (each color represents a different donor; from 4A). C-D) PCA of the aggregate anti-bacterial IgA binding of longitudinally collected samples. Each donor colored as in 4A. C) PCA of individual longitudinally collected samples where symbols indicate the time of collection (week post delivery). D) PCA from C where ellipses indicate the maximum variance for each donor cluster along each axis. No ellipses are drawn for samples where fewer than four samples were available.
Figure 5 –
Figure 5 –. Stability of the breast milk-derived anti-bacterial IgA reactivity through sibling infants.
Breast milk samples were collected from consecutive siblings and analyzed with our flow cytometric array (1A). A) Heat map of normalized anti-bacterial binding affinity of different donors. Hierarchical clustering (Spearman) of various donors is indicated by colored bars above and below the heatmap that correspond to each donor. B) PCA of aggregate anti-bacterial samples where each donor is displayed in a different color (from 5A). The first sibling is indicated by a circle and the second sibling a triangle. Samples colored as in 5A. C) Paired Student’s t-tests were calculated comparing the IgA binding of each donor between infant one and infant two for each bacterial taxon. The mean change ((Infant 2 – Infant 1; taxa 1) + (Infant 2 – Infant 1; taxa x))/37 (#of taxa) for each paired test was calculated and graphed. Significant increase in 2nd infant = ‘up’ triangle; significant decrease in 2nd infant = ‘down’ triangle; no statistical significance = circle. Colors are according to 5A. See Supplemental Figure 3 for each Paired Student’s t test.
Figure 6 –
Figure 6 –. Holder pasteurization reduces the bacterial binding properties of breast milk-derived IgA
Breast milk samples from four donors were split into two where one half was pasteurized (62.5°C for 30 minutes) while the other untreated as a control. IgA was then isolated from both halves and analyzed on our flow cytometric array (1A). A) Paired Student’s t-test (***p<0.001) of the IgA concentration (mg/mL) of control (blue) and pasteurized samples (red), as measured by ELISA . B) Paired Student’s t-tests comparing control (blue ) and Holder pasteurized (red) milk samples from the same donor. Each dot represents a different bacterial taxon. ****p<0.0001.

References

    1. Ackerman M.E., Das J., Pittala S., Broge T., Linde C., Suscovich T.J., Brown E.P., Bradley T., Natarajan H., Lin S., Sassic J.K., O’Keefe S., Mehta N., Goodman D., Sips M., Weiner J.A., Tomaras G.D., Haynes B.F., Lauffenburger D.A., Bailey-Kellogg C., Roederer M., and Alter G.. 2018. Route of immunization defines multiple mechanisms of vaccine-mediated protection against SIV. Nat Med 24:1590–1598. - PMC - PubMed
    1. Adhisivam B., Vishnu Bhat B., Rao K., Kingsley S.M., Plakkal N., and Palanivel C.. 2018. Effect of Holder pasteurization on macronutrients and immunoglobulin profile of pooled donor human milk. J Matern Fetal Neonatal Med 1–4. - PubMed
    1. Bemark M., Hazanov H., Stromberg A., Komban R., Holmqvist J., Koster S., Mattsson J., Sikora P., Mehr R., and Lycke N.Y.. 2016. Limited clonal relatedness between gut IgA plasma cells and memory B cells after oral immunization. Nat Commun 7:12698. - PMC - PubMed
    1. Bode L. 2018. Human Milk Oligosaccharides in the Prevention of Necrotizing Enterocolitis: A Journey From in vitro and in vivo Models to Mother-Infant Cohort Studies. Front Pediatr 6:385. - PMC - PubMed
    1. Bondt A., Dingess K.A., Hoek M., van Rijswijck D.M.H., and Heck A.J.R.. 2021. A Direct MS-Based Approach to Profile Human Milk Secretory Immunoglobulin A (IgA1) Reveals Donor-Specific Clonal Repertoires With High Longitudinal Stability. Front Immunol 12:789748. - PMC - PubMed

Publication types