

This is a preprint.
Risk factors for eight common cancers revealed from a phenome-wide Mendelian randomisation analysis of 378,142 cases and 485,715 controls
- PMID: 36993383
- PMCID: PMC10055507
- DOI: 10.21203/rs.3.rs-2587058/v1
Risk factors for eight common cancers revealed from a phenome-wide Mendelian randomisation analysis of 378,142 cases and 485,715 controls
Update in
-
Phenome-wide Mendelian randomisation analysis of 378,142 cases reveals risk factors for eight common cancers.Nat Commun. 2024 Mar 25;15(1):2637. doi: 10.1038/s41467-024-46927-z. Nat Commun. 2024. PMID: 38527997 Free PMC article.
Abstract
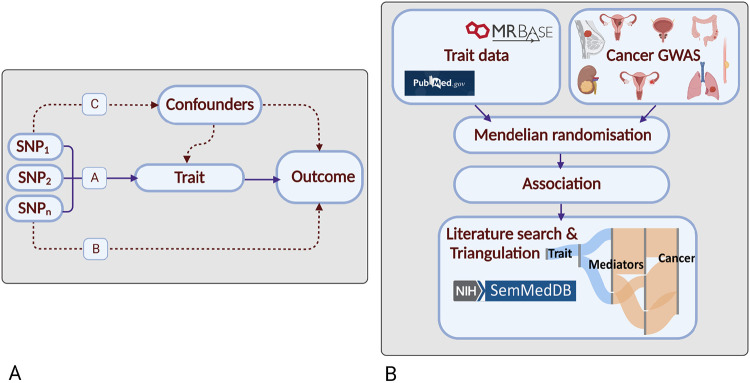
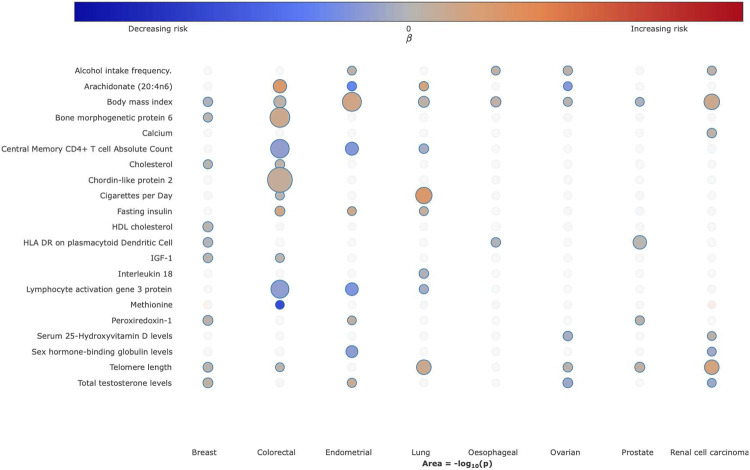
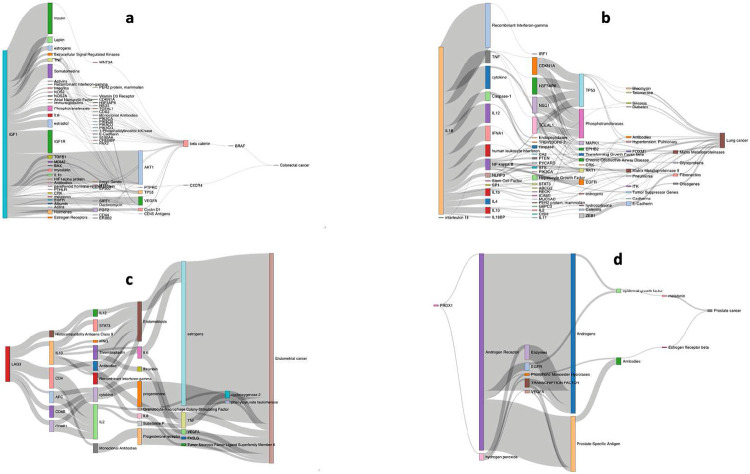
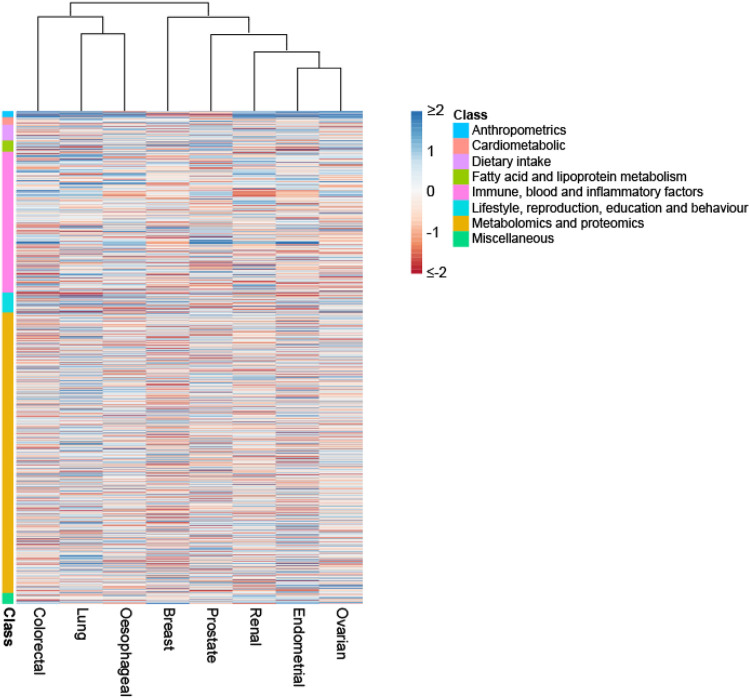
For many cancers there are few well-established risk factors. Summary data from genome-wide association studies (GWAS) can be used in a Mendelian randomisation (MR) phenome-wide association study (PheWAS) to identify causal relationships. We performed a MR-PheWAS of breast, prostate, colorectal, lung, endometrial, oesophageal, renal, and ovarian cancers, comprising 378,142 cases and 485,715 controls. To derive a more comprehensive insight into disease aetiology we systematically mined the literature space for supporting evidence. We evaluated causal relationships for over 3,000 potential risk factors. In addition to identifying well-established risk factors (smoking, alcohol, obesity, lack of physical activity), we provide evidence for specific factors, including dietary intake, sex steroid hormones, plasma lipids and telomere length as determinants of cancer risk. We also implicate molecular factors including plasma levels of IL-18, LAG-3, IGF-1, CT-1, and PRDX1 as risk factors. Our analyses highlight the importance of risk factors that are common to many cancer types but also reveal aetiological differences. A number of the molecular factors we identify have the potential to be biomarkers. Our findings should aid public health prevention strategies to reduce cancer burden. We provide a R/Shiny app (https://mrcancer.shinyapps.io/mrcan/) to visualise findings.
Keywords: Cancer; Mendelian randomisation; aetiology; genome wide association study; risk.
Conflict of interest statement
CONFLICT-OF-INTEREST DISCLOSURE The authors declare no competing financial interests.
Figures
References
-
- Sung H. et al. Global Cancer Statistics 2020: GLOBOCAN Estimates of Incidence and Mortality Worldwide for 36 Cancers in 185 Countries. CA Cancer J. Clin. 71, 209–249 (2021). - PubMed
-
- International Agency for Research on Cancer. World Cancer Report 2008. (International Agency for Research on Cancer, 2008).
-
- Thompson J. Burgess S, Thompson S. Mendelian Randomization: Methods for Using Genetic Variants in Causal Estimation. Boca Raton: CRC Press. Biometrics vol. 73 356–356 Preprint at 10.1111/biom.12674 (2017). - DOI
Publication types
Grants and funding
LinkOut - more resources
Full Text Sources
Miscellaneous
