[Preprint]. 2023 Mar 21:2023.03.17.533227.
doi: 10.1101/2023.03.17.533227.

A Spatiotemporal Map of Co-Receptor Signaling Networks Underlying B Cell Activation

Affiliations

A Spatiotemporal Map of Co-Receptor Signaling Networks Underlying B Cell Activation

Katherine J Susa et al. bioRxiv. .

Update in

Abstract

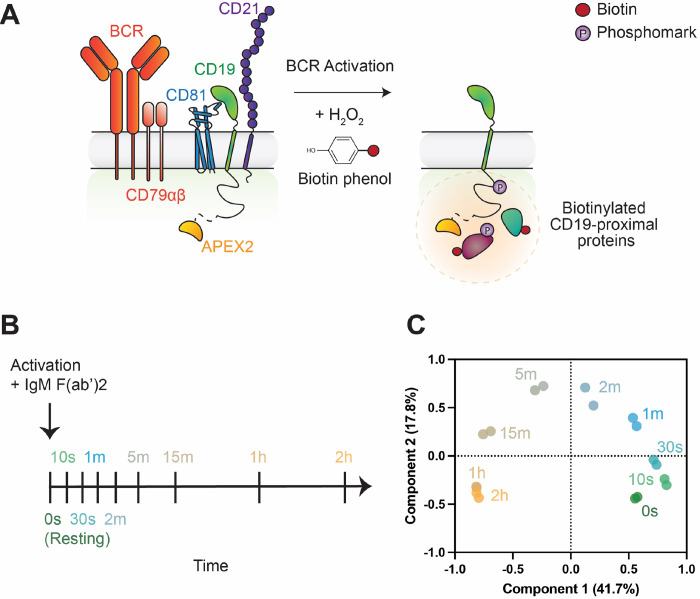
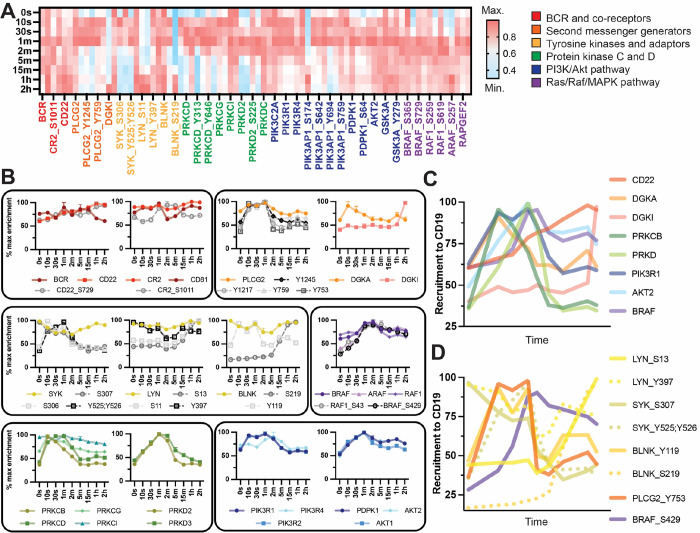
The B cell receptor (BCR) signals together with a multi-component co-receptor complex to initiate B cell activation in response to antigen binding. This process underlies nearly every aspect of proper B cell function. Here, we take advantage of peroxidase-catalyzed proximity labeling combined with quantitative mass spectrometry to track B cell co-receptor signaling dynamics from 10 seconds to 2 hours after BCR stimulation. This approach enables tracking of 2,814 proximity-labeled proteins and 1,394 quantified phosphosites and provides an unbiased and quantitative molecular map of proteins recruited to the vicinity of CD19, the key signaling subunit of the co-receptor complex. We detail the recruitment kinetics of essential signaling effectors to CD19 following activation, and then identify new mediators of B cell activation. In particular, we show that the glutamate transporter SLC1A1 is responsible for mediating rapid metabolic reprogramming immediately downstream of BCR stimulation and for maintaining redox homeostasis during B cell activation. This study provides a comprehensive map of the BCR signaling pathway and a rich resource for uncovering the complex signaling networks that regulate B cell activation.


Figures

Figure 1.
Figure 1.. Overview of CD19-APEX system.
(A) Schematic of CD19-APEX proximity labeling. CD19, the signaling subunit of the B cell co-receptor complex, is tagged with the ascorbate peroxide APEX2 on its C-terminus. In the presence of hydrogen peroxide (H2O2), APEX2 converts biotin phenol into a biotin phenoxy radical, which then covalently labels proteins within close spatial proximity (about 20 nm) of the APEX2 fusion. (B) Timeline of the eight time points at which CD19-APEX cells were labeled after activation. (C) Principal component analysis of biological replicates.
Figure 2.
Figure 2.. Response patterns to BCR stimulation.
(A) Enrichment pattern heat map of all proteins and phosphosites with a fold change difference of at least 2.5 upon activation, highlighting five distinct patterns of response revealed by hierarchical clustering. Each protein’s enrichment level across different time points is normalized to its maximum enrichment signal. Enrichment profile of three exemplary proteins showing: (B) an early enrichment response pattern, (C) a late enrichment response pattern, (D) a sustained enrichment response pattern, (E) an early depletion response pattern, and (F) a late depletion response pattern. Error bars represent mean ± SEM of two biological replicates. In all panels, phospho-marks are annotated with the protein name followed by “_amino acid position” of the phosho-mark.
Figure 3.
Figure 3.. Kinetics of recruitment of core components of the BCR signaling pathway to CD19.
(A) Enrichment pattern heat map of known components of the BCR signaling pathway, grouped by pathway. (B) Enrichment profiles of known components of the BCR signaling pathway, highlighting the distinct patterns of response of each member. Error bars represent mean ± SEM of two biological replicates, and dashed grey lines represent phosphomarks. (C) Summary of the proteins recruited to CD19 during activation. Time is plotted on a log10 scale for better separation of the early time points. (D) Summary of phosphorylation within the CD19 microenvironment during activation. Time is plotted on a log10 scale for better separation of the early time points. Panels C-D contain the same data shown in the Panel A heatmap plotted in different ways to highlight distinct patterns of response. In all panels, phospho-marks are annotated with the protein name followed by “_amino acid position” of the phosho-mark.
Figure 4.
Figure 4.. CD19-APEX2 as a resource to uncover new B cell biology.
(A) Enrichment pattern heatmap of proteins involved in cytoskeletal regulation and organization. (B) Enrichment pattern heatmap of the palmitoyltransferase ZDHHC5 and several phosphorylation sites. Error bars represent mean ± SEM of two biological replicates. (C) Enrichment pattern heatmap of syntaxins (STX). Error bars represent mean ± SEM of two biological replicates. (D) Enrichment profile of SWAP70. Error bars represent mean ± SEM of two biological replicates. (E) Western blot of SWAP70 knockout Raji cells. “P” denotes parental Raji cells. (F) Fold change in CD69 surface staining after activation with anti-IgM F(ab’)2 in parental Raji cells and SWAP70 knockout clones. (G) Fold change in CD86 surface staining after activation with anti-IgM F(ab’)2 in parental Raji cells and SWAP70 knockout clones. For panel F and G, error bars represent mean ± SEM of three independent experiments. Statistical analysis was performed in GraphPad Prism using an unpaired t-test. *p ≤0.05; **p ≤ 0.01; ***p ≤ 0.001; ****p≤ 0.0001; ns, not significant. In all panels, phospho-marks are annotated with the protein name followed by “_amino acid position” of the phosho-mark.
Figure 5.
Figure 5.. Recruitment and functional interrogation of the glutamate transporter SLC1A1.
(A) Enrichment pattern heatmap of all members of the solute carrier (SLC) family identified in the CD19-APEX time course. Each protein’s enrichment level across different time points is normalized to its maximum enrichment signal. (B) Enrichment profile of the glutamate transporter SLC1A1. Error bars represent mean ± SEM of two biological replicates. (C) Glutamate uptake kinetics in parental Raji cells upon activation. (D) Western blot of SLC1A1 knockout Raji cells. “P” denotes parental Raji cells. (E) Glutamate uptake in parental and SLC1A1 knockout Raji cells upon activation for 2 minutes. (F) Enrichment pattern heatmap of NADPH oxidase 2 (CYBB) and glutamate dehydrogenase 2 GLUD2. Each protein’s enrichment level across different time points is normalized to its maximum enrichment signal. (G) Glutathione levels in parental and SLC1A1 knockout Raji cells in resting and activated cells, measured 48 hours after activation. (H) ROS levels in parental and SLC1A1 knockout Raji cells in resting and activated cells, measured 48 hours after activation. For Panel C, E, G, and H, error bars represent mean ± SEM of three independent experiments. Statistical analysis was performed in GraphPad Prism using an unpaired t-test. *p ≤0.05; **p ≤ 0.01; ***p ≤ 0.001; ****p≤ 0.0001; ns, not significant. In all panels, phosphor-marks are annotated with the protein name followed by “ amino acid position” of the phosho-mark.

References

    1. Cyster J.G., and Allen C.D.C. (2019). B Cell Responses: Cell Interaction Dynamics and Decisions. Cell 177, 524–540. 10.1016/j.cell.2019.03.016. - DOI - PMC - PubMed
    1. Treanor B. (2012). B-cell receptor: from resting state to activate. Immunology 136, 21–27. 10.1111/j.1365-2567.2012.03564.x. - DOI - PMC - PubMed
    1. Burger J.A., and Wiestner A. (2018). Targeting B cell receptor signalling in cancer: preclinical and clinical advances. Nat. Rev. Cancer 18, 148–167. 10.1038/nrc.2017.121. - DOI - PubMed
    1. Kristyanto H., Blomberg N.J., Slot L.M., van der Voort E.I.H., Kerkman P.F., Bakker A., Burgers L.E., ten Brinck R.M., van der Helm-van Mil A.H.M., Spits H., et al. (2020). Persistently activated, proliferative memory autoreactive B cells promote inflammation in rheumatoid arthritis. Sci. Transl. Med. 12, eaaz5327. 10.1126/scitranslmed.aaz5327. - DOI - PMC - PubMed
    1. Lipsky P.E. (2001). Systemic lupus erythematosus: an autoimmune disease of B cell hyperactivity. Nat. Immunol. 2, 764–766. 10.1038/ni0901-764. - DOI - PubMed

Publication types