[Preprint]. 2024 Oct 14:2023.03.13.531369.
doi: 10.1101/2023.03.13.531369.

Functional connectomics reveals general wiring rule in mouse visual cortex

Zhuokun Ding  1   2   3   4 Paul G Fahey  1   2   3   4 Stelios Papadopoulos  1   2   3   4 Eric Y Wang  1 Brendan Celii  1   5 Christos Papadopoulos  1 Andersen Chang  1 Alexander B Kunin  1   6 Dat Tran  1 Jiakun Fu  1 Zhiwei Ding  1 Saumil Patel  1   2   3   4 Lydia Ntanavara  1   2   3   4 Rachel Froebe  1   2   3   4 Kayla Ponder  1 Taliah Muhammad  1 J Alexander Bae  7   8 Agnes L Bodor  9 Derrick Brittain  9 JoAnn Buchanan  9 Daniel J Bumbarger  9 Manuel A Castro  7 Erick Cobos  1 Sven Dorkenwald  7   10 Leila Elabbady  9 Akhilesh Halageri  7 Zhen Jia  7   10 Chris Jordan  7 Dan Kapner  9 Nico Kemnitz  7 Sam Kinn  9 Kisuk Lee  7   11 Kai Li  10 Ran Lu  7 Thomas Macrina  7   10 Gayathri Mahalingam  9 Eric Mitchell  7 Shanka Subhra Mondal  7   8 Shang Mu  7 Barak Nehoran  7   10 Sergiy Popovych  7   10 Casey M Schneider-Mizell  9 William Silversmith  7 Marc Takeno  9 Russel Torres  9 Nicholas L Turner  7   10 William Wong  7 Jingpeng Wu  7 Wenjing Yin  9 Szi-Chieh Yu  7 Dimitri Yatsenko  1   12 Emmanouil Froudarakis  1   13   14 Fabian Sinz  1   15   16 Krešimir Josić  17 Robert Rosenbaum  18 H Sebastian Seung  7 Forrest Collman  9 Nuno Maçarico da Costa  9 R Clay Reid  9 Edgar Y Walker  19   20 Xaq Pitkow  1   5   21   22   23 Jacob Reimer  1 Andreas S Tolias  1   2   3   4   5   24
Affiliations

Functional connectomics reveals general wiring rule in mouse visual cortex

Zhuokun Ding et al. bioRxiv. .

Update in

  • Functional connectomics reveals general wiring rule in mouse visual cortex.
    Ding Z, Fahey PG, Papadopoulos S, Wang EY, Celii B, Papadopoulos C, Chang A, Kunin AB, Tran D, Fu J, Ding Z, Patel S, Ntanavara L, Froebe R, Ponder K, Muhammad T, Bae JA, Bodor AL, Brittain D, Buchanan J, Bumbarger DJ, Castro MA, Cobos E, Dorkenwald S, Elabbady L, Halageri A, Jia Z, Jordan C, Kapner D, Kemnitz N, Kinn S, Lee K, Li K, Lu R, Macrina T, Mahalingam G, Mitchell E, Mondal SS, Mu S, Nehoran B, Popovych S, Schneider-Mizell CM, Silversmith W, Takeno M, Torres R, Turner NL, Wong W, Wu J, Yin W, Yu SC, Yatsenko D, Froudarakis E, Sinz F, Josić K, Rosenbaum R, Seung HS, Collman F, da Costa NM, Reid RC, Walker EY, Pitkow X, Reimer J, Tolias AS. Ding Z, et al. Nature. 2025 Apr;640(8058):459-469. doi: 10.1038/s41586-025-08840-3. Epub 2025 Apr 9. Nature. 2025. PMID: 40205211 Free PMC article.

Abstract

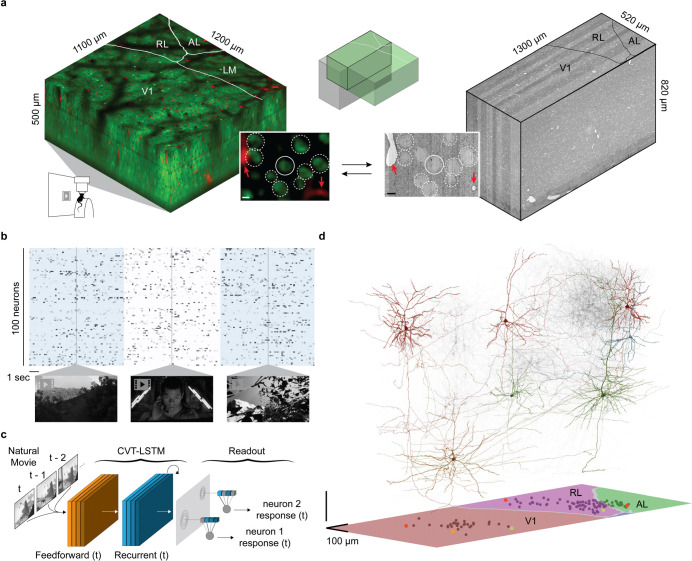
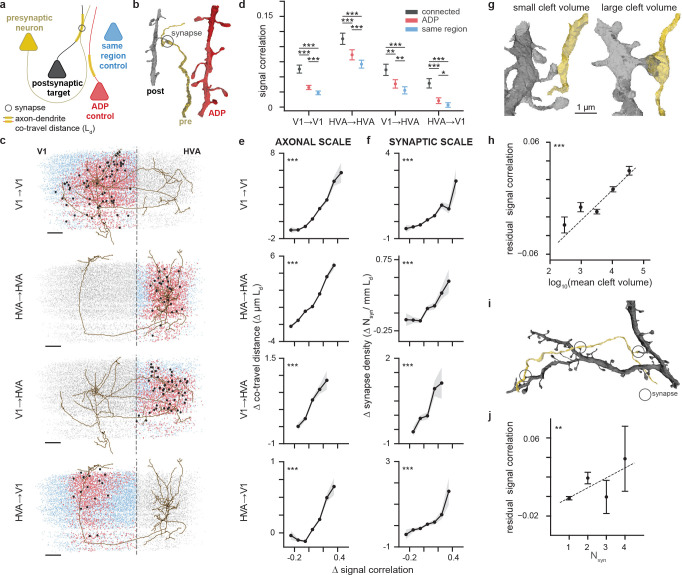
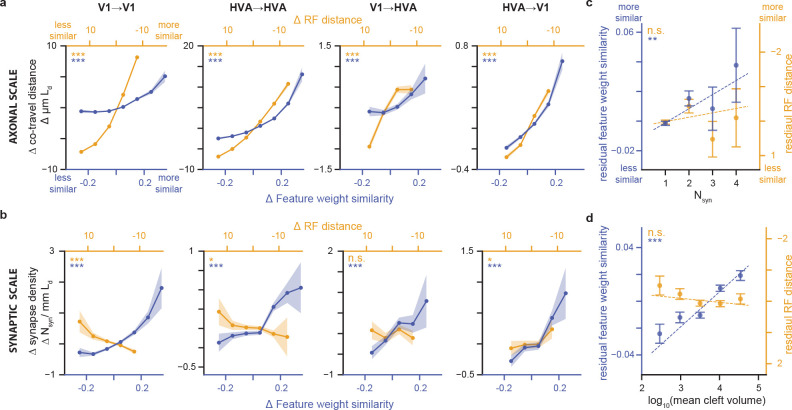
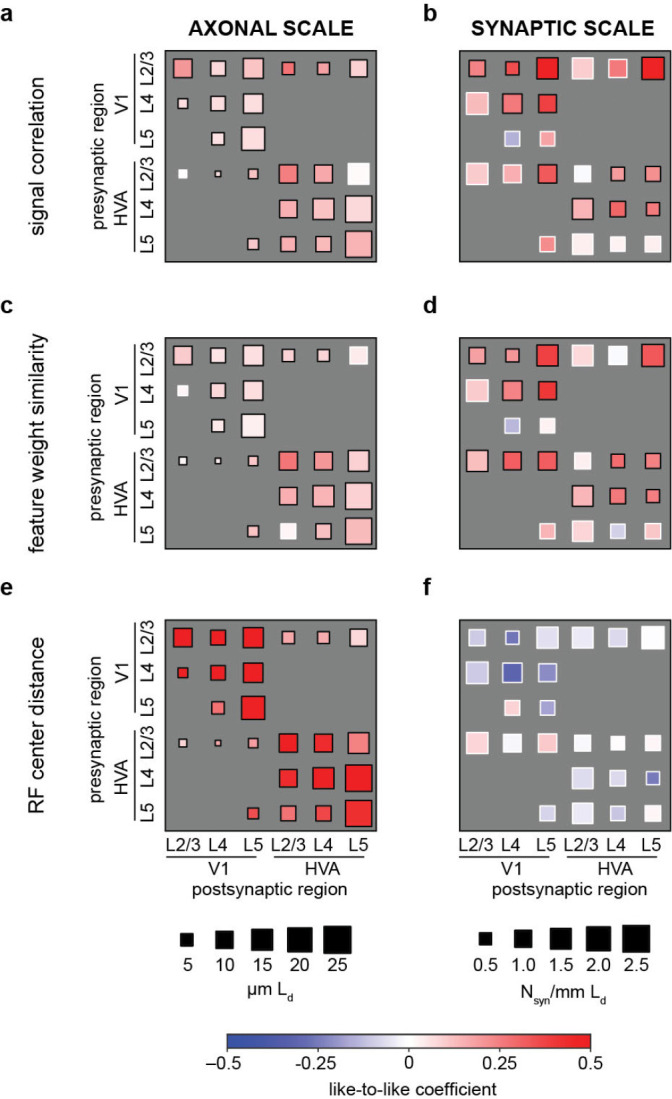
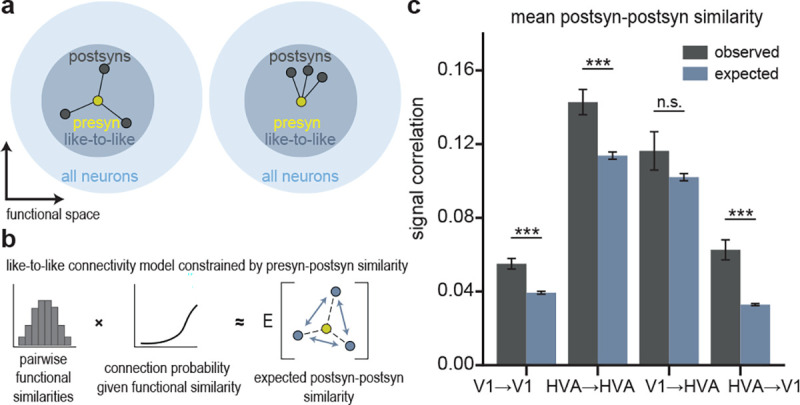
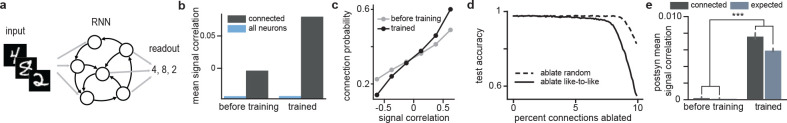
Understanding the relationship between circuit connectivity and function is crucial for uncovering how the brain implements computation. In the mouse primary visual cortex (V1), excitatory neurons with similar response properties are more likely to be synaptically connected, but previous studies have been limited to within V1, leaving much unknown about broader connectivity rules. In this study, we leverage the millimeter-scale MICrONS dataset to analyze synaptic connectivity and functional properties of individual neurons across cortical layers and areas. Our results reveal that neurons with similar responses are preferentially connected both within and across layers and areas - including feedback connections - suggesting the universality of the 'like-to-like' connectivity across the visual hierarchy. Using a validated digital twin model, we separated neuronal tuning into feature (what neurons respond to) and spatial (receptive field location) components. We found that only the feature component predicts fine-scale synaptic connections, beyond what could be explained by the physical proximity of axons and dendrites. We also found a higher-order rule where postsynaptic neuron cohorts downstream of individual presynaptic cells show greater functional similarity than predicted by a pairwise like-to-like rule. Notably, recurrent neural networks (RNNs) trained on a simple classification task develop connectivity patterns mirroring both pairwise and higher-order rules, with magnitude similar to those in the MICrONS data. Lesion studies in these RNNs reveal that disrupting 'like-to-like' connections has a significantly greater impact on performance compared to lesions of random connections. These findings suggest that these connectivity principles may play a functional role in sensory processing and learning, highlighting shared principles between biological and artificial systems.

Keywords: MICrONS; digital twin; functional connectomics; visual cortex.


Conflict of interest statement

COMPETING FINANCIAL INTERESTS XP is a co-founder of UploadAI, LLC, a company in which he has financial interests. AST is co-founder of Vathes Inc., and UploadAI LLC companies in which he has financial interests. JR is co-founder of Vathes Inc., and UploadAI LLC companies in which he has financial interests.

Figures

Figure 1.
Figure 1.. Overview of MICrONS Dataset.
a, Depiction of functionally-characterized volumes (left; GCaMP6s in green, vascular label in red) and EM (right; gray). Visual areas: primary visual cortex (V1), anterolateral (AL), lateromedial (LM) and rostrolateral (RL).The overlap of the functional 2P (green) and structural EM (gray) volumes from which somas were recruited is depicted in the top inset. The bottom inset shows an example of matching structural features in the 2P and EM volumes, including a soma constellation (dotted white circles) and unique local vasculature (red arrowheads), used to build confidence in the manually assigned 2P-EM cell match (central white circle). All MICrONS data are from a single animal. Scale bars = 5μm. b, Deconvolved calcium traces from 100 imaged neurons. Alternating blue/white column overlay represents the duration of serial video trials, with sample frames of natural videos depicted below. Parametric stimuli (not pictured) were also shown for a shorter duration than natural videos. c, Schematic of the digital twin deep recurrent architecture. During training, movie frames (left) are input into a shared convolutional deep recurrent core (orange and blue layers, CVT=convolutional vision transformer, LSTM=long short-term memory) resulting in a learned representation of local spatiotemporal stimulus features. Each neuron is associated with a location (spatial component in the visual field (gray layer) to read out feature activations (shaded blue vectors), and the dot product with the neuron-specific learned feature weights (shaded lines, feature component) results in the predicted mean neural activation for that time point. d, Depiction of 148 manually proofread mesh reconstructions (gray), including representative samples from Layer 2/3 (red), Layer 4 (blue), Layer 5 (green), and Layer 6 (gold). Bottom panel: presynaptic soma locations relative to visual area boundaries.
Figure 2.
Figure 2.. Neurons with higher signal correlation are more likely to form synapses.
a, Schematic illustrating inclusion criteria for anatomical controls. For each proofread presynaptic neuron (yellow), control neurons for its true postsynaptic partners (black) are drawn either from unconnected neurons with non-zero axon-dendrite co-travel distance (Axonal-Dendritic Proximity (“ADP”), red), or unconnected neurons with zero axon-dendrite co-travel distance located in the same cortical region (blue). The axon-dendrite co-travel distance (Ld, yellow highlight on dendrites) is quantified as the total skeletal length of dendrite within 5 μm from any point on the presynaptic axon. A synapse is indicated with a gray circle. b, Representative meshes demonstrating a true presynaptic (“pre”, yellow axon) to postsynaptic (“post”, black dendrite) pair and an axonal-dendritic proximity control (“ADP”, red dendrite). c, Presynaptic neuron axons plotted in EM cortical space for the four projection types (V1→V1, HVA→HVA, V1→HVA, HVA→V1) along with soma centroids of connected partners (black dots), ADP control neurons (red dots), same area control neurons (blue dots) and all other functionally matched neurons that are not used as controls (gray dots). The same presynaptic neuron is plotted for both the V1→V1 and V1→HVA group, and another neuron is used for both the HVA→HVA and HVA→V1 groups to demonstrate that a single presynaptic neuron can be represented in multiple projection types. Dashed line represents the boundary between V1 and HVA. Scale bar: 100μm d, Mean signal correlation is different (mean ± sem, paired t-test) between synaptically-connected partners (black), ADP controls (red), and same region controls (blue). This relationship was observed for within-area (V1→V1, HVA→HVA), feedforward (V1→HVA), and feedback (HVA→V1) connectivity. For details, see Supplemental Tab. 2 e, Axon-dendrite co-travel distance (μmLd) increases in a graded fashion with signal correlation. ΔLd and Δ signal correlation are the deviations from the mean for each presynaptic neuron. For reference, the mean Ld for each projection type is: V1→V1, 9.03μm; HVAHVA, 9.83μm; V1HVA, 4.17μm; HVAV1, 1.53μm. For details of the analysis, see Supplemental Tab. 3, 5 The shaded regions are bootstrap-based standard deviations. f As in e, but with synapse density (Nsyn/mmLd). Synapse density increases in a graded fashion with signal correlation, for within-area (V1→V1, HVA→HVA), feedforward (V1→ HVA), and feedback (HVA→V1) connectivity. For reference, the mean Nsyn/mmLd for each projection type is: V1→V1, 1.12 synapses / mmLd; HVA→HVA, 0.83 synapses / mmLd; V1→HVA, 1.55 synapses / mmLd; HVA→V1, 1.26 synapses / mmLd. For details of the analysis, see Supplemental Tab. 4, 6 g, Representative meshes demonstrating synapses with small cleft volume (896 voxels, left) and large cleft volume (41716 voxels, right). h, Synapse size (log10 cleft volume in voxels) is positively correlated with signal correlation (p-values are from linear regression, residual signal correlation is obtained after regressing out the baseline effects on signal correlation due to differences in Ld). i, Representative meshes demonstrating a multisynaptic presynaptic (yellow) to postsynaptic (black) pair. j, Signal correlations increase with number of synapses (p-values are from linear regression, residual signal correlation is obtained after regressing out the baseline effects on signal correlation due to differences in Ld). (For all panels, * = p-value < 0.05, ** = p-value < 0.01, *** = p-value < 0.001, multiple comparison correction by BH procedure)
Figure 3.
Figure 3.. Feature weight similarity predicts synaptic selectivity better than receptive field center distance.
a, Axon-dendrite co-travel distance increases with feature weight similarity and decreasing RF center distance for within-area (V1→V1, HVA→HVA), feedforward (V1→ HVA), and feedback (HVA→V1) connectivity. b,, Synapse density increases with feature weight similarity, but not with RF distance, except for HVAtoV1 projections. c, Multiple synapses are associated with increasing feature similarity, but not receptive field center distance, after regressing out Ld. d,, Only feature similarity (not receptive field center distance) is associated with an increase in cleft volume, after regressing out Ld. (For all panels, * = p-value < 0.05, ** = p-value < 0.01, *** = p-value < 0.001, p-values are corrected for multiple comparisons using BH procedure, for details, see Supplemental Tab. 11, 13, 15, 17, 12, 14, 16, 18,)
Figure 4.
Figure 4.. Like-to-like effects are widespread but vary across brain areas, cortical layers, and tuning similarity metrics.
a-f, Degree of like-to-like broken down by area and layer membership measured at axonal (a, c, e) and synaptic scales (b, d, f). Colorbar: like-to-like coefficients, red is more like-to-like. For axonal scale, box size represents axon-dendrite co-travel distance (μmLd). For synaptic scale, box size represents synapse density (Nsyn/mmLd). Like-to-like coefficients are the coefficients of GLMMs fitted to predict axon-dendrite co-travel distance or synapse density with the corresponding functional similarity. (black border = significant at p-value < 0.05, white border = p-value > 0.05, by Wald test after BH correction for multiple comparisons, for details see Supplemental Tab. 26, 25, 28, 27, 30, 29).
Figure 5.
Figure 5.. Postsynaptic neurons with a common input are more functionally similar to each other than expected from a pairwise like-to-like rule.
a, Left: Schematic illustrating the null hypothesis that postsynaptic neurons (gray circles, “postsyns”) of a common presynaptic neuron (yellow circle, “presyn”) have no additional feature similarity with each other beyond their like-to-like similarity with their common presyn. In this scenario, postsyns are distributed uniformly around the presyn in the “like-to-like” region of functional space (dark blue region). Right: Schematic illustrating the alternative hypothesis that the postsynaptic neurons are closer in functional space than predicted from a pairwise like-to-like rule, equivalent to being clustered non-uniformly within the “like-to-like” region. b, Schematic illustrating the functional connectivity model used to simulate the null hypothesis in a. Pairwise functional measurements (left) — including signal correlations, feature weight similarity and receptive field location distance — were passed through a function relating functional similarity to connection probability. Then, within this modeled network, we computed the pairwise similarity of all postsyns downstream of a common presyn (right). In c, we compare the actual postsynaptic functional similarity we observed in the data (black) to the expected postsyn similarity as determined from the model (blue). In three out of four area comparisons, we find that postsyns are significantly more similar to each other than expected from a pairwise like-to-like rule.
Figure 6.
Figure 6.. Like-to-like connectivity in an RNN.
a, A vanilla RNN was provided images as inputs and weights were trained so that a readout of the final state identifies the input’s label. b, Mean signal correlations among all (blue) and connected (black) neuron pairs for the same RNN before (left) and after (right) training. Neurons were classified as connected when their weights exceeded a fixed threshold. c, Connection probability as a function of signal correlation for the same network before (gray) and after (black) training. d, Test accuracy of the network as a function of the number of connections ablated when ablating random (dashed) or like-to-like (solid) connections. Connections were classified as like-to-like whenever the weight and signal correlation both exceeded a fixed threshold. e, Mean post-post signal correlations and the expected post-post signal correlation given a pairwise model similar to Fig. 5c before and after training.

References

    1. Bock D. D., Lee W.-C. A., Kerlin A. M., Andermann M. L., Hood G., Wetzel A. W., Yurgenson S., Soucy E. R., Kim H. S., and Reid R. C.. Network anatomy and in vivo physiology of visual cortical neurons. Nature, 471(7337):177–182, Mar. 2011. - PMC - PubMed
    1. Braitenberg V. and Schüz A.. Cortex: Statistics and geometry of neuronal connectivity. Springer Science & Business Media, Mar. 2013.
    1. Cadena S. A., Denfield G. H., Walker E. Y., Gatys L. A., Tolias A. S., Bethge M., and Ecker A. S.. Deep convolutional models improve predictions of macaque v1 responses to natural images. PLoS computational biology, 15(4):e1006897, 2019. - PMC - PubMed
    1. Celii B., Papadopoulos S., Ding Z., Fahey P. G., Wang E., Papadopoulos C., Kunin A. B., Patel S., Alexander Bae J., Bodor A. L., Brittain D., Buchanan J., Bumbarger D. J., Castro M. A., Cobos E., Dorkenwald S., Elabbady L., Halageri A., Jia Z., Jordan C., Kapner D., Kemnitz N., Kinn S., Lee K., Li K., Lu R., Macrina T., Mahalingam G., Mitchell E., Mondal S. S., Mu S., Nehoran B., Popovych S., Schneider-Mizell C. M., Silversmith W., Takeno M., Torres R., Turner N. L., Wong W., Wu J., Yu S.-C., Yin W., Xenes D., Kitchell L. M., Rivlin P. K., Rose V. A., Bishop C. A., Wester B., Froudarakis E., Walker E. Y., Sinz F., Sebastian Seung H., Collman F., da Costa N. M., Clay Reid R., Pitkow X., Tolias A. S., and Reimer J.. NEURD: automated proofreading and feature extraction for connectomics. bioRxiv, Apr. 2024. URL 10.1101/2023.03.14.532674v4. - DOI - PMC - PubMed
    1. Cossell L., Iacaruso M. F., Muir D. R., Houlton R., Sader E. N., Ko H., Hofer S. B., and Mrsic-Flogel T. D.. Functional organization of excitatory synaptic strength in primary visual cortex. Nature, 518(7539):399–403, 2015. - PMC - PubMed

Publication types