[Preprint]. 2023 Mar 15:2023.03.14.532615.
doi: 10.1101/2023.03.14.532615.

Insufficient evidence for natural selection associated with the Black Death

Affiliations

Insufficient evidence for natural selection associated with the Black Death

Alison R Barton et al. bioRxiv. .

Update in

Abstract

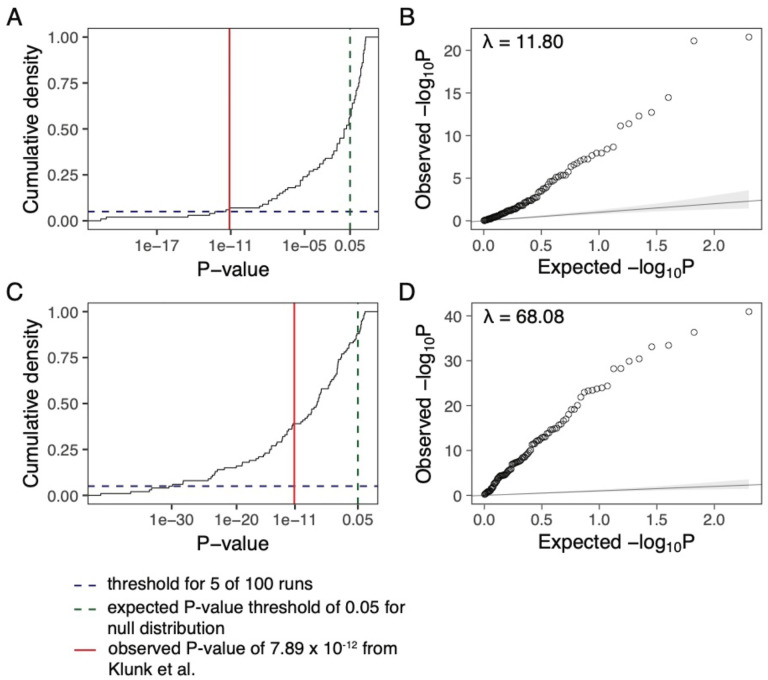
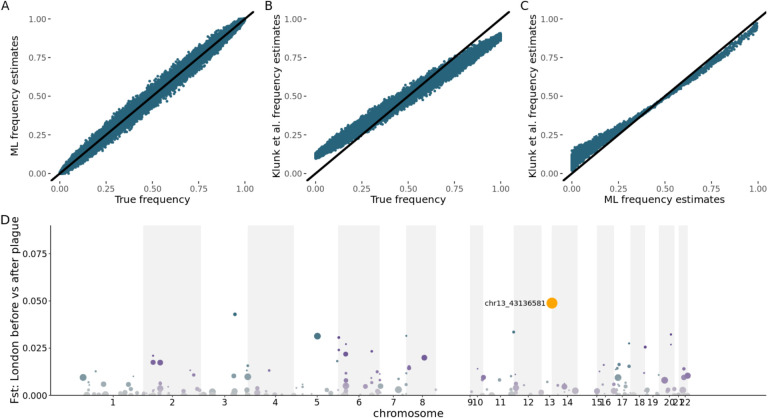
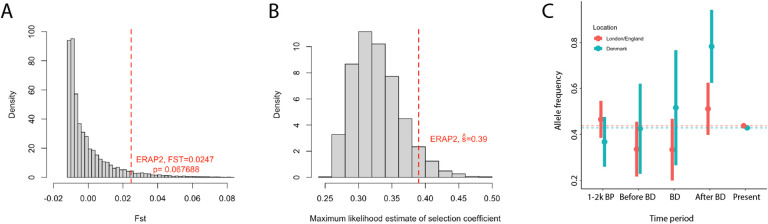
Klunk et al. analyzed ancient DNA data from individuals in London and Denmark before, during and after the Black Death [1], and argued that allele frequency changes at immune genes were too large to be produced by random genetic drift and thus must reflect natural selection. They also identified four specific variants that they claimed show evidence of selection including at ERAP2, for which they estimate a selection coefficient of 0.39-several times larger than any selection coefficient on a common human variant reported to date. Here we show that these claims are unsupported for four reasons. First, the signal of enrichment of large allele frequency changes in immune genes comparing people in London before and after the Black Death disappears after an appropriate randomization test is carried out: the P value increases by ten orders of magnitude and is no longer significant. Second, a technical error in the estimation of allele frequencies means that none of the four originally reported loci actually pass the filtering thresholds. Third, the filtering thresholds do not adequately correct for multiple testing. Finally, in the case of the ERAP2 variant rs2549794, which Klunk et al. show experimentally may be associated with a host interaction with Y. pestis, we find no evidence of significant frequency change either in the data that Klunk et al. report, or in published data spanning 2,000 years. While it remains plausible that immune genes were subject to natural selection during the Black Death, the magnitude of this selection and which specific genes may have been affected remains unknown.


Figures

Figure 1:
Figure 1:
Reported enrichment persists even after permutation to remove any signal that could be due to the Black Death. A: For 100 permutations of the pre- and post-Black Death labels, the observed p-values are plotted in a cumulative density plot for the 99th percentile of enrichment of variants with MAF > 10%. The blue dashed line indicates a cumulative count of 5 of 100 runs, the green dashed line indicates the expected significance threshold of 0.05, and the red solid line shows the p-value obtained in the original paper. B: A q-q plot for the same p-values as in A showing the inflation over the expected null distribution of p-values. C: For 100 iterations approximately matching the sample size and coverage from the original study by down-sampling a subset of samples from the 1000 Genomes Project, the observed p-values are plotted in a cumulative density plot for the 99th percentile of enrichment of variants with MAF > 10%. Lines represent the same values as in A. D: A q-q plot for the same p-values as in D showing the inflation over the expected null distribution of p-values.
Figure 2:
Figure 2:
Bias in allele frequency estimates based on genotype likelihoods. A: True values against unbiased maximum likelihood (ML) estimates for simulated read data with an average of 5x coverage simulated for 200 individuals at 30,000 SNPs to match the data observed in Klunk et al. B: True values against biased estimates computed with the Klunk et al. approach for simulated read data with an average of 5x coverage simulated for 200 individuals at 30,000 SNPs. C: Maximum likelihood (ML) estimates against Klunk et al. estimates for 31,799 SNPs included in the analysis with no minimum allele frequency threshold. D: Manhattan plot for FST scan of loci that pass the Klink et al. filtering criteria using maximum likelihood estimates of allele frequencies (equivalent to Figure 2C of Klunk et al.).
Figure 3:
Figure 3:
No evidence of selection at rs2549794. A: Histogram of simulated FST values for two samples of sizes 38 and 63 diploid individuals from two populations with identical allele frequency of 0.438. Dashed red line shows reported value for rs2549794. B: Distribution of estimated selection coefficients, conditional on passing FST and directionality filters, under a null model of identical allele frequency of 0.438 in all populations assuming diploid coverage in all individuals. C: Estimated frequencies of rs2549794 in the three time points from Klunk et al. plus the periods 1–2K BP and the present day. Dashed lines show present-day frequencies and error bars show approximate 95% confidence intervals which overlap the present-day frequency for all time points except post-Black Death Denmark.

References

    1. Klunk J., et al. , Evolution of immune genes is associated with the Black Death. Nature, 2022. 611(7935): p. 312–319. - PMC - PubMed
    1. Byrska-Bishop M., et al. , High-coverage whole-genome sequencing of the expanded 1000 Genomes Project cohort including 602 trios. Cell, 2022. 185(18): p. 3426–3440 e19. - PMC - PubMed
    1. Kim S.Y., et al. , Estimation of allele frequency and association mapping using next-generation sequencing data. BMC Bioinformatics, 2011. 12: p. 231. - PMC - PubMed
    1. Green R.E., et al. , A draft sequence of the Neandertal genome. Science, 2010. 328(5979): p. 710–722. - PMC - PubMed
    1. Mathieson I., et al. , Genome-wide patterns of selection in 230 ancient Eurasians. Nature, 2015. 528(7583): p. 499–503. - PMC - PubMed

Publication types