[Preprint]. 2023 Mar 24:2023.03.23.533914.
doi: 10.1101/2023.03.23.533914.

Visualization of translation reorganization upon persistent collision stress in mammalian cells

Affiliations

Visualization of translation reorganization upon persistent collision stress in mammalian cells

Juliette Fedry et al. bioRxiv. .

Update in

Abstract

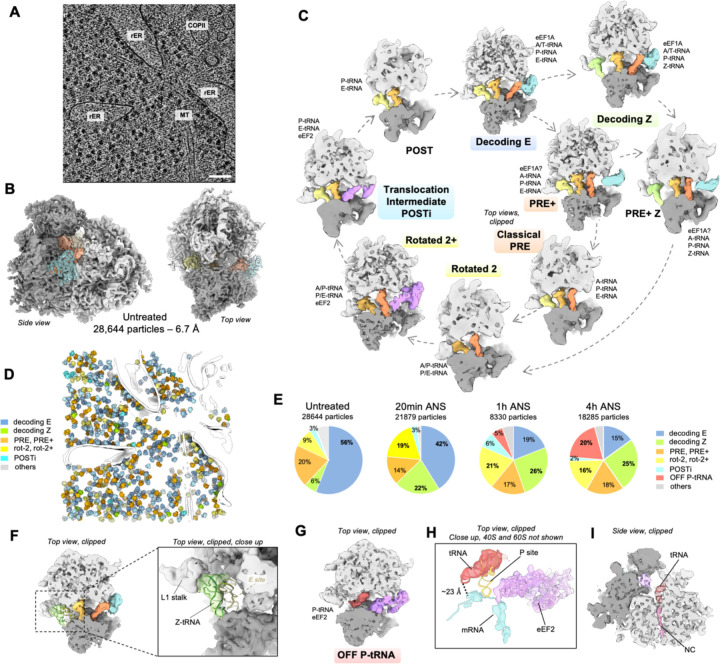
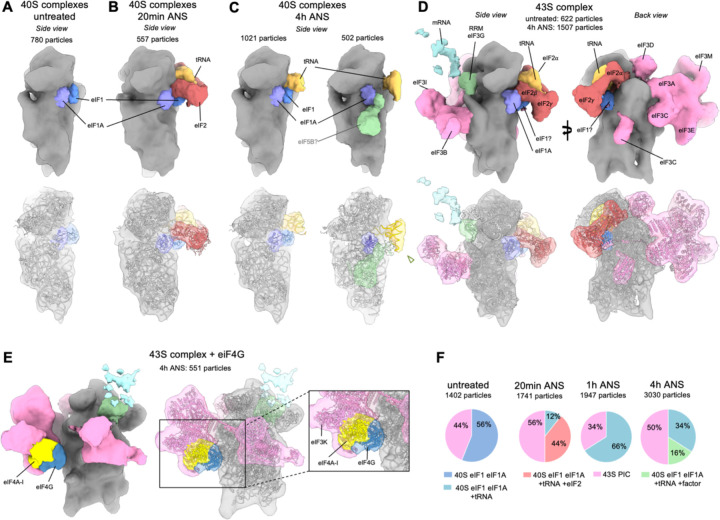
Aberrantly slow mRNA translation leads to ribosome stalling and subsequent collision with the trailing neighbor. Ribosome collisions have recently been shown to act as stress sensors in the cell, with the ability to trigger stress responses balancing survival and apoptotic cell-fate decisions depending on the stress level. However, we lack a molecular understanding of the reorganization of translation processes over time in mammalian cells exposed to an unresolved collision stress. Here we visualize the effect of a persistent collision stress on translation using in situ cryo electron tomography. We observe that low dose anisomycin collision stress leads to the stabilization of Z-site bound tRNA on elongating 80S ribosomes, as well as to the accumulation of an off-pathway 80S complex possibly resulting from collision splitting events. We visualize collided disomes in situ, occurring on compressed polysomes and revealing a stabilized geometry involving the Z-tRNA and L1 stalk on the stalled ribosome, and eEF2 bound to its collided rotated-2 neighbor. In addition, non-functional post-splitting 60S complexes accumulate in the stressed cells, indicating a limiting Ribosome associated Quality Control clearing rate. Finally, we observe the apparition of tRNA-bound aberrant 40S complexes shifting with the stress timepoint, suggesting a succession of different initiation inhibition mechanisms over time. Altogether, our work visualizes the changes of translation complexes under persistent collision stress in mammalian cells, indicating how perturbations in initiation, elongation and quality control processes contribute to an overall reduced protein synthesis.


Conflict of interest statement

Declaration of interest The authors declare no competing interest.

Figures

Figure 1:
Figure 1:. Biochemical analysis of low dose ANS persistent collision stress in MEF cells.
(A) Schematic representation of translational situation in untreated cells (polysomes and low amount of collisions) and under increasing intensities of collision stress with associated cellular stress responses and cell fate outcome. (B) Western blot analysis of collision stress induced responses in MEF cells treated with 500 µM Arsenite for 20 min, untreated, or treated with 200 nM ANS for 20 min to 10h: total eIF2α, phosphorylated eIF2α, phosphorylated p38 and phosphorylated JNK (C) Corresponding relative intensity measurements, background substracted and normalized by total eiF2α intensity (D) 35S incorporation protein synthesis measurements in control cells and cells treated with high dose CHX (100 mg/mL), and low dose ANS (200 nM) for 20min, 1h and 4h. (E) Polysome profiling on sucrose gradients for control cells and cells treated with 20min, 1h and 4h low dose ANS.
Figure 2:
Figure 2:. In situ visualization of 80S ribosome populations.
(A) Slice through a representative tomogram of control MEF cells, scale bar: 100 nm. (B) Subtomogram average of 80S particles in the control condition. The small subunit is displayed in dark gray, the large subunit in light gray, the elongation factor in cyan and the tRNAs in shades of orange to yellow. (C) Observed active intermediates positioned in model of mammalian elongation cycle. The ribosome is clipped for visualization. A, P, and E indicate ribosomal aminoacyl, peptidyl, and exit sites, respectively. The tRNAs are color-coded with respect to a complete cycle. The color code is the same as in B, with eEF1A in cyan, eEF2 in purple and the Z-tRNA in green. (D) Different ribosome elongation states mapped back in the original tomogram shown in A. Segmented membranes and microtubules are displayed in white. (E) Relative abundance of ribosomal elongation complexes in all datasets. (F) Close-up view on the Z-site bound tRNA of the decoding Z complex. (G) Off-pathway ribosomal complex observed under prolonged low dose ANS stress (1h and 4h). The tRNA is displayed in dark red. (H) Same complex as in G, displaying a model fit for the tRNA, eEF2 and the mRNA density (dark cyan). (I) Same complex as in G and H, side view, clipped for the visualization of the peptide exit tunnel displaying a nascent chain (pink) bound to the tRNA.
Figure 3:
Figure 3:. In situ analysis of ribosome collisions.
(A) Distance to nearest neighbor plot for the control data set, (B) same at 20 min low dose ANS stress, (C) same at 1h low dose ANS stress, (D) same at 4h low dose ANS stress. On each plot n indicates the number of distances counted in the plot, ie. all entry/exit distances < 12 nm. (E) Rough quantification of ribosomes with a defined close neighbor based on RELION 3D classification results. Bar and whiskers are mean and s.d. across tomograms (untreated n = 87, 20 min ANS n = 68, 1h ANS n = 36, 4h ANS n = 45). (F) In situ subtomogram average of collided disome. Close up view displays fitted models for the Z-site tRNA and eEF2. (G) In situ subtomogram average of GCN1-bound collided disomes and side views: (H) of the stalled ribosome, (I) on the collided ribosome. (J) GCN1-bound collisions mapped back into a tomogram. Segmented membranes are displayed in light gray and all other 80S particles in transparent light mauve.
Figure 4:
Figure 4:. In situ subtomogram averages of 60S complexes.
(A) Major 60S complex observed in control cells displaying densities corresponding to eIF6 (purple), EBP1 (blue) and a putative eFL1 (light green). PDB coordinates for 60S, eIF6 and EBP1 were fitted independently (using the corresponding chains from PDB 7OW7 for the 60S and eIF6, and 6LSR for EBP1). (B) Second most abundant 60S class, corresponding to previously described maturation state B, displaying densities corresponding to eIF6 (purple), LSG1 (light blue), NMD3 (beige), ZN622 (dark red). Fitted PDB coordinates: 6LSR. (C) Relative abundances of the 60S complexes observed in the control dataset. (D) Major 60S complex observed in the 4h low dose ANS stress dataset displaying densities for eIF6 (purple), partial P-site tRNA (gold) and nascent chain (hot pink). PDB coordinates were fitted independently using the corresponding chains from 3J92 for 60S, eIF6 and tRNA, and 5AJ0 for the nascent chain. (E) NEMF and Listerin bound 60S particles as observed in stressed cells. Fitted PDB coordinates: 3J92. (F) Relative abundances of the 60S complexes observed in 4h low dose ANS stress dataset.
Figure 5:
Figure 5:. In situ subtomogram averages of 40S complexes.
(A) 40S complex observed in control cells, densities corresponding to eIF1 and eIF1A are displayed in blue and purple respectively. Fitted PDB coordinates: 4KZY. (B) Abundant 40S complex appearing at 20 min low dose ANS stress, displaying extra densities corresponding to tRNA (gold) and eIF2 (red). (C) Major 40S complexes observed at 4h low dose ANS stress displaying a P-site tRNA (gold) and a density depicted in light green, possibly fitting eIF5B (PDB coordinates: 7TQL). (D) 43S complexes observed in all datasets, displaying eIF3 (pink), and an extra density shown in light cyan proposed to correspond to an mRNA. Fitted PDB coordinates: 6ZMW. (E) Subtomogram average of a 4h ANS 43S subclass. The density corresponding to eIF4A1 is displayed in yellow and eIF4G in dark blue. Fitted PDB coordinates: 6ZMW. (F) Relative abundances of the 40S complexes observed in untreated cells and under low dose ANS stress timepoints of 20min, 1h and 4h.

References

    1. Wu C. C., Peterson A., Zinshteyn B., Regot S., Green R., Ribosome Collisions Trigger General Stress Responses to Regulate Cell Fate. Cell 182, 404–416 e414 (2020). - PMC - PubMed
    1. Silva J. et al., Ribosome impairment regulates intestinal stem cell identity via ZAKa activation. Nat Commun 13, 4492 (2022). - PMC - PubMed
    1. Juszkiewicz S. et al., ZNF598 Is a Quality Control Sensor of Collided Ribosomes. Mol Cell 72, 469–481 e467 (2018). - PMC - PubMed
    1. Zhao T. et al., Disome-seq reveals widespread ribosome collisions that promote cotranslational protein folding. Genome Biol 22, 16 (2021). - PMC - PubMed
    1. Stoneley M. et al., Unresolved stalled ribosome complexes restrict cell-cycle progression after genotoxic stress. Mol Cell 82, 1557–1572 e1557 (2022). - PMC - PubMed

Publication types