[Preprint]. 2023 Mar 23:rs.3.rs-2722744.
doi: 10.21203/rs.3.rs-2722744/v1.

Immune niches in brain metastases contain TCF1+ stem-like T cells, are associated with disease control and are modulated by preoperative SRS

Affiliations

Immune niches in brain metastases contain TCF1+ stem-like T cells, are associated with disease control and are modulated by preoperative SRS

Caroline S Jansen et al. Res Sq. .

Update in

Abstract

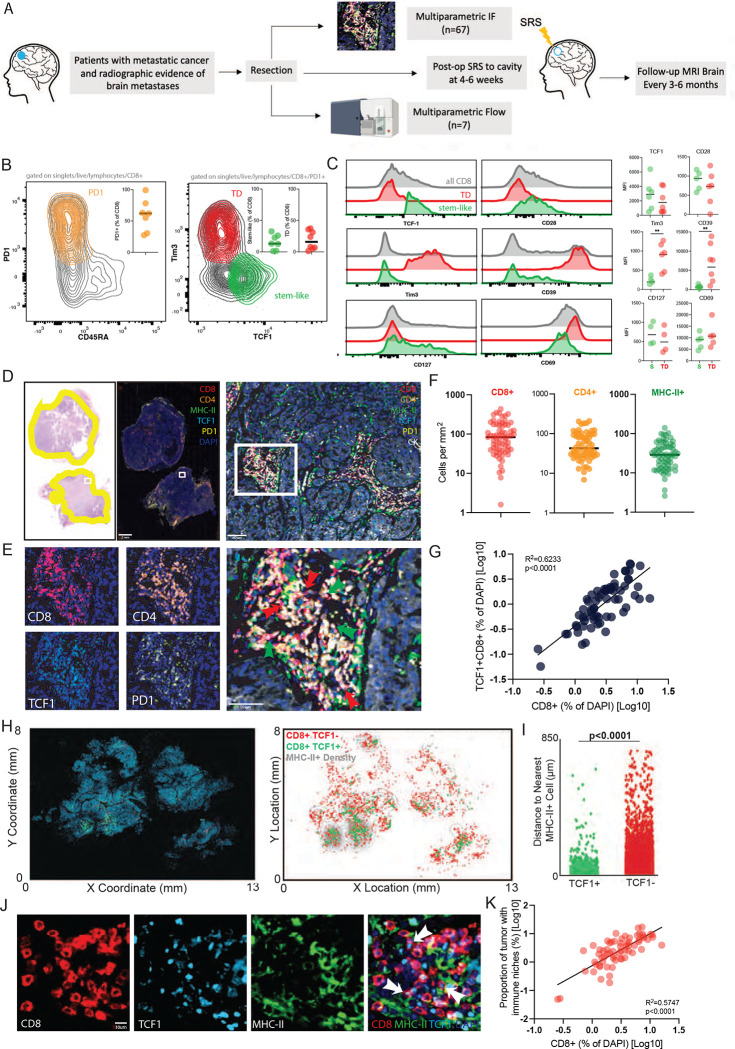
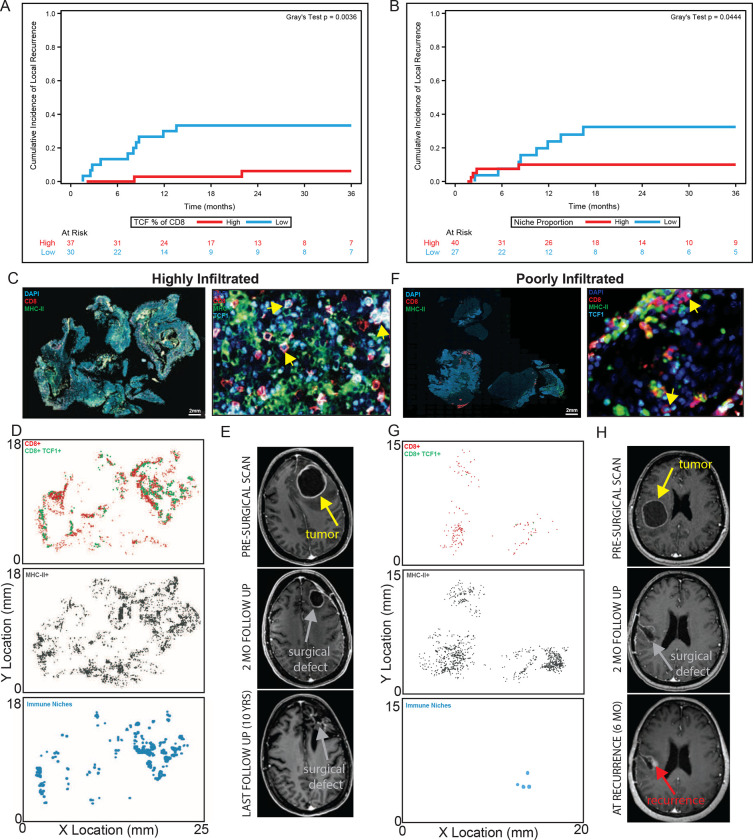
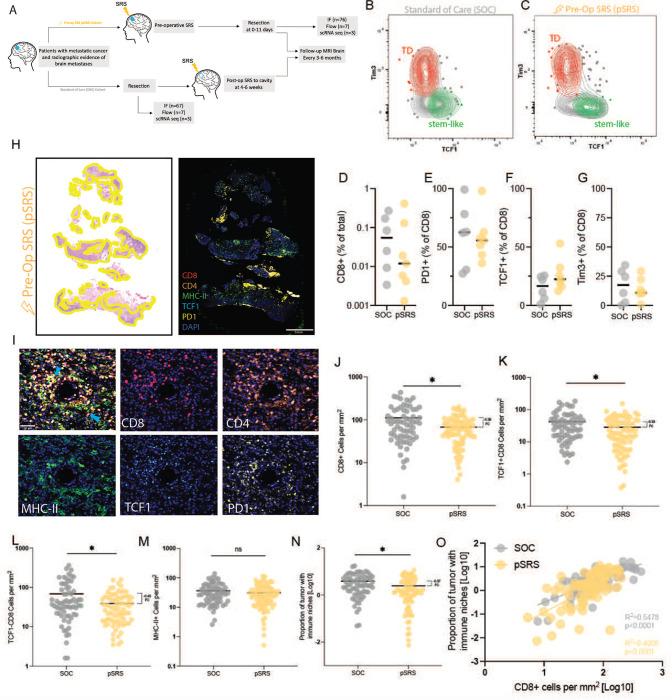
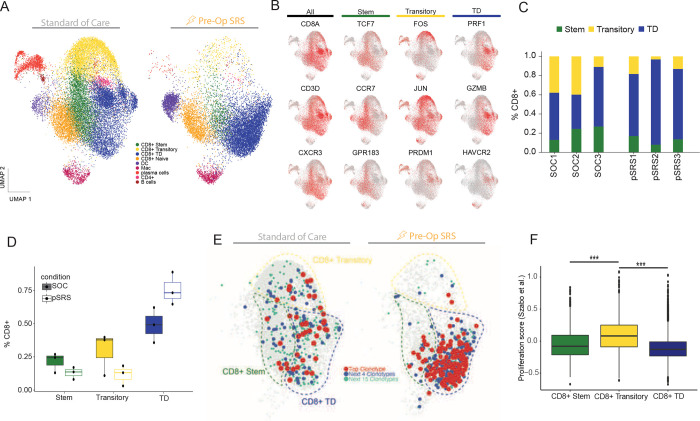
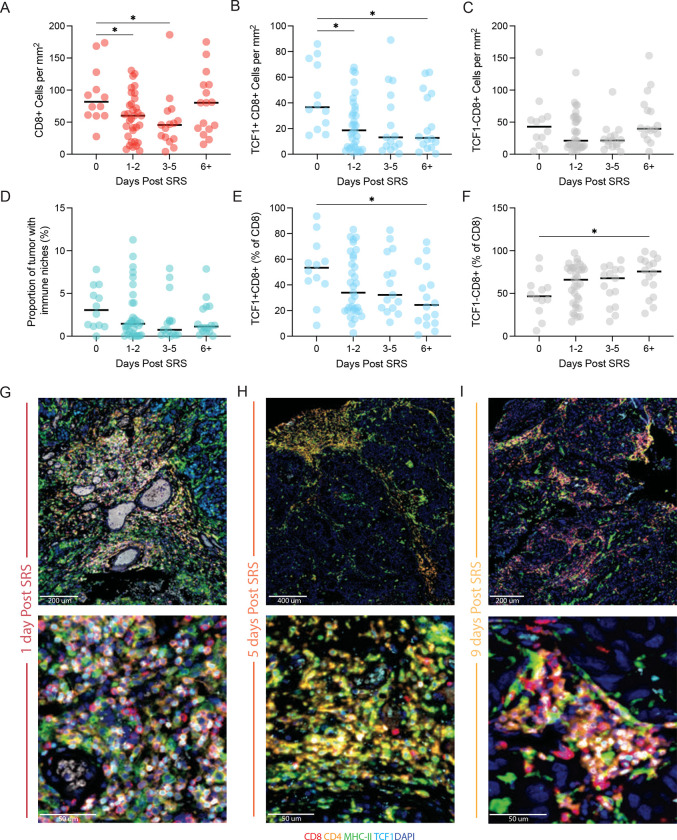
The CD8+ T-cell response is prognostic for survival outcomes in several tumor types. However, whether this extends to tumors in the brain, an organ with barriers to T cell entry, remains unclear. Here, we analyzed immune infiltration in 67 brain metastasis (BrM) and found high frequencies of PD1+ TCF1+ stem-like CD8+ T-cells and TCF1- effector-like cells. Importantly, the stem-like cells aggregate with antigen presenting cells in immune niches, and niches were prognostic for local disease control. Standard of care for BrM is resection followed by stereotactic radiosurgery (SRS), so to determine SRS's impact on the BrM immune response, we examined 76 BrM treated with pre-operative SRS (pSRS). pSRS acutely reduced CD8+ T cells at 3 days. However, CD8+ T cells rebounded by day 6, driven by increased frequency of effector-like cells. This suggests that the immune response in BrM can be regenerated rapidly, likely by the local TCF1+ stem-like population.


Figures

Figure 1.
Figure 1.. TCF1+ PD1+ stem-like T cells are found in brain metastases and reside in an immunological niche.
A) Schema of sample collection, processing and analysis of BrM tissue. B) Flow cytometry characterizing PD1+ stem-like and terminally differentiated (TD) effector-like cells in BrM. Greater than 50% of CD8+ T cells in BrM are PD1+. C) Expression (mean fluorescence intensity (MFI)) of activation markers, checkpoint molecules, and transcription factors by TD and stem-like subsets, gated as in B. D) H&E with tumor regions outlined in yellow (left); immunofluorescence whole slide image (right) with region of interest shown as white box. Region of interest zoomed on immune cell cluster. E) Individual T cell markers, green arrows highlighting CD8+ PD1+ TCF1+ stem-like cells, red arrows highlighting CD8+ PD1+ TCF1 terminally differentiated, effector-like cells. F) Quantitation of immune cell densities. G) Percentage of total CD8+ T cells correlates with percentage of TCF1+ CD8+ T cells. H) Cellular spatial relationship map. After acquiring x.y coordinates of MHC-II+ cells, MHC-II+ cellular density was calculated (number of MHC-II+ cells per 10,000 μm2). x,y location of CD8+ T cells are overlaid with MHC-II+ density contour. CD8+ cells were designated TCF1 positive or negative. I) Distance between CD8+ T cells and the closest MHC-II+ cell. J) Immunofluorescence demonstrating immune niche areas with white arrows denoting stem-like T cells. K) Percentage of total CD8+ T cells correlates with proportion of tumor tissue occupied by immune niches.
Figure 2.
Figure 2.. Higher immune niche density is associated with longer local control.
A) BrMs with a higher percentage of TCF1+ of CD8+ T cells had extended local control of disease. Gray’s test, p=0.0036. B) BrMs with a higher tumor niche proportion had extended local control of disease. Gray’s test, p=0.0444. C) Overview (left) and region of interest (right) immunofluorescence for a highly immune infiltrated tumor. Yellow arrows denote stem-like T cells. D) x,y location maps of CD8+ T cells, MHC-II+ cells and immune niches. E) Cystic brain metastasis pre-operative and post-operative resection cavity followed for 10-years without evidence of local recurrence. F) Overview (left) and region of interest (right) immunofluorescence of poorly infiltrated tumor. Yellow arrows denote stem-like T cells. G) x,y location maps as in (D). H) Nodular local recurrence at surgical cavity margin occurs at 6 months post-operatively denoted by red arrow.
Figure 3.
Figure 3.. The impact of pre-operative SRS on the immune niche.
A) Schema of sample collection, processing, and analysis of BrM tissue including pre-operative SRS (pSRS) specimens. B) Flow cytometry demonstrating the presence of TD and stem-like T cells in both upfront resected (standard of care, SOC) and C) pSRS BrM. D) Percent CD8+ T cells of total cells in BrM SOC vs pSRS, p= 0.8904. E) Percent PD1+ of CD8+ T cells in BrM SOC vs pSRS, p= 0.8708. F) Percent TCF1+ of CD8+ T cells in BrM in SOC vs pSRS, p= 0.1400. G) Percent Tim3+ of CD8+ T cells in BrM in SOC vs pSRS, p= 0.6655. In D-G, p values calculated by unpaired t test. H) H&E with tumor regions outlined in yellow (left) and immunofluorescence whole slide image (right). I) Merged image and individual stains for T cell subsets and MHC-II+ cells. J) Total CD8+ cells per mm are lower in pSRS samples compared to SOC, p= 0.0006. K) TCF1+ are also lower in pSRS samples, p= 0.0175. L) TCF1 effector-like are lower in pSRS vs SOC, p= 0.0023. M) There is no difference in MHC-II+ cell per mm2 in SOC vs pSRS, p= 0.2647. N) Proportion of tumor with immune niche is lower in pSRS compared to SOC likely due to the decrease in stem-like T cells, p= 0.0058. In J-N, *:p<0.05, as calculated by unpaired t test. O) Proportion of tumor with immune niche correlates with CD8+ cells per mm2 in both pSRS and SOC BrM.
Figure 4.
Figure 4.. The transitory CD8+ T cell population is preferentially reduced following pSRS.
A) Single cell RNA sequencing of SOC and pSRS BrM. Multiple different immune populations were identified under both treatment conditions. Stem-like and terminally differentiated effector-like T cells were observed as well as a transitory subset. B) Feature plots demonstrating expression of stem, transitory, and terminally differentiated effector-like cell markers. C) T cell subset frequency in three different SOC and three pSRS BrM. D) Frequency of each subset under both conditions. pSRS demonstrates a strong trend towards decreased transitory cell frequency and increased terminally differentiated effector-like frequency. E) Clonotypic analysis demonstrating CDR3 TCR overlap between all 3-antigen experienced CD8+ T cell subsets. F) Proliferation score showing increased proliferation in the transitory subset relative to the stem-like and terminally differentiated effector-like T cells. ***: p<0.001 by Mann Whitney.
Figure 5.
Figure 5.. Temporal changes of BrM immune niche components following pSRS.
A) Number of CD8+ cells per mm2 decreases from day 0 to day 5 and then rebounds to baseline by day 6+ following pSRS. B) Number of TCF1+ CD8+ cells decrease following pSRS and remain lower at day 6+. C) Number of TCF1 CD8+ cells have a numeric, but not significant decrease from day 0–5 with a rebound by day 6+. D) Proportion of tumor occupied by immune niches showed a numeric but not significant decrease from day 0 to day 6+. E) Percentage of TCF1+ CD8+ cells significantly decreased from day 0 to day 6+. F) In contrast, the percentage of TCF1 CD8+ cells significantly increased from day 0 to day 6+. In A-F, *:p < 0.05 as calculated by ordinary one-way ANOVA. G) Representative immunofluorescence of the immune niches and T cells subsets at day 1, H) at day 5, I) and at day 9 after pSRS.

References

    1. Naito Y. et al. CD8+ T cells infiltrated within cancer cell nests as a prognostic factor in human colorectal cancer. Cancer Res 58, 3491–3494 (1998). - PubMed
    1. Sharma P. et al. CD8 tumor-infiltrating lymphocytes are predictive of survival in muscle-invasive urothelial carcinoma. Proc Natl Acad Sci U S A 104, 3967–3972 (2007). 10.1073/pnas.0611618104 - DOI - PMC - PubMed
    1. Hiraoka K. et al. Concurrent infiltration by CD8+ T cells and CD4+ T cells is a favourable prognostic factor in non-small-cell lung carcinoma. Br J Cancer 94, 275–280 (2006). 10.1038/sj.bjc.6602934 - DOI - PMC - PubMed
    1. Dieci M. V. et al. Immune characterization of breast cancer metastases: prognostic implications. Breast Cancer Res 20, 62 (2018). 10.1186/s13058-018-1003-1 - DOI - PMC - PubMed
    1. Im S. J. et al. Defining CD8+ T cells that provide the proliferative burst after PD-1 therapy. Nature 537, 417–421 (2016). 10.1038/nature19330 - DOI - PMC - PubMed

Publication types