[Preprint]. 2023 Mar 20:rs.3.rs-2666578.
doi: 10.21203/rs.3.rs-2666578/v1.

Resting-state EEG measures cognitive impairment in Parkinson's disease

Affiliations

Resting-state EEG measures cognitive impairment in Parkinson's disease

Md Fahim Anjum et al. Res Sq. .

Update in

Abstract

Background: Cognitive dysfunction is common in Parkinson's disease (PD) and is diagnosed by complex, time-consuming psychometric tests which are affected by language and education, subject to learning effects, and not suitable for continuous monitoring of cognition.

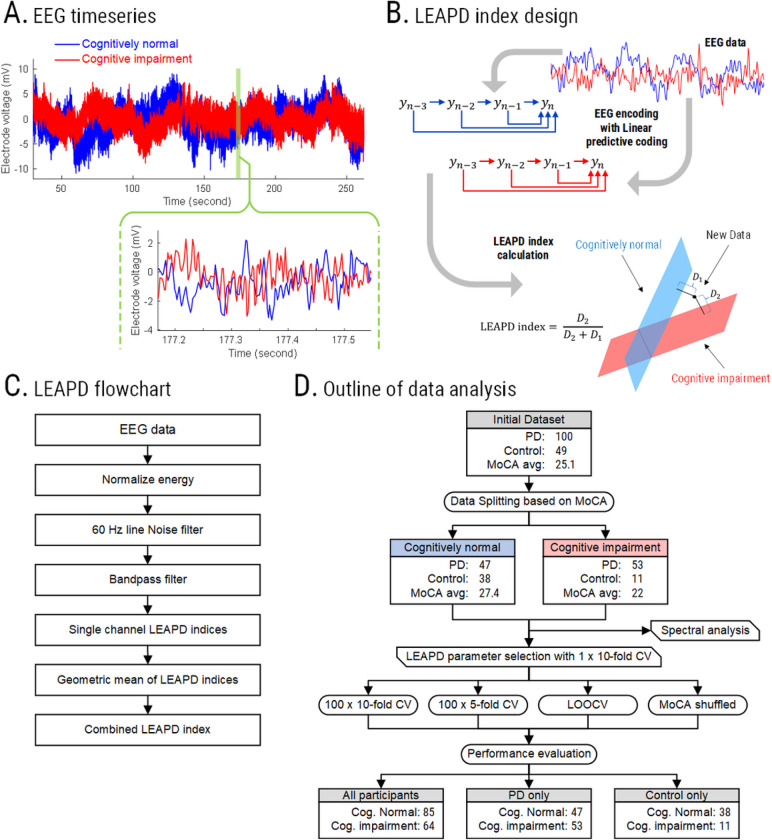
Objectives: We developed and evaluated an EEG-based biomarker to index cognitive functions in PD from a few minutes of resting-state EEG.

Methods: We hypothesized that synchronous changes in EEG across the power spectrum can measure cognition. We optimized a data-driven algorithm to efficiently capture these changes and index cognitive function in 100 PD and 49 control participants. We compared our EEG-based cognitive index with the Montreal cognitive assessment (MoCA) and cognitive tests across different domains from the National Institutes of Health (NIH) Toolbox using cross-validation schemes, regression models, and randomization tests.

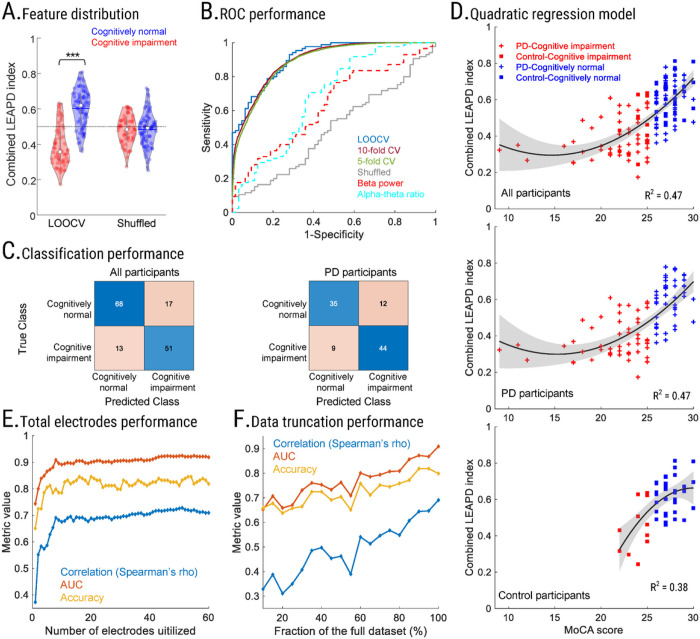
Results: We observed cognition-related changes in EEG activities over multiple spectral rhythms. Utilizing only 8 best-performing EEG electrodes, our proposed index strongly correlated with cognition (rho = 0.68, p value < 0.001 with MoCA; rho ≥ 0.56, p value < 0.001 with cognitive tests from the NIH Toolbox) outperforming traditional spectral markers (rho = -0.30 - 0.37). The index showed a strong fit in regression models (R2 = 0.46) with MoCA, yielded 80% accuracy in detecting cognitive impairment, and was effective in both PD and control participants.

Conclusions: Our approach is computationally efficient for real-time indexing of cognition across domains, implementable even in hardware with limited computing capabilities, making it potentially compatible with dynamic therapies such as closed-loop neurostimulation, and will inform next-generation neurophysiological biomarkers for monitoring cognition in PD and other neurological diseases.


Conflict of interest statement

CONFLICT OF INTEREST All authors declare no financial or non-financial competing interests.

Figures

Figure 1
Figure 1. Methodology of the study.
(A) EEG time series comparison between a Parkinson’s disease participant with normal cognition (blue) and a participant with cognitive impairment (red) from a representative electrode P8. (B) Illustration of single-electrode LEAPD index generation using separate affine subspaces for cognitively impaired (red) and cognitively normal (blue) participants in the feature space.D1 and D2 are the distances from the affine subspace of the cognitively normal (blue) and cognitively impaired participants (red), respectively. (C) Steps for LEAPD index generation from EEG data. (D) Schematic and data analysis outline of the study for LEAPD and traditional EEG spectral analysis with randomization test and cross-validations for MoCA. Abbreviation: PD = Parkinson’s disease. LOOCV = Leave-one-out cross-validation. MoCA = Montreal Cognitive Assessment.
Figure 2
Figure 2. EEG feature analysis and parameter choice.
Topographic plots of age-adjusted Spearman’s rho correlation between MoCA scores and (A) traditional frequency bands, (B) Log-spectral ratio of Alpha (8 – 13 Hz) and Theta (4 – 8 Hz) rhythm. Electrodes marked as white signifies a statistically significant correlation (pvalue < 0.05). (C) Topographic plot of correlations between single-electrode LEAPD indices and MoCA scores during optimal parameter selection for combined LEAPD index. Selected electrodes are marked as white.(D) Optimal frequency ranges for the selected EEG electrodes. Vertical color blocks represent traditional frequency bands. (E) Comparison of spectral densities between cognitively impaired (red) and cognitively normal (blue) groups from single-electrode (P8) raw EEG data (top) and EEG-encoded linear predictive coding models (bottom) capturing unique spectral profiles. Thick lines show mean spectral densities; lighter lines are individual spectral densities, and shaded areas show standard error of the mean. The arrows mark the directions of the shifts of the spectral peaks from cognitive impairment to normal cognition. Data in panel A, B, C, and E are from all participants (n=149).
Figure 3
Figure 3. Performance evaluation of LEAPD.
(A) Violin plots of LEAPD indices for cognitively impaired (red) and cognitively normal (blue) participants during LOOCV before (left) and after MoCA score shuffling among participants (right). (B) Receiver operative characteristic (ROC) curve for LEAPD in various cross-validations as well as in shuffled MoCA data (solid lines), and for the top-performing traditional spectral features (dashed lines; beta power and alpha-theta log ratio at P4). (C) Classification performances of LEAPD with confusion matrices for all participants (left) and Parkinson’s disease only (right) during LOOCV. (D) Scatter plot for the quadratic regression model between MoCA and LEAPD indices for all participants (top; n=149), Parkinson’s disease-only (middle; n=100), and controls (bottom; n=49) during LOOCV. (E) Spearman’s rho correlation with MoCA (blue), classifier accuracy (yellow), and AUC (red) performance of LEAPD while varying the number of EEG electrodes utilized for the combined LEAPD index. The x-axis is the number of EEG electrodes utilized, and the y-axis is the metric (AUC, classifier accuracy, or Spearman’s rho value). (F) Robustness of LEAPD performance in terms of correlation with MoCA (blue), classifier accuracy (yellow), and AUC (red) while truncating the dataset. The x-axis is the size of the dataset after truncation compared to the original size in percentage. Results in panel A, B, E, and F are from all participants (n=149). Abbreviation: PD = Parkinson’s disease, Leave-one-out cross-validation = LOOCV, Cross-validation = CV.

References

    1. Foltynie T., Brayne C. E. G., Robbins T. W. & Barker R. A. The cognitive ability of an incident cohort of Parkinson’s patients in the UK. The CamPaIGN study. Brain 127, 550–560 (2004). - PubMed
    1. Muslimović D., Post B., Speelman J. D. & Schmand B. Cognitive profile of patients with newly diagnosed Parkinson disease. Neurology 65, 1239–1245 (2005). - PubMed
    1. Aarsland D., Andersen K., Larsen J. P. & Lolk A. Prevalence and characteristics of dementia in Parkinson disease: an 8-year prospective study. Archives of neurology 60, 387–392 (2003). - PubMed
    1. Hely M. A., Reid W. G. J., Adena M. A., Halliday G. M. & Morris J. G. L . The Sydney multicenter study of Parkinson’s disease: The inevitability of dementia at 20 years: Twenty Year Sydney Parkinson’s Study. Movement Disorders 23, 837–844, doi: 10.1002/mds.21956 (2008). - DOI - PubMed
    1. Litvan I. et al. Diagnostic criteria for mild cognitive impairment in Parkinson’s disease: Movement Disorder Society Task Force guidelines. Movement Disorders 27, 349–356, doi: 10.1002/mds.24893 (2012). - DOI - PMC - PubMed

Publication types