[Preprint]. 2023 Mar 17:2023.03.16.532692.
doi: 10.1101/2023.03.16.532692.

Hardwired to attack: Transcriptionally defined amygdala subpopulations play distinct roles in innate social behaviors

Affiliations

Hardwired to attack: Transcriptionally defined amygdala subpopulations play distinct roles in innate social behaviors

Julieta E Lischinsky et al. bioRxiv. .

Update in

Abstract

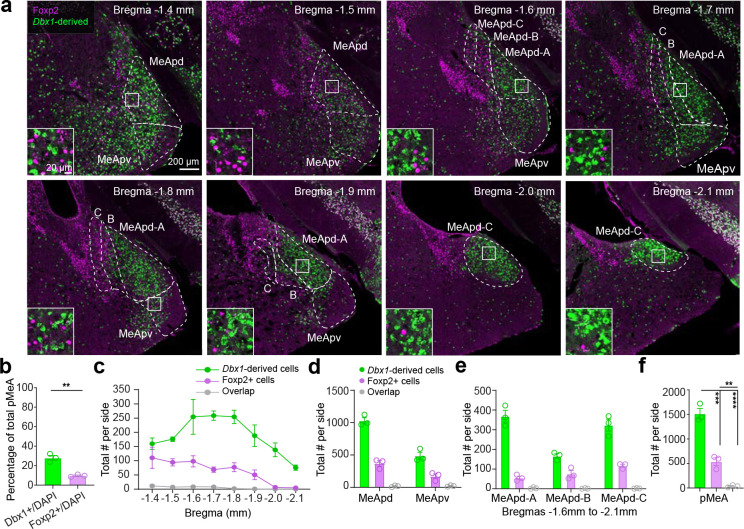
Social behaviors are innate and supported by dedicated neural circuits, but it remains unclear whether these circuits are developmentally hardwired or established through social experience. Here, we revealed distinct response patterns and functions in social behavior of medial amygdala (MeA) cells originating from two embryonically parcellated developmental lineages. MeA cells in male mice that express the transcription factor Foxp2 (MeAFoxp2) are specialized for processing male conspecific cues even before puberty and are essential for adult inter-male aggression. In contrast, MeA cells derived from the Dbx1-lineage (MeADbx1) respond broadly to social cues and are non-essential for male aggression. Furthermore, MeAFoxp2 and MeADbx1 cells show differential anatomical and functional connectivity. Altogether, our results support a developmentally hardwired aggression circuit at the level of the MeA and we propose a lineage-based circuit organization by which a cell's embryonic transcription factor profile determines its social information representation and behavior relevance during adulthood.


Conflict of interest statement

Declaration of Interests The authors declare no competing interests.

Figures

Figure 1.
Figure 1.. MeAFoxp2 and MeADbx1 cells are non-overlapping transcriptionally defined subpopulations.
(a) Immunostaining of Foxp2 and GFP (Dbx1-derived cells) in the MeA of Dbx1cre;Ai6 male mice. Left bottom shows the enlarged view of boxed areas. (b) Percentage of MeAFoxp2 and MeADbx1 cells in the total MeA population. (c) The number of counted Foxp2, Dbx1-derived and double positive cells in each side of the MeA from Bregma −1.4mm to −2.1mm. (d) The total number of counted Foxp2, Dbx1-derived and double positive cells in each side of the posterodorsal and posteroventral MeA (MeApd and MeApv). (e) The total number of counted Foxp2, Dbx1-derived and double positive cells in the MeApd sub-compartments from Bregma −1.6mm to −2.1mm. (f) Total number of Foxp2, Dbx1-derived and overlap cells in each side of the posterior MeA. For b-f, every third of 50μm brain sections were counted. The Allen Brain Reference Atlas was used to determine the MeA subdivisions and sub-compartments. (b) Two-tailed unpaired t-test. (e) One-way ANOVA followed by Tukey’s multiple comparisons test. Data are mean ± S.E.M., *p<0.05, **p<0.01, ***p<0.001, ****p<0.0001, n=3 mice.
Figure 2.
Figure 2.. Distinct responses to social cues of MeAFoxp2 and MeADbx1 cells in head-fixed naïve mice.
(a) Schematics showing the timeline of stimulus presentation. (b) Schematics of viral injection strategy for targeting MeAFoxp2 and MeADbx1 cells. (c) Representative histology images of viral injection, denoting GCaMP6f expression (green), Foxp2 antibody (red) and DAPI (blue) staining in Foxp2cre and Dbx1cre;LSL-FlpO mice. White dotted lines represent location of fiber implant. (d) Percentage of cells co-expressing Foxp2 and GCaMP6f over the total number of GCaMP6f cells in the MeA of Foxp2cre and Dbx1cre;LSL-FlpO mice. (e1-e4) Top: Representative Ca2+ traces of MeAFoxp2 cells during the presentation of a male (e1), female (e2), pup (e3) and object (e4) stimuli. Colored shades represent the duration of stimulus presentation. Bottom: corresponding heat-maps of the z-scored Ca2+ responses (Fz score) per animal before and after the onset of each stimuli in MeAFoxp2 cells. (f1-f4) Responses of MeADbx1 cells to various stimuli in head-fixed naïve male mice. (g and h) Average peri-stimulus histograms (PSTH) of Ca2+ signals from MeAFoxp2 (g) and MeADbx1 cells (h) aligned to the onset (left) and offset (right) of various stimulus presentations. Open circles indicate significantly increased responses (q<0.05) from the baseline (Fz=0). Colored lines and shades represent mean responses ± S.E.M. across animals. Dashed lines mark time 0. (i and j) Peak Fz signal of MeAFoxp2 (i) and MeADbx1 cells (j) during the presentation of social and non-social stimuli. (k) Preference index (PI) of MeAFoxp2 and MeADbx1 cells to different social stimuli. For example, PImale is calculated as (Fzmale − 0.5 × (Fzfemale + FZpup))/(FZmale + 0.5×|FZfemale + Fzpup|). (d) Two-tailed unpaired t-test. (g-h) One sample t-test for each stimulus, corrected for multiple comparisons with a false discovery rate (FDR) 0.05. (i-j) One-way repeated-measures ANOVA followed by Tukey’s multiple comparisons test. (k) Two-way repeated measures ANOVA followed by Sidak’s multiple comparisons test. n = number of animals. Data are mean ± S.E.M.; *p<0.05, **p<0.01, ***p<0.001, ****p<0.0001.
Figure 3.
Figure 3.. Differential response patterns of MeAFoxp2 and MeADbx1 cells during fighting and mating in socially experienced male mice.
(a-f) Representative Ca2+ traces and peri-event histograms (PETHs) of MeAFoxp2 (a-c) and MeADbx1 cells (d-f) during interactions with male, female and pup stimuli. Dashed black lines in PETHs represent the behavior onset at time zero; blue lines in Ca2+ traces indicate time 0 when the intruder is introduced. (g and i) Introduction responses of MeAFoxp2 (g) and MeADbx1 cells (i), calculated as the peak Ca2+ signal within the first 100 sec after stimulus introduction. (h and j) Average Ca2+ responses of MeAFoxp2 (h) and MeADbx1 cells (j) during various behaviors towards various conspecific intruders and a novel object. (k) Preference indexes of MeAFoxp2 and MeADbx1 cells showing the relative introduction response magnitudes across different social stimuli. (l) Preference indexes of MeAFoxp2 and MeADbx1 cells denoting the relative investigation response magnitudes across different social stimuli. (g) One-way repeated-measures ANOVA followed by Tukey’s multiple comparisons test. (h, j) Mixed-effects analysis followed by Tukey’s multiple comparisons test. One sample t-test for each behavior, corrected for multiple comparisons with a false discovery rate (FDR) 0.05. (i) Friedman test followed by Dunn’s multiple comparisons test. (k-l) Mixed-effects analysis followed by Sidak’s multiple comparisons test. n= 7 mice during male and female presentation for MeAFoxp2 group; n= 6 mice during pup investigation and n= 4 mice attacking pup for MeAFoxp2 group; n= 9 mice during male and female presentation for MeADbx1 group; n= 9 mice during pup investigation and n=7 attacking pup for MeADbx1 group. Data are mean ± S.E.M.; *p<0.05, **p<0.01, ***p<0.001, ****p<0.0001; # q<0.05.
Figure 4.
Figure 4.. Comparison of MeAFoxp2 cell responses in naïve vs socially experienced male mice.
(a-d) Representative Ca2+traces of MeAFoxp2 cells during the presentation of a male (a), female (b), pup (c) and object (d) in naïve male mice. (e) Average PETHs of MeAFoxp2 cell responses aligned to investigation onset in naïve male mice. The dashed black line represents the behavior onset at time zero. (f) Average Fz score of MeAFoxp2 cells during investigation of different stimuli in naïve male mice. (g and h) Representative heat-maps showing trial-by-trial Ca2+ signal (Fz-Fz at time 0) of MeAFoxp2 cells during investigation of a male intruder in naïve (g) and socially experienced (h) in a male mouse. Black short lines denote the time points when Fz >=1. Black dots denote the offsets of investigation. (i) Average PETHs of MeAFoxp2 cell responses aligned to investigation onset in naïve (purple) and socially experienced (pink) male mice. The dashed black line represents the behavior onset at time zero. (j) Percent of trials in which MeAFoxp2 cells show Fz>1 during male investigation in naïve and experienced male mice. (k) Latency of MeAFoxp2 cells to respond (Fz>1) in responsive trials. (l) Average Fz score of MeAFoxp2 cells during male investigation in naïve and experienced male mice. (m) Male preference index of MeAFoxp2 cell responses during investigation in naïve and experienced male mice. (n) Average male investigation duration in naïve and experienced male mice. Green circles in (j-n) represent male mice with repeated social experience but did not attack during the recording session. (f) One-way repeated-measures ANOVA followed by Tukey’s multiple comparisons test. (j-n) Two-tailed unpaired t-test. Parenthesis and n= number of mice. Data are mean ± S.E.M.; *p<0.05, **p<0.01, ***p<0.001.
Figure 5.
Figure 5.. MeAFoxp2 cell responses before, during and after puberty in developing male mice.
(a) Schematics of virus injection and a representative histology image indicating GCaMP6f expression (green), Foxp2 antibody (red) and DAPI (blue) staining in Foxp2cre male mice. White dotted lines mark the fiber ending. (b) Timeline of virus injection, fiber placement and recordings. (c) Timeline of behavioral test during the recording day. Stimuli were presented in a pseudo-random fashion. (d-g) Representative Fz scored Ca2+ traces of MeAFoxp2 cells during interactions with an anesthetized (d1-f1) or freely-moving male (g1), an anesthetized (d2-f2) or freely-moving female (g2) or a pup (d3-g3) in a male mouse at different ages. Average Fz score during social investigation (d4-g4) of animals at different ages. (h) Average Fz score of MeAFoxp2 cell responses during male (purple), female (red) and pup (blue) investigation in mice at different ages. (i) Percent of time the test male spent investigating a male and female intruder. (j) No correlation between the Fz score during male or female investigation and the percent of time spent investigating in all recording sessions across ages. (k) Male investigation PI at different ages. (d4-g4) One-way repeated-measures ANOVA followed by Tukey’s multiple comparisons test. (h-i) Two-way repeated measures ANOVA followed by Sidak’s multiple comparisons test. (j) Pearson’s product-moment correlation coefficient (k) Kruskal-Wallis test. n=5 (P25), 6 (P30–32), 6 (P40–44) and 7 mice (>P56). Data are mean ± S.E.M.; *p<0.05, **p<0.01, ***p<0.001, ****p<0.0001.
Figure 6.
Figure 6.. Differences in the anatomical and functional inputs of MeAFoxp2 and MeADbx1 cells for sensory processing.
(a) Schematics showing timeline of monosynaptic retrograde rabies tracing of MeAFoxp2 cells. Pie chart showing the distribution of starter cells (mCherry+ eGFP+). (b) Representative image showing the location of starter MeAFoxp2 cells, denoting TVA-mCherry (red), Rabies-eGFP (green) and DAPI (blue) staining. Inset showing an enlarged view of boxed area. Scale bars: 1mm and 100μm (inset). (c) Schematics showing the retrograde monosynaptic tracing from MeADbx1 cells and the starter cell distribution. (d) Representative histology of the location of starter MeADbx1 cells in a Dbx1cre;LSL-FlpO mouse. Red: TVA-mCherry. Green: Rabies-eGFP, Blue: DAPI staining. Scale bars: 1mm and 100|jm (inset). (e) Distribution of cells in various brain regions that are retrogradely labelled from MeAFoxp2 and MeADbx1 cells. (f and h) Representative histological images showing cells in various regions that are retrogradely labelled from MeAFoxp2 (f) or MeADbx1 (h) cells. (g and i) Overview of inputs into MeAFoxp2 (g) and MeADbx1 (i) cells. (j and l) Recording strategy to examine functional inputs from AOB to MeAFoxp2 (k) and MeADbx1 (l) cells. (k and m) Representative images showing ChrimsonR (red) expression in the olfactory bulb (OB) and ChrimsonR fibers in the MeA. Green: GFP expressed in Foxp2 (k) and Dbx1 (m) cells. Blue: DAPI staining. (n and t) Pie charts showing the distribution of synaptic responses of MeAFoxp2 (n) and MeADbx1 (t) cells to optogenetic activation of OB terminals. (o and u) Representative traces showing optogenetically (1 ms, 605 nm) evoked IPSCs (oIPCSs) and EPSCs (oEPSCs) before and after bath application of TTX and TTX + 4-AP. (p-s) Characterization of oIPSCs and oEPSCs in MeAFoxp2 and MeADbx1 cells, including amplitude (p, r) and latency (q, s). (v-w) oIPSCs in both MeAFoxp2 (v) and MeADbx1 (w) cells were abolished by bath application of TTX and failed to recover after applying TTX+4-AP. (x) oEPSCs in MeADbx1 cells were abolished by TTX but recovered after TTX+4-AP application. SI: substantia innominate. NDB: diagonal band nucleus. DG: dentate gyrus. Sub: subiculum. CA3: field CA3. CP: caudoputamen. GPe: globus pallidus, external segment. SNr: substantia nigra, reticular part. Thal: thalamus. (e) Two-way ANOVA followed by Sidak’s multiple comparisons test; n=4 mice in each group. (r and s) Mann Whitney test. (v-x) Friedman test followed by Dunn’s multiple comparisons test. (n-s) n=23 cells from 3 male mice for MeAFoxp2 group; n=33 cells from 3 male mice for MeADbx1group; (v) n=7 cells from 3 male mice; (w, x) n=6 cells from 3 male mice. Data are mean ± S.E.M.; *p<0.05, **p<0.01, ***p<0.001, ****p<0.0001.
Figure 7.
Figure 7.. MeAFoxp2 cells are necessary and sufficient for territorial aggression, while MeADbx1 cells are not.
(a) Strategies for chemogenetic activation of MeAFoxp2 and MeADbx1 cells. (b) Representative histological images of hM3Dq (red) expression in the MeA of Foxp2cre and Dbx1cre;LSL-FlpO mice. Blue: DAPI. (c) Experimental timeline of chemogenetic activation experiments. (d) Representative raster plots showing behaviors towards male intruders of 5 Foxp2hM3Dq and 5 Foxp2mCherry male mice after i.p. injection of saline or CNO. (e) Percentage of Foxp2hM3Dq and Foxp2mCherry male mice that attacked a male intruder after saline or CNO injection. (f-g) Percent of time Foxp2hM3Dq and Foxp2mCherry mice spent attacking (f) and investigating (g) a male intruder. (h-k) Follow conventions in d-g. CNO injection into Dbx1hM3Dq mice caused a reduction in social investigation but did not change aggressive behaviors towards a male intruder. (l) Strategies for chemogenetic inactivation of MeAFoxp2 and MeADbx1 cells. (m) Representative histological images showing hM4Di (red) expression in the MeA of Foxp2cre and Dbx1cre;LSL-FlpO mice. Blue: DAPI. (n) Experimental timeline of chemogenetic inactivation experiments. (o) Representative raster plots showing the behaviors of 5 Foxp2hM4Di and 5 Foxp2mCherry mice after i.p. injection of saline or CNO in the presence of a male intruder. (p-r) Percent of time Foxp2hM4Di and Foxp2mCherry male mice spent investigating (p) and attacking (q) a male intruder, and the latency to first attack (r). (s-v) Follows the conventions in o-r. CNO injection into Dbx1hM4Di or Dbx1mCherry mice did not change any male-directed behaviors in comparison to those after saline injection. (e, i) McNemar’s test. (f, g, j, k, p-r, t-v) Two-way repeated measures ANOVA followed by Sidak’s multiple comparisons test. n = number of animals. Data are mean ± S.E.M.; *p<0.05, **p<0.01, ***p<0.001, ****p<0.0001.
Figure 8.
Figure 8.. Outputs of MeAFoxp2 and MeADbx1 cells.
(a and c) Strategies for anterograde viral tracing of MeAFoxp2 (a) and MeADbx1 (c) cells. Pie charts showing the distribution of primary infected cells. (b and d) Representative histological images showing the primary infected cells in Foxp2cre (b) and Dbx1cre;LSL-FlpO mice (d).Green: eGFP or GCaMP6f expression. Blue: DAPI staining. (e) The intensity of MeAFoxp2 and MeADbx1 projection field in various regions, calculated as the average pixel intensity in a given region divided by the maximum average value across all regions. (f and h) Representative histological images showing MeAFoxp2 (f) and MeADbx1 (h) projections at various downstream regions. (g and i) Overviews of MeAFoxp2 (g) and MeADbx1 (i) cell outputs. (j) Images showing MeAFoxp2and MeADbx1 cell outputs at pBNST. (k) The intensity of fibers, originating from MeAFoxp2 and MeADbx1 cells, at BNSTpr over that in BNSTif. (l) Representative histological images showing MeAFoxp2 and MeADbx1 projections at the anterior and posterior medial hypothalamus (aMH and pMH). (m) The intensity of fibers, originating from MeAFoxp2 and MeADbx1 cells, at pMH over that in aMH. pMH: Bregma −1.25 mm to −2.15mm; aMH: Bregma 0.14mm to −0.75mm. COApm: posteromedial cortical amygdala; COApl: posterolateral cortical amygdala; AAA: anterior amygdalar area; BA: bed nucleus of the accessory olfactory tract; AVPV: anteroventral periventricular nucleus; PMv: ventral premammillary nucleus. (e) Two-way repeated measures ANOVA followed by Sidak’s multiple comparisons test. (k, m) Two-tailed unpaired t-test. n = number of mice. Data are mean ± S.E.M.; *p<0.05.

References

    1. Wei D., Talwar V. & Lin D. Neural circuits of social behaviors: Innate yet flexible. Neuron 109, 1600–1620 (2021). 10.1016/j.neuron.2021.02.012 - DOI - PMC - PubMed
    1. Newman S. W. The medial extended amygdala in male reproductive behavior. A node in the mammalian social behavior network. Ann N Y Acad Sci 877, 242–257 (1999). 10.1111/j.1749-6632.1999.tb09271.x - DOI - PubMed
    1. Lischinsky J. E. & Lin D. Neural mechanisms of aggression across species. Nat Neurosci 23, 1317–1328 (2020). 10.1038/s41593-020-00715-2 - DOI - PubMed
    1. Mucignat-Caretta C. The rodent accessory olfactory system. J Comp Physiol A Neuroethol Sens Neural Behav Physiol 196, 767–777 (2010). 10.10-07/s00359-0100555-z - DOI - PubMed
    1. Keshavarzi S., Power J. M., Albers E. H., Sullivan R. K. & Sah P. Dendritic Organization of Olfactory Inputs to Medial Amygdala Neurons. J Neurosci 35, 13020–13028 (2015). 10.1523/JNEUROSCI.0627-15.2015 - DOI - PMC - PubMed

Publication types