[Preprint]. 2023 Mar 23:2023.03.21.533091.
doi: 10.1101/2023.03.21.533091.

Tumour mitochondrial DNA mutations drive aerobic glycolysis to enhance checkpoint blockade

Affiliations

Tumour mitochondrial DNA mutations drive aerobic glycolysis to enhance checkpoint blockade

Mahnoor Mahmood et al. bioRxiv. .

Update in

  • Mitochondrial DNA mutations drive aerobic glycolysis to enhance checkpoint blockade response in melanoma.
    Mahmood M, Liu EM, Shergold AL, Tolla E, Tait-Mulder J, Huerta-Uribe A, Shokry E, Young AL, Lilla S, Kim M, Park T, Boscenco S, Manchon JL, Rodríguez-Antona C, Walters RC, Springett RJ, Blaza JN, Mitchell L, Blyth K, Zanivan S, Sumpton D, Roberts EW, Reznik E, Gammage PA. Mahmood M, et al. Nat Cancer. 2024 Apr;5(4):659-672. doi: 10.1038/s43018-023-00721-w. Epub 2024 Jan 29. Nat Cancer. 2024. PMID: 38286828 Free PMC article.

Abstract

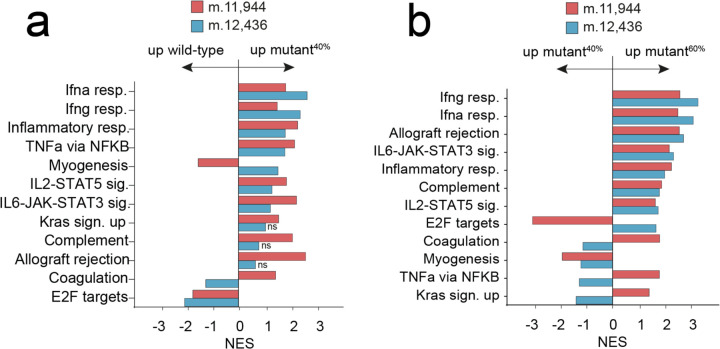
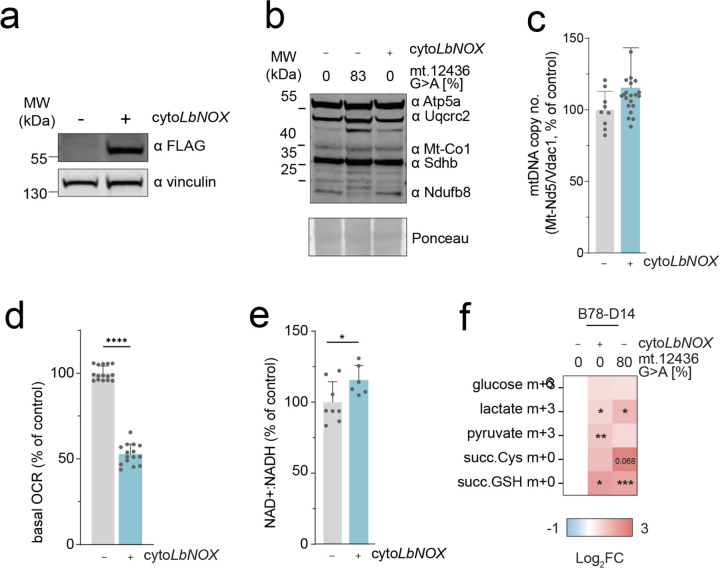
The mitochondrial genome encodes essential machinery for respiration and metabolic homeostasis but is paradoxically among the most common targets of somatic mutation in the cancer genome, with truncating mutations in respiratory complex I genes being most over-represented1. While mitochondrial DNA (mtDNA) mutations have been associated with both improved and worsened prognoses in several tumour lineages1-3, whether these mutations are drivers or exert any functional effect on tumour biology remains controversial. Here we discovered that complex I-encoding mtDNA mutations are sufficient to remodel the tumour immune landscape and therapeutic resistance to immune checkpoint blockade. Using mtDNA base editing technology4 we engineered recurrent truncating mutations in the mtDNA-encoded complex I gene, Mt-Nd5, into murine models of melanoma. Mechanistically, these mutations promoted utilisation of pyruvate as a terminal electron acceptor and increased glycolytic flux without major effects on oxygen consumption, driven by an over-reduced NAD pool and NADH shuttling between GAPDH and MDH1, mediating a Warburg-like metabolic shift. In turn, without modifying tumour growth, this altered cancer cell-intrinsic metabolism reshaped the tumour microenvironment in both mice and humans, promoting an anti-tumour immune response characterised by loss of resident neutrophils. This subsequently sensitised tumours bearing high mtDNA mutant heteroplasmy to immune checkpoint blockade, with phenocopy of key metabolic changes being sufficient to mediate this effect. Strikingly, patient lesions bearing >50% mtDNA mutation heteroplasmy also demonstrated a >2.5-fold improved response rate to checkpoint inhibitor blockade. Taken together these data nominate mtDNA mutations as functional regulators of cancer metabolism and tumour biology, with potential for therapeutic exploitation and treatment stratification.


Conflict of interest statement

Competing interests M.M., E.R. and P.A.G. are named inventors on patent applications resulting from this work filed by Cancer Research Horizons. P.A.G is a shareholder, and has been a consultant and Scientific Advisory Board member to Pretzel Therapeutics Inc.

Figures

Extended Data Figure 1.
Extended Data Figure 1.. Mitochondrial base editors for two independent targets in mt-Nd5.
A Immunoblot of DdCBE pair expression post-sort. αHA and αFLAG show expression of left (TALE-L) and right TALEs (TALE-R) respectively. Representative result is shown. B Off-target C>T activity of DdCBEs on mtDNA by ultra-deep amplicon resequencing of whole mtDNA. Figure depicts mutations detected at heteroplasmies >2% and is a measure of mutations detected relative to wild-type. These mutations likely do not impact our key observations as both models behave similarly across experiments.
Extended Data Figure 2.
Extended Data Figure 2.. Proteomic analysis of isogenic mt-Nd5 mutant cell lines reveals significant changes primarily in complex I genes.
Volcano plot showing detected differences in protein abundance of A mt.1243660% cells and B mt.1194460% cells versus wild-type. Differences of p < 0.05 and log2 fold change > 0.5 shown in red (n=3 separately collected cell pellets were measured per cell line). Heatmaps of protein abundances for C complex I, D complex II, E complex III, F complex IV and G complex V nuclear and mitochondrial subunits. Wilcoxon signed rank test (A, B) and a one-way ANOVA test with Sidak multiple comparisons test (C-G) were applied
Extended Data Figure 3.
Extended Data Figure 3.. mt.-Nd5 truncations do not impact mitochondrial mRNA expression levels, but alter intracellular redox state and mitochondrial membrane potential.
A Expression of mitochondrial genes (n=12 separate cell pellets were sampled per genotype). B Measurements of the electrical component of the proton motive force, ΔΨ, the chemical component of the proton motive force ΔpH and total protonmotive force, ΔP (n=4 separate wells were sampled per genotype). C GSH : GSSG ratio (n= 6–12 separate wells were sampled per cell type). A high GSH : GSSG ratio represents a more reductive intracellular environment. D Mitochondrial NADH oxidation state (n=4 separate wells for sampled per genotype). All P-values were determined using a one-way ANOVA test with Sidak multiple comparisons test. Error bars indicate SD. Measure of centrality is mean.
Extended Data Figure 4.
Extended Data Figure 4.. Independent mt-Nd5 truncations at matched heteroplasmy produce consonant changes in metabolite abundance.
Comparison of steady-state metabolite changes of m.12,43660% and m.11,94460% cells, each relative to wild-type (n= 6–9 separate wells per sample).
Extended Data Figure 5.
Extended Data Figure 5.. U-13C-glutamine labelling demonstrates that a proportion of the increased malate abundance is derived from cytosolic oxaloacetate.
A Labeling fate of 13C derived from U-13C-glutamine via oxidative decarboxylation versus reductive carboxylation of glutamine. B Malate m+3 abundance, derived from U-13C-glutamine (n=9 separate wells were sampled per genotype). C malate m+3 : malate m+2 ratio, derived from U-13C-glutamine (n= 9 separate wells were sampled per genotype). D AS m+3: AS m+2 ratio, derived from U-13C-glutamine (n= 9 separate wells were sampled per genotype). All P-values were determined using a one-way ANOVA test with Sidak multiple comparisons test. Error bars indicate SD. Measure of centrality is mean.
Extended Data Figure 6.
Extended Data Figure 6.. Increased malate abundance occurs at the level of MDH1 but is not directly due to cytosolic redox potential.
A Labeling fate of 13C derived from 1-13C-glutamine which exclusively labels metabolites derived from the reductive carboxylation of glutamine. B Aconitate m+1 abundance, derived from 1-13C-glutamine (n= 9 separate wells were sampled per genotype). C Aspartate m+1 abundance, derived from 1-13C-glutamine (n= 9 separate wells were sampled per genotype). D AS m+1 abundance, derived from 1-13C-glutamine (n= 9 separate wells were sampled per genotype). E Immunoblot of siRNA mediated depletion of Mdh1. Representative image shown. F Immunoblot of cytoLbNOX expression 36hrs post-sort, detected using αFLAG. Representative image shown. G AS m+1 abundance, derived from 1-13C-glutamine with indicated treatment (n = 6–12 separate wells were sampled per genotype per condition). All P-values were determined using a one-way ANOVA test with Sidak multiple comparisons test. Error bars indicate SD. Measure of centrality is mean.
Extended Data Figure 7.
Extended Data Figure 7.. Increased malate abundance in mutant cells is partially due to MDH2 reversal.
A Labeling fate of 13C derived from U-13C-glucose. B Pyruvate m+3 abundance, derived from U-13C-glucose (n = 7–8 separate wells were sampled per genotype). C Citrate m+2 : pyruvate m+3 ratio, derived from U-13C-glucose (n = 6–7 separate wells were sampled per genotype). D Malate m+3 : citrate m+3 ratio, derived from U-13C-glucose (n = 7–8 separate wells were sampled per genotype). E Immunoblot of mitoLbNOX expression 36hrs post-transfection, detected using αFLAG. Representative image shown. All P-values were determined using a one-way ANOVA test with Sidak multiple comparisons test. Error bars indicate SD. Measure of centrality is mean.
Extended Data Figure 8.
Extended Data Figure 8.. 4-2H1-glucose tracing demonstrates that shuttling of electrons between MDH1 and GAPDH drives aerobic glycolysis.
A Lactate m+1 abundance, derived from 4-2H1-glucose with indicated treatment (n = 7–9 separate wells were sampled per genotype per condition). B NADH m+1 abundance, derived from 4-2H1-glucose with indicated treatment (n = 6–8 separate wells were sampled per genotype per condition). All P-values were determined using a one-way ANOVA test with Sidak multiple comparisons test. Error bars indicate SD. Measure of centrality is mean.
Extended Data Figure 9.
Extended Data Figure 9.. Mutant cells demonstrate a heteroplasmy dose-dependent sensitivity to respiratory chain inhibitors.
A IC50 curve for metformin. IC50 for wild-type = 26.31 ± 1.49mM, for mt.1243660% = 16.60 ± 2.43mM, for mt.1243680% = 5.89 ± 0.71mM and for mt.1194480% = 22.93 ± 0.70mM B IC50 curve for rotenone. IC50 for wild-type = 0.236 ± 0.026µM, for mt.1243660% = 0.235 ± 0.035µM, for mt.1243680% = 0.493 ± 0.108µM and for mt.1194460% = 0.205 ± 0.033µM and C IC50 curve for oligomycin. IC50 for wild-type = 13.81 ± 3.80µM, for mt.1243660% = 13.52 ± 3.32µM, for mt.1243680% = 7.75 ± 0.56µM and for mt.1194480% = 13.54 ± 3.32µM (n = 4 separate wells per drug concentration per genotype). This was repeated 3 times and a representative result is shown.
Extended Data Figure 10:
Extended Data Figure 10:. Allografted B78-D14 lineage tumours do not exhibit macroscopic differences beyond metabolic indicators of disrupted MAS.
Representative H&E sub-section of A wild-type, B m.12,43640% and C m.12,43660% tumours. D Change in detected heteroplasmy in bulk tumour samples (n= 5–12 tumours per genotype). E Bulk tumour mtDNA copy number (n= 4–13 tumours per genotype). F Heatmap of steady-state abundance of metabolically terminal fumarate adducts, succinylcysteine and succinicGSH, demonstrating that metabolic changes observed in vitro are preserved in vivo (n= 12 tumours per genotype). All P-values were determined using a one-way ANOVA test with Sidak multiple comparisons test. Error bars indicate SD. Measure of centrality is mean.
Extended Data Figure 11.
Extended Data Figure 11.. Bulk tumour transcriptional signatures show dose-dependent, heteroplasmy changes in immune-relevant transcriptional phenotypes.
GSEA of bulk tumour RNAseq data (n=5–6 tumours per genotype ) showing A mutant40% versus wild-type and B mutant60% versus mutant40%. Only genesets with adj. p-value <0.1 are shown unless otherwise stated. Wilcoxon signed rank test applied.
Extended Data Figure 12.
Extended Data Figure 12.. Malignant cells were defined in scRNAseq analysis as aneuploid cells with low or nil Ptprc (CD45) expression and high epithelial score.
UMAP indicating A Ptprc expression, B epithelial score and C aneuploidy as determined by copykat prediction. These criteria were employed as the B78 cells lack distinct transcriptional signatures.
Extended Data Figure 13.
Extended Data Figure 13.. Mutant cells did not have significant changes in transcriptional signatures in vitro.
A Significantly co-regulated transcripts from combined 60% mutant cells versus wild-type (n=12 cell pellets were sampled per genotype). Volcano plot showing differences in gene expression of A mt.1243660% cells and B mt.1194460% cells versus wild-type. Differences of p < 0.05 and log2 fold change > 1 shown in red (n=12 separate wells were sampled). Wilcoxon signed rank test applied.
Extended Data Figure 14.
Extended Data Figure 14.. scRNAseq analyses reveal distinct alterations in the tumour immune microenvironment of mtDNA mutant tumours.
Proportion of tumour resident: A immature monocytes; and B CD4+ T-cells relative to the total malignant and non-malignant cells (n = 3–7 tumours per genotype). C UMAP coloured by GSEA NES score for allograft rejection geneset. Proportion of tumour resident: D CD4+ T cells; and E natural killer (NK) cells relative to the total malignant and non-malignant cells (n = 3–7 tumours per genotype). F Relative PD-L1 expression within each cell (n = 3–7 tumours per genotype). One-way ANOVA test with Wilcoxon signed rank test (A) and two-tailed student’s t-test (A-B, D-E) were applied. Error bars indicate SEM. Measure of centrality is mean. Box plots indicate interquartile range (A-B, D-E). NES: normalised expression score. DC, dendritic cell.
Extended Data Figure 15.
Extended Data Figure 15.. Remodelling of the tumour microenvironment in mutant cells sensitizes tumours to checkpoint blockade.
Harvested tumour weight at day 21 (n= 5–15 tumours per genotype). One-way ANOVA test with Sidak multiple comparisons test was applied. Error bars indicate SD. Measure of centrality is mean.
Extended Data Figure 16.
Extended Data Figure 16.. HcMel12 mutant cells recapitulate the cellular and metabolic phenotypes observed in B78-D14 cells.
A Heteroplasmy changes upon subsequent transfection of melanoma cell lines (n= 3 separate cell pellets per genotype). B Immunoblot of indicative respiratory chain subunits. Representative result is shown. C mtDNA copy number (n= 12 separate wells per genotype). D Basal oxygen consumption rate (OCR) (n = 6 measurements (12 wells per measurement) per genotype). E Proliferation rate of cell lines in permissive growth media (n = 3 separate wells per genotype) F Energy (adenylate) charge state (n = 9 separate wells per genotype). G NAD+:NADH ratio (n= 9 separate wells per genotype). H GSH : GSSG ratio (n= 8–9 separate wells per genotype). I Heatmap of unlabelled steady-state abundance of select mitochondrial metabolites, arginine, argininosuccinate (AS) and terminal fumarate adducts succinylcysteine (succ. Cys) and succinicGSH (succ.GSH) (n= 9 separate wells per genotype). J Heatmap of unlabelled steady-state metabolite abundances for select intracellular glycolytic intermediates and extracellular lactate (ex. lactate) (n= 9 separate wells per genotype). P-values were determined using a one-way ANOVA test with (C-D) Sidak multiple comparisons test, Fisher’s LSD Test (E)or (F-J) a one-tailed student’s t-test. Error bars indicate SD. Measure of centrality is mean.
Extended Data Figure 17.
Extended Data Figure 17.. Untreated Hcmel12 lineage tumours recapitulate B78-D14 lineage.
A Survival of C57/BL6 mice subcutaneously injected with indicated cells (n = 9–10 animals per genotype). B Tumour weight at endpoint (n = 9–10 tumours per genotype). C Change in detected heteroplasmy in bulk tumour samples (n= 9 tumours per genotype). D Bulk tumour mtDNA copy number (n= 9 tumours per genotype). E Heatmap of steady-state abundance of metabolic terminal fumarate adducts, succinylcysteine and succinicGSH, demonstrating that metabolic changes observed in B78 mutant tumours are preserved in vivo (n= 9 tumours per genotype). P-values were determined using a one-way ANOVA test with (B,D) Sidak multiple comparisons test or student’s one-tailed t-test (E). Error bars indicate SD. Measure of centrality is mean.
Extended Data Figure 18.
Extended Data Figure 18.. Constitutive expression of cytoLbNOX phenocopies metabolic changes observed in mt-Nd5 mutant cells.
A. Immunoblot of cytoLbNOX expression in clonal population, detected using αFLAG. Representative image shown. B. Immunoblot of indicative respiratory chain subunits. Representative result is shown. C. mtDNA copy number (n= 9 separate wells per genotype). D Basal oxygen consumption rate (OCR) (n = 9–15 measurements (6 wells per measurement) per genotype) A significant decrease is observed in HcMel12 cytoLbNOX, akin to the decrease in basal OCR measured in m.12,43680% cells. E. NAD+:NADH ratio (n= 11–12 separate wells per genotype ). F. Heatmap of metabolite abundance of glucose m+3, lactate m+3, pyruvate m+3, and terminal fumarate adducts succinylcysteine (succ. Cys) and succinicGSH (succ.GSH) in U-13C-glucose labelling of B78 cells. B78 wild-type cells were transiently transfected with cytoLbNOX and metabolites were extracted 3 days post-sort. A significant increase in lactate abundance was observed in cytoLbNOX-expressing cells mimicking that observed in m.12,43680% cells. (n= 9–13 separate wells per genotype). All P-values were determined using a one-paired student’s t-test. Error bars indicate SD. Measure of centrality is mean.
Figure 1.
Figure 1.. Mitochondrial base editing to produce isogenic cell lines bearing independent truncating mutation heteroplasmies in mt-Nd5.
A Schematic of TALE-DdCBE design employed. TALEs were incorporated into a backbone containing a mitochondria-targeting cassette, split-half DdCBE and uracil glycosylase inhibitor (UGI). B Schematic of the murine mtDNA. Targeted sites within mt-Nd5 are indicated. C TALE-DdCBE pairs used to induce a G>A mutation at mt.12,436 and mt.11,944. D Workflow used to produce mt-Nd5 mutant isogenic cell lines. E Heteroplasmy measurements of cells generated in D (n = 6 separate wells were sampled). F Immunoblot of indicative respiratory chain subunits. Representative result is shown. G Assembled complex I abundance and in-gel activity of complexes I and II. Representative result is shown. H mtDNA copy number (n= 9 separate wells were sampled). I Basal oxygen consumption rate (OCR) (n = 9–12 measurements (12 wells per measurement) were made). J Energy (adenylate) charge state (n = 17 separate wells were sampled). K Proliferation rate of cell lines in permissive growth media. (n = 12 separate wells were measured in three batches) L NAD+:NADH ratio (n= 11–12 separate wells were measured). All P-values were determined using a one-way ANOVA test with (E, H-I, K) Sidak multiple comparisons test or (J,L) Fisher’s LSD Test. Error bars indicate SD. Measure of centrality is mean.
Figure 2:
Figure 2:. Mutant cells undergo a metabolic shift towards glycolysis due to cellular redox imbalance.
A Heatmap of unlabelled steady-state abundance of select mitochondrial metabolites, arginine, argininosuccinate (AS) and terminal fumarate adducts succinylcysteine (succ. Cys) and succinicGSH (succ.GSH). B Labelling fate of 13C derived from 1-13C-glutamine. C Malate m+1 abundance, derived from 1-13C-glutamine with indicated treatment (n = 6–11 separate wells were sampled). D Heatmap of unlabelled steady-state metabolite abundances for select intracellular glycolytic intermediates and extracellular lactate (ex. lactate). E Labelling fate of U-13C-glucose. F Abundance of U-13C-glucose derived lactate m+3 with indicated treatment (n = 6–9 separate wells were sampled). G Labelling fate of 2H derived from 4-2H1-glucose; mitoLbNOX not shown for clarity. H Malate m+1 abundance, derived from 4-2H1-glucose with indicated treatment (n = 5–16 separate wells were sampled). I IC50 curves for 2-DG (n = 4 separate wells measured per drug concentration). This was repeated 3 times and a representative result is shown. P-values were determined using a one-way ANOVA test with (A, D) Sidak multiple comparisons test or Fisher’s LSD Test (C, F, H). Error bars indicate SD. Measure of centrality is mean.
Figure 3:
Figure 3:. Tumour mtDNA mutations reshape the immune microenvironment.
A Survival of C57/BL6 mice subcutaneously injected with indicated cells (n = 5–12 animals per condition). B Tumour weight at endpoint (n = 5–12 tumours per genotype). C Geneset enrichment analysis (GSEA) of bulk tumour RNA sequencing (RNAseq) data (n=5–6 tumours per genotype). Only genesets with adj. P-value <0.1 are shown. D GSEA of RNAseq obtained from Hartwig Medical Foundation (HMF) metastatic melanoma patient cohort. Cancers are stratified by mtDNA status into wild-type and mtDNA mutant with >50% variant allele frequency (VAF). E UMAP of seurat clustered whole tumour scRNAseq from indicated samples. F UMAP indicating cell type IDs. DC, dendritic cells. pDC, plasmacytoid dendritic cell. G GSEA of malignant cells identified in scRNAseq analysis. UMAPs coloured by GSEA score for: H interferon alpha response; I interferon gamma response; J inflammatory response; K IL2-Stat5 signalling. L Proportion of tumour resident neutrophils relative to total malignant and non-malignant cells (n = 17 tumours). M UMAP coloured by GSEA for OXPHOS geneset. One-way ANOVA test with Sidak multiple comparisons test (B), Wilcoxon signed rank test (G-K) and two-tailed student’s t-test (L-O) were applied. Error bars indicate SD (B) or SEM (L-O). Measure of centrality is mean. Box plots indicate interquartile range (J-M). NES: normalised expression score.
Figure 4:
Figure 4:. mtDNA mutation-associated microenvironment remodelling sensitises tumours to checkpoint blockade.
A Schematic of the experimental plan and dosing regimen for B78-D14 tumours with anti-PD1 monoclonal antibody (mAb). B Representative images of harvested tumours at day 21. C Tumour weights at day 21 (n = 10–19 tumours per genotype). D Schematic of experimental plan and dosing regimen for Hcmel12 tumours with anti-PD1 mAb. E Representative images of harvested tumours at day 13. F Tumour weights at day 13 (n = 7 tumours per genotype). G Stratification of a metastatic melanoma patient cohort by mtDNA status. H Response rate of patients to nivolumab by tumour mtDNA mutation status. One-way ANOVA test with Sidak multiple comparisons test (C), student’s one-tailed t-test (F)or chi-squared test (H) were applied. Error bars indicate SD. Measure of centrality is mean.

References

    1. Gorelick A. N. et al. Respiratory complex and tissue lineage drive recurrent mutations in tumour mtDNA. Nat. Metab. (2021) doi:10.1038/s42255-021-00378-8. - DOI - PMC - PubMed
    1. Hopkins J. F. et al. Mitochondrial mutations drive prostate cancer aggression. Nat. Commun. (2017) doi:10.1038/s41467-017-00377-y. - DOI - PMC - PubMed
    1. Schöpf B. et al. OXPHOS remodeling in high-grade prostate cancer involves mtDNA mutations and increased succinate oxidation. Nat. Commun. 11, (2020). - PMC - PubMed
    1. Mok B. Y. et al. A bacterial cytidine deaminase toxin enables CRISPR-free mitochondrial base editing. Nature 583, 631–637 (2020). - PMC - PubMed
    1. Kim M., Mahmood M., Reznik E. & Gammage P. A. Mitochondrial DNA is a major source of driver mutations in cancer. Trends in Cancer 8, 1046–1059 (2022). - PMC - PubMed

Publication types