[Preprint]. 2023 Mar 22:2023.03.17.533208.
doi: 10.1101/2023.03.17.533208.

Tuft cell-derived acetylcholine regulates epithelial fluid secretion

Affiliations

Tuft cell-derived acetylcholine regulates epithelial fluid secretion

Tyler E Billipp et al. bioRxiv. .

Update in

Abstract

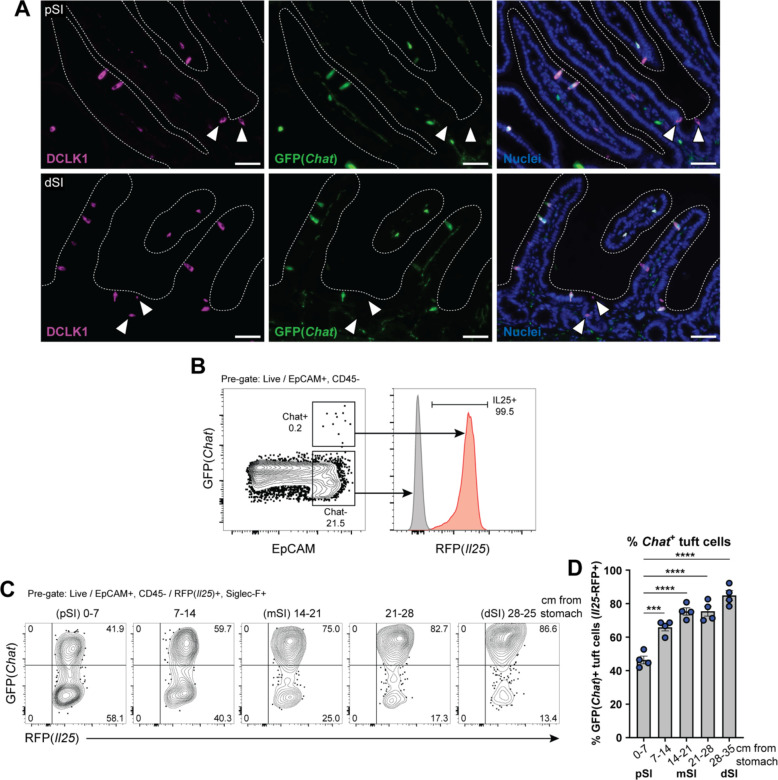
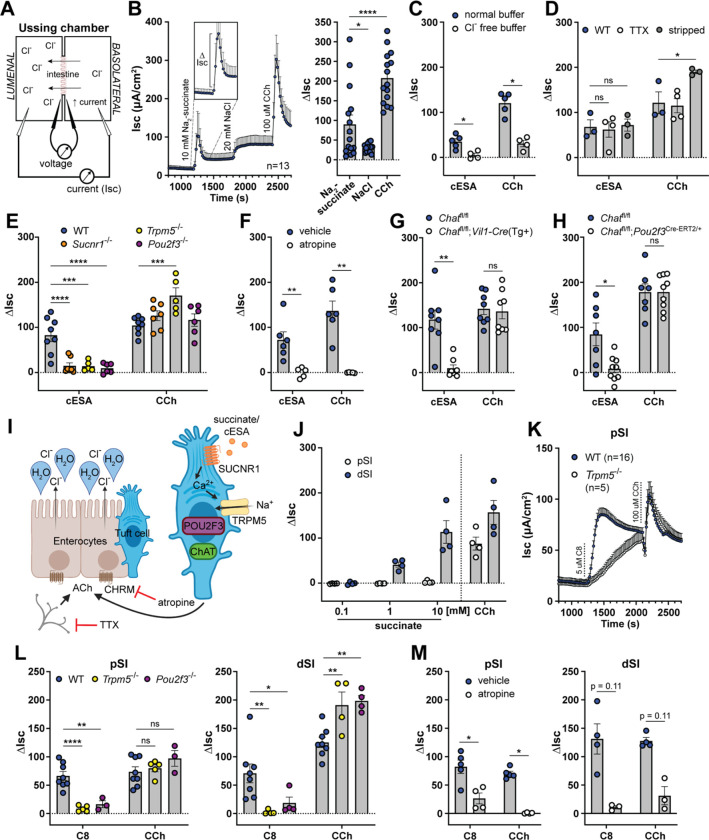
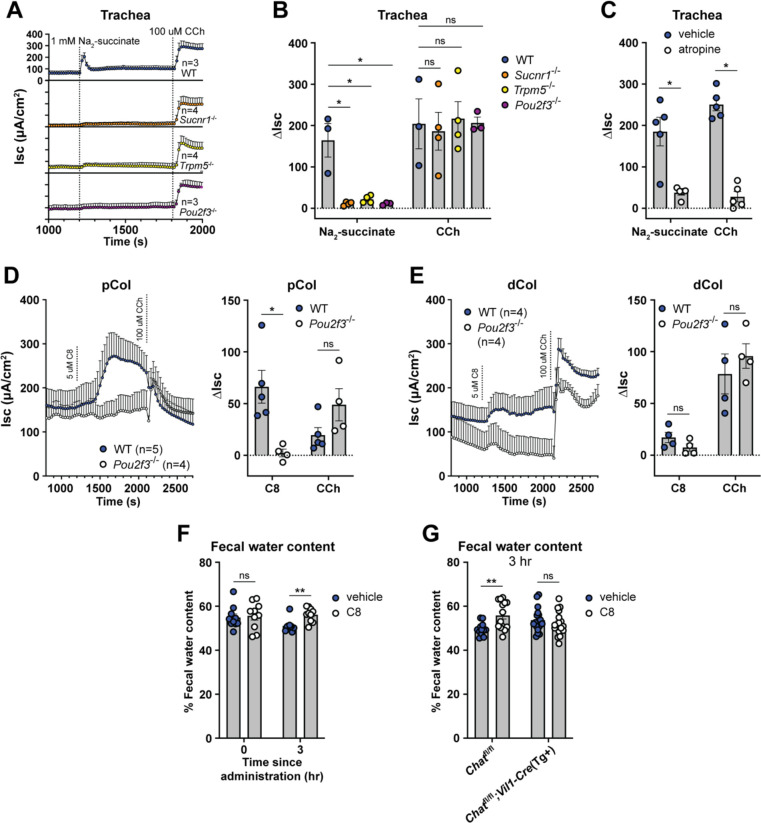
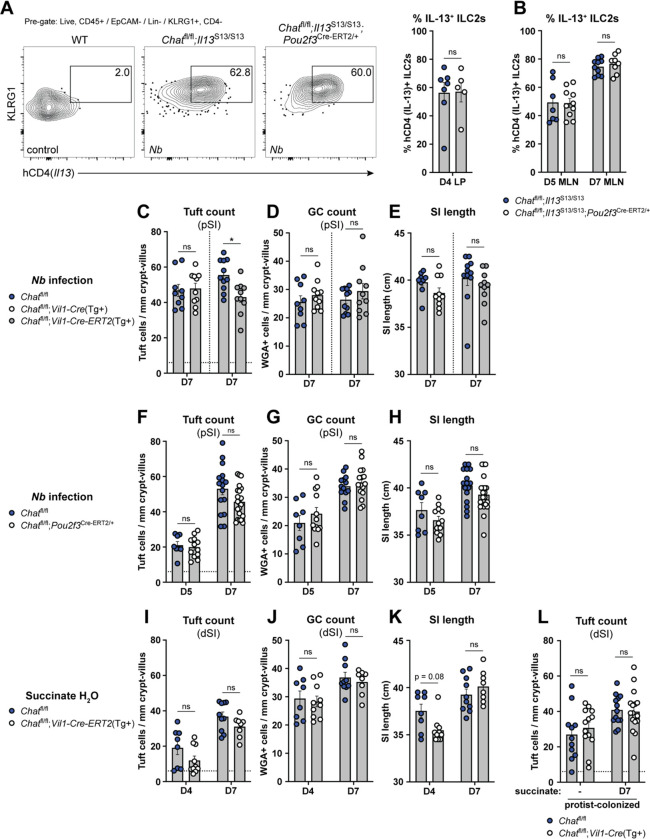
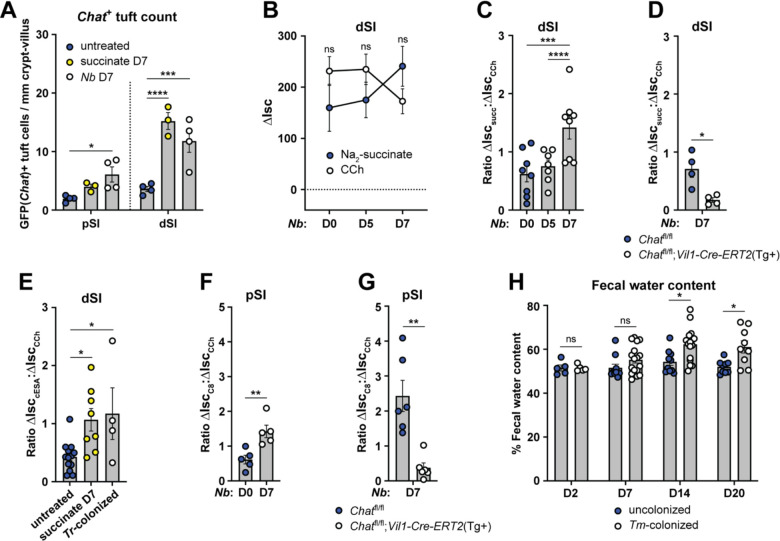
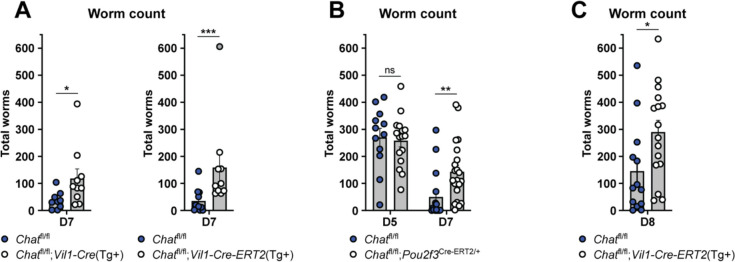
Tuft cells are solitary chemosensory epithelial cells that can sense lumenal stimuli at mucosal barriers and secrete effector molecules to regulate the physiology and immune state of their surrounding tissue. In the small intestine, tuft cells detect parasitic worms (helminths) and microbe-derived succinate, and signal to immune cells to trigger a Type 2 immune response that leads to extensive epithelial remodeling spanning several days. Acetylcholine (ACh) from airway tuft cells has been shown to stimulate acute changes in breathing and mucocilliary clearance, but its function in the intestine is unknown. Here we show that tuft cell chemosensing in the intestine leads to release of ACh, but that this does not contribute to immune cell activation or associated tissue remodeling. Instead, tuft cell-derived ACh triggers immediate fluid secretion from neighboring epithelial cells into the intestinal lumen. This tuft cell-regulated fluid secretion is amplified during Type 2 inflammation, and helminth clearance is delayed in mice lacking tuft cell ACh. The coupling of the chemosensory function of tuft cells with fluid secretion creates an epithelium-intrinsic response unit that effects a physiological change within seconds of activation. This response mechanism is shared by tuft cells across tissues, and serves to regulate the epithelial secretion that is both a hallmark of Type 2 immunity and an essential component of homeostatic maintenance at mucosal barriers.


Figures

Figure 1:
Figure 1:. SI tuft cells express Chat in a proximal to distal gradient.
(A) Representative images of GFP(Chat) expression (green) by DCLK1+ tuft cells (magenta) in the proximal SI (pSI) and distal SI (dSI) by immunofluorescence. White arrows indicate GFP(Chat)- tuft cells. Nuclei stained with DAPI (blue). Scale bars: 50 μm (B) GFP+ epithelial cells (EpCAM+) are RFP(Il25)+ tuft cells. (C and D) (C) Representative flow cytometry and (D) quantification of the percentage of GFP+ tuft cells by sequential 7 cm section across the length of the SI. In D, each symbol represents an individual mouse (columns represent different tissues from same mouse) from three pooled experiments. *p < 0.05, **p < 0.01, ***p < 0.001 by one way ANOVA with Tukey’s multiple comparisons test (D). mSI, medial SI. Graphs depict mean +/− SEM. Also see Figure S1.
Figure 2:
Figure 2:. Tuft cell-derived ACh induces epithelial fluid secretion.
(A) Ussing chamber schematic. (B) Average Isc traces and quantification of the delta Isc (ΔIsc, see inset and bar graph) of WT dSI tissue stimulated as indicated (10 mM Na2-succinate and 20 mM NaCl, lumenal; 100 μM CCh, basolateral). (C) ΔIsc values of WT dSI in presence of normal chloride- (Cl) containing buffer or buffer selectively lacking Cl, stimulated as indicated (10 mM cESA, lumenal). (D) ΔIsc values of WT intact dSI compared to stripped dSI and dSI pretreated 15 min with TTX (1 μM, basolateral), stimulated as indicated. (E) DIsc values of dSI from mice of indicated genotypes stimulated as indicated. (F) ΔIsc values of WT dSI compared to dSI pretreated 15 min with pan-CHRM inhibitor atropine (10 μM, basolateral), stimulated as indicated. (G and H) ΔIsc values of dSI with (G) epithelial cell- (Vil1-Cre) and (H) tuft cell-specific (Pou2f3ERT2-Cre/+) Chat deletion, stimulated as indicated. (I) Model of tuft cell chemosensing of succinate driving ACh-dependent fluid secretion independent of neurons. (J) ΔIsc values of WT pSI and dSI stimulated as indicated. (K) Average Isc traces of pSI from WT or Trpm5−/− mice stimulated as indicated (5 μM C8, basolateral). (L and M) ΔIsc values of WT tissues compared to (L) tissues from indicated genotypes or (M) tissues pretreated 15 min with atropine (10 μM, basolateral), stimulated as indicated. In the graphs, each symbol represents an individual mouse (one tissue or average of two) pooled from two or more experiments. Groups represent sequential stimulations of the same tissue. *p < 0.05, **p < 0.01, ***p < 0.001, ****p < 0.001 by RM one way ANOVA with Tukey’s multiple comparisons test (B), two way ANOVA with Dunnett’s multiple comparisons test (D, E, L), multiple Mann-Whitney tests with Holm Sídák’s multiple comparisons test (C, F, G, H, M). ns, not significant. Graphs depict mean +/− SEM. Also see Figure S2.
Figure 3:
Figure 3:. Tuft cell-mediated fluid secretion occurs across mucosal tissues and is detectable in vivo.
(A and B) (A) Average Isc traces and (B) ΔIsc values of trachea from mice of indicated genotypes stimulated as indicated (1 mM Na2-succinate, lumenal; 100 μM CCh, basolateral). (C) ΔIsc values of WT trachea compared to trachea pretreated 15 min with atropine (10 μM, basolateral), stimulated as indicated. (D and E) Average Isc traces and ΔIsc values of WT and Pou2f3−/− tissues stimulated as indicated (5 μM C8, basolateral). (F and G) Quantification of water content of fecal pellets collected from (A) WT or (B) Chat-fl;Vil1-Cre(Tg+) mice treated orally with vehicle or C8 (30 mg/kg) for the indicated durations. In the graphs, each symbol represents an individual mouse (one tissue or average of two) pooled from two or more experiments. Groups represent sequential stimulations or timepoints of the same tissue or animal. *p < 0.05, **p < 0.01, ***p < 0.001, ****p < 0.001 by, two way ANOVA with Tukey’s multiple comparisons test (B), or multiple Mann-Whitney tests with Holm Sídák’s multiple comparisons test (C-G). ns, not significant. Graphs depict mean +/− SEM. Also see Figure S3.
Figure 4:
Figure 4:. Tuft cell-derived ACh is not required for ILC2 activation or intestinal remodeling.
(A and B) (A) Representative flow cytometry and quantification of percent hCD4+ (IL-13+) ILC2s (Lin, CD45+, KLRG1+, CD4) in the SI LP and (B) mesenteric lymph nodes (MLN) at the indicated Nb infection timepoints. (C, D, and E) (C) Quantification of pSI tuft cells (DCLK1+) and (D) goblet cells (WGA+) by immunofluorescence and (E) total SI length from the indicated mice at D7 of Nb infection. (F, G, and H) Same analysis as in C-E in the indicated mice at the indicated Nb infection timepoints. (I, J, and K) Same analysis as in C-E in the indicated mice at the indicated timepoints of 150 mM succinate drinking water treatment. (L) Quantification of tuft cells (DCLK1+) by immunofluorescence from indicated mice vertically-colonized with T. rainier protists with or without 7 days of additional 150 mM succinate drinking water treatment. In the graphs, each symbol represents an individual mouse from two or more pooled experiments. For graphs of tuft cell counts, horizontal dashed line signifies baseline tuft cell count in unmanipulated mice. *p < 0.05, **p < 0.01, ***p < 0.001, ****p < 0.001 by Mann Whitney test (A) or multiple Mann-Whitney tests with Holm Sídák’s multiple comparisons test (B-L). ns, not significant. Graphs depict mean +/− SEM. Also see Fig. S4.
Figure 5:
Figure 5:. Tuft cell hyperplasia results in enhanced ACh-dependent fluid secretion.
(A) Quantification of GFP(Chat)+ tuft cells (Il25-RFP+) from the pSI and dSI of WT mice untreated, treated with 150 mM Na2-succinate drinking water (succinate), or infected with N. brasiliensis (Nb) for 7 days. (B) ΔIsc values of dSI from WT mice infected with Nb for the indicated number of days and stimulated as indicated (10 mM succinate, lumenal; 100 μM CCh, basolateral). (C) Ratio of succinate ΔIsc values to CCh ΔIsc values of dSI from (B). (D) Ratio of succinate ΔIsc values to CCh ΔIsc values of dSI of indicated mice 7 days after Nb infection. (E) Ratio of cESA ΔIsc values to CCh ΔIsc values of dSI from WT mice treated with succinate (as in A) or vertically colonized with T. rainier (Tr) protists. (F and G) Ratio of C8 ΔIsc values to CCh ΔIsc values of pSI from (F) WT or (G) mice of indicated genotypes mice at indicated timepoints after Nb infection. (H) Quantification of water content of fecal pellets collected at indicated timepoints post T. musculis (Tm) colonization of WT mice. In the graphs, each symbol represents an individual mouse pooled from two or more experiments. *p < 0.05, **p < 0.01, ***p < 0.001, ****p < 0.001 by two way ANOVA with Dunnett’s multiple comparisons test (A), Mann-Whitney test (B, D, F-G), one way ANOVA (C, E), or multiple Mann-Whitney tests with Holm Sídák’s multiple comparisons test (H). ns, not significant. Graphs depict mean +/− SEM. Also see Fig. S5.
Figure 6:
Figure 6:. Tuft cell-derived ACh contributes to helminth clearance.
(A and B) Quantification of total SI Nb in mice of indicated genotypes at (A) 7 or (B) indicated days post infection. (C) Quantification of total SI Nb 8 days post infection in mice of indicated genotypes given single dose of tamoxifen on D5. In the graphs, each symbol represents an individual mouse pooled from two or more experiments. *p < 0.05, **p < 0.01, ***p < 0.001, ****p < 0.001 by Mann-Whitney test (A, C), or multiple Mann-Whitney tests with Holm Sídák’s multiple comparisons test (B). ns, not significant. Graphs depict mean +/− SEM. Also see Fig. S6.

References

    1. Frizzell R.A., and Hanrahan J.W. (2012). Physiology of epithelial chloride and fluid secretion. Cold Spring Harb Perspect Med 2, a009563. 10.1101/cshperspect.a009563. - DOI - PMC - PubMed
    1. Cooke H.J. (1998). “Enteric Tears”: Chloride Secretion and Its Neural Regulation. News Physiol Sci 13, 269–274. - PubMed
    1. Xue J., Askwith C., Javed N.H., and Cooke H.J. (2007). Autonomic nervous system and secretion across the intestinal mucosal surface. Auton Neurosci 133, 55–63. 10.1016/j.autneu.2007.02.001. - DOI - PMC - PubMed
    1. Hirota C.L., and McKay D.M. (2006). Cholinergic regulation of epithelial ion transport in the mammalian intestine. Br J Pharmacol 149, 463–479. 10.1038/sj.bjp.0706889. - DOI - PMC - PubMed
    1. Cox M.A., Bassi C., Saunders M.E., Nechanitzky R., Morgado-Palacin I., Zheng C., and Mak T.W. (2020). Beyond neurotransmission: acetylcholine in immunity and inflammation. J Intern Med 287, 120–133. 10.1111/joim.13006. - DOI - PubMed

Publication types