[Preprint]. 2023 Aug 21:2023.03.19.533370.
doi: 10.1101/2023.03.19.533370.

Inferring compound heterozygosity from large-scale exome sequencing data

Affiliations

Inferring compound heterozygosity from large-scale exome sequencing data

Michael H Guo et al. bioRxiv. .

Update in

  • Inferring compound heterozygosity from large-scale exome sequencing data.
    Guo MH, Francioli LC, Stenton SL, Goodrich JK, Watts NA, Singer-Berk M, Groopman E, Darnowsky PW, Solomonson M, Baxter S; gnomAD Project Consortium; Tiao G, Neale BM, Hirschhorn JN, Rehm HL, Daly MJ, O'Donnell-Luria A, Karczewski KJ, MacArthur DG, Samocha KE. Guo MH, et al. Nat Genet. 2024 Jan;56(1):152-161. doi: 10.1038/s41588-023-01608-3. Epub 2023 Dec 6. Nat Genet. 2024. PMID: 38057443 Free PMC article.

Abstract

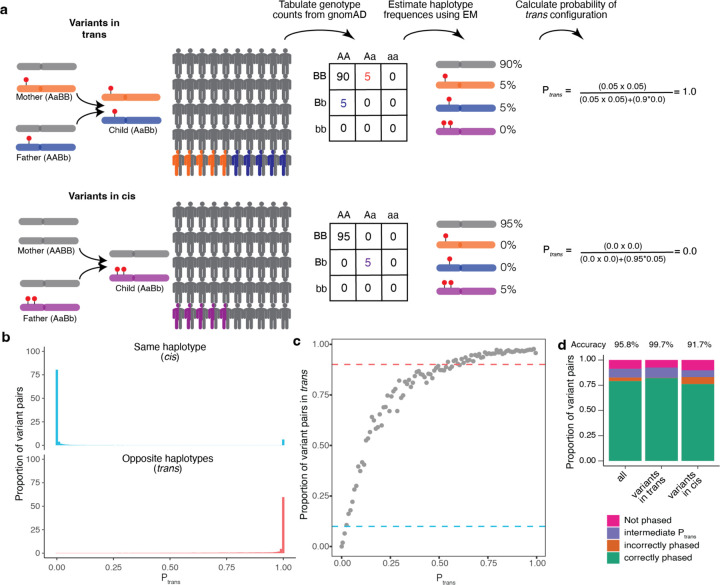
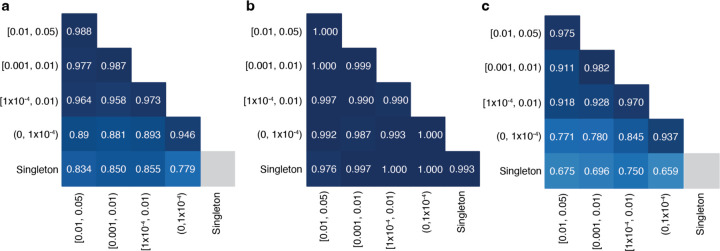
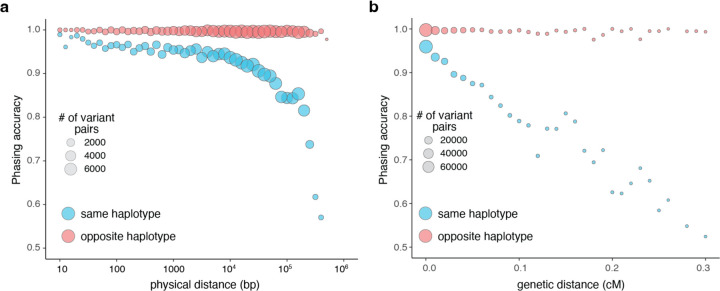
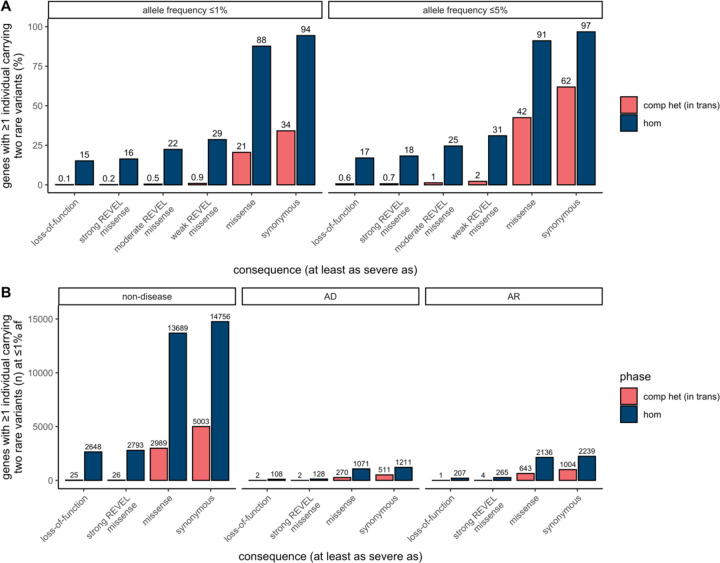
Recessive diseases arise when both the maternal and the paternal copies of a gene are impacted by a damaging genetic variant in the affected individual. When a patient carries two different potentially causal variants in a gene for a given disorder, accurate diagnosis requires determining that these two variants occur on different copies of the chromosome (i.e., are in trans) rather than on the same copy (i.e. in cis). However, current approaches for determining phase, beyond parental testing, are limited in clinical settings. We developed a strategy for inferring phase for rare variant pairs within genes, leveraging genotypes observed in exome sequencing data from the Genome Aggregation Database (gnomAD v2, n=125,748). When applied to trio data where phase can be determined by transmission, our approach estimates phase with 95.7% accuracy and remains accurate even for very rare variants (allele frequency < 1×10⁻⁴). We also correctly phase 95.9% of variant pairs in a set of 293 patients with Mendelian conditions carrying presumed causal compound heterozygous variants. We provide a public resource of phasing estimates from gnomAD, including phasing estimates for coding variants across the genome and counts per gene of rare variants in trans, that can aid interpretation of rare co-occurring variants in the context of recessive disease.


Conflict of interest statement

Competing interests B.M.N. is a member of the scientific advisory board at Deep Genomics and Neumora, Inc. (f/k/a RBNC Therapeutics). H.L.R. has received support from Illumina and Microsoft to support rare disease gene discovery and diagnosis. M.J.D. is a founder of Maze Therapeutics and Neumora Therapeutics, Inc. (f/k/a RBNC Therapeutics). A.O.D.L. has consulted for Tome Biosciences and Ono Pharma USA Inc, and is member of the scientific advisory board for Congenica Inc and the Simons Foundation SPARK for Autism study. K.J.K. is a consultant for Tome Biosciences and Vor Biosciences, and a member of the Scientific Advisory Board of Nurture Genomics. D.G.M. is a paid advisor to GlaxoSmithKline, Insitro, Variant Bio and Overtone Therapeutics, and has received research support from AbbVie, Astellas, Biogen, BioMarin, Eisai, Google, Merck, Microsoft, Pfizer, and Sanofi-Genzyme. K.E.S. has received support from Microsoft for work related to rare disease diagnostics. The remaining authors declare no competing interests.

Figures

Fig. 1:
Fig. 1:. Overview of phasing approach using Expectation-Maximization method in gnomAD.
a, Schematic of phasing approach. b, Histogram of Ptrans scores for variant pairs in cis (top, blue) and in trans (bottom, red). c, Proportion of variant pairs in each Ptrans bin that are in trans. Each point represents variant pairs with Ptrans bin size of 0.01. Blue dashed line at 10% indicates the Ptrans threshold at which ≥ 90% of variant pairs in bin are on the same haplotype Ptrans0.02. Red dashed line at 90% indicates the Ptrans threshold at which ≥ 90% of variant pairs in bin are on opposite haplotypes Ptrans0.55. Calculations are performed using variant pairs with population AF ≥ 1×10⁻⁴. d, Performance of Ptrans for distinguishing variant pairs in cis and trans. Accuracy is calculated as the proportion of variant pairs correctly phased (green bars) divided by the proportion of variant pairs phased using Ptrans (orange plus green bars). b-d, Ptrans scores are population-specific.
Fig. 2:
Fig. 2:. Phasing accuracy as a function of variant allele frequency (AF).
Phasing accuracy at different AF bins for all variant pairs (a), variant pairs in trans (b), and variant pairs in cis (c). Shading of squares and numbers in each square represent the phasing accuracy. Y-axis labels refer to the more frequent variant in each variant pair and X-axis labels refer to the rarer variant in each variant pair. Accuracy is the proportion of correct classifications (i.e., correct classifications / all classifications) and is calculated for all unique variant pairs seen in the trio data across all populations using population-specific Ptrans calculations.
Fig. 3:
Fig. 3:. Phasing accuracy using population-specific versus cosmopolitan Ptrans estimates.
Population-specific Ptrans estimates are shown in light blue and cosmopolitan Ptrans estimates are shown in medium blue. Accuracies are shown separately for variants in trans (a, left) and variants in cis (b, right)
Fig. 4:
Fig. 4:. Phasing accuracy as a function of distance between variant pairs.
a, Phasing accuracy (y-axis) as a function of physical distance (in base pairs on log10 scale) between variants (x-axis). Blue represents variants on the same haplotype (in cis), and red represents variants on opposite haplotypes (in trans). b, Same as a, except the x-axis shows genetic distance (in centiMorgans). Accuracies for a and b are based on unique variant pairs observed across all genetic ancestry groups and are calculated using population-specific Ptrans estimates.
Fig. 5:
Fig. 5:. Counts of genes with variants in trans in gnomAD.
a, Proportion of genes with one or more individuals in gnomAD carrying predicted compound heterozygous (in trans) variants or a homozygous variant at ≤ 1% and ≤ 5% AF stratified by predicted functional consequence. b, Number of genes with ≥ 1 individual in gnomAD carrying compound heterozygous (in trans) or homozygous predicted damaging variants at ≤ 1% AF, stratified by predicted functional consequence and Mendelian disease-association in the Online Mendelian Inheritance in Man database (OMIM). In total, 28 genes (25 non-disease, 2 AD, and 1 AR) carried predicted compound heterozygous loss-of-function variants at ≤ 1% AF, only seven of which were high confidence “human knock-out” events following manual curation. For predicted compound heterozygous variants, both variants in the variant pair must be annotated with a consequence at least as severe as the consequence listed (i.e., a compound heterozygous loss-of-function variant would be counted under the pLoF category but also included with a less deleterious variant under the other categories). All homozygous pLoF variants previously underwent manual curation as part of Karczewski et al. AF, allele frequency; comp het, compound heterozygous; hom, homozygous; AD, autosomal dominant; AR, autosomal recessive.
Fig. 6:
Fig. 6:. Publicly-available browser for sharing of phasing data.
a, Sample gnomAD browser output for two variants (1-55505647-G-T and 1-55523855-G-A) in the gene PCSK9. On the top, a table subdivided by genetic ancestry group displays how many individuals in gnomAD from that genetic ancestry are consistent with the two variants occurring on different haplotypes (trans), and how many individuals are consistent with their occurring on the same haplotype (cis). Below that, there is a 3×3 table that contains the 9 possible combinations of genotypes for the two variants of interest. The number of individuals in gnomAD that fall in each of these combinations are shown and are colored by whether they are consistent with variants falling on different haplotypes (red) or the same haplotype (blue), or whether they are indeterminate (purple). The estimated haplotype counts for the four possible haplotypes for the two variants as calculated by the EM algorithm is displayed on the bottom right. The probability of being in trans for this particular pair of variants is > 99%. b, Variant co-occurrence tables on the gene landing page. For each gene (GBA1 shown), the top table lists the number of individuals carrying pairs of rare heterozygous variants by inferred phase, AF, and predicted functional consequence. The number of individuals with homozygous variants are tabulated in the same manner and presented as a comparison below. AF thresholds of ≤ 5%, ≤ 1%, and ≤ 0.5% are displayed across six predicted functional consequences (combinations of pLoF, various evidence strengths of predicted pathogenicity for missense variants, and synonymous variants). Both variants in the variant pair must be annotated with a consequence at least as severe as the consequence listed (i.e., pLoF + strong missense also includes pLoF + pLoF).

References

    1. McVean G. A. T. et al. The fine-scale structure of recombination rate variation in the human genome. Science 304, 581–584 (2004). - PubMed
    1. Rahbari R. et al. Timing, rates and spectra of human germline mutation. Nat. Genet. 48, 126–133 (2016). - PMC - PubMed
    1. Lek M. et al. Analysis of protein-coding genetic variation in 60,706 humans. Nature 536, 285–291 (2016). - PMC - PubMed
    1. Ségurel L., Wyman M. J. & Przeworski M. Determinants of mutation rate variation in the human germline. Annu. Rev. Genomics Hum. Genet. 15, 47–70 (2014). - PubMed
    1. Hodgkinson A. & Eyre-Walker A. Variation in the mutation rate across mammalian genomes. Nature Reviews Genetics vol. 12 756–766 Preprint at 10.1038/nrg3098 (2011). - DOI - PubMed

Publication types