[Preprint]. 2023 Oct 9:2023.03.22.533773.
doi: 10.1101/2023.03.22.533773.

Atlas of Plasmodium falciparum intraerythrocytic development using expansion microscopy

Affiliations

Atlas of Plasmodium falciparum intraerythrocytic development using expansion microscopy

Benjamin Liffner et al. bioRxiv. .

Update in

Abstract

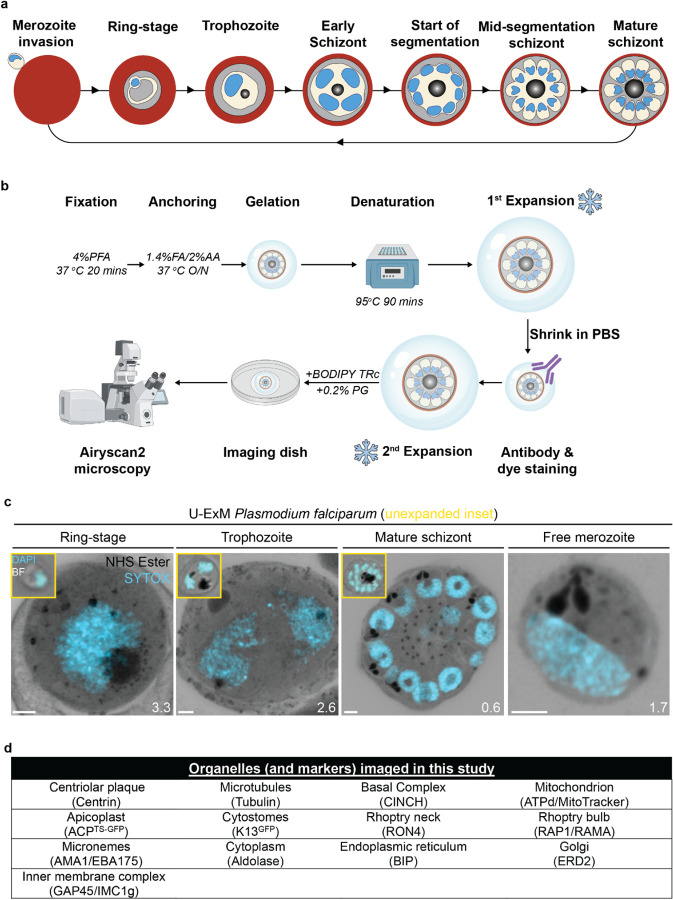
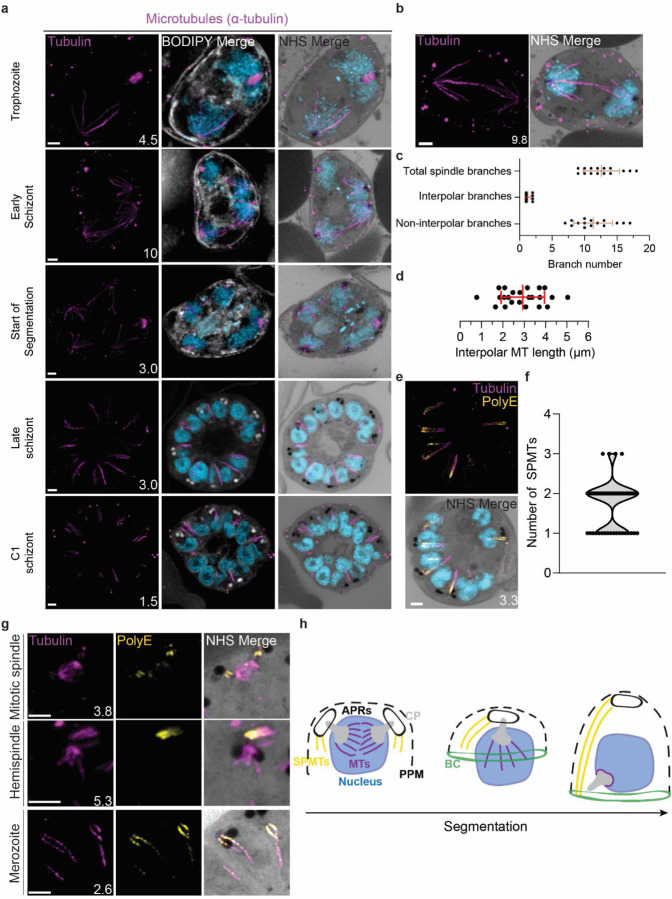
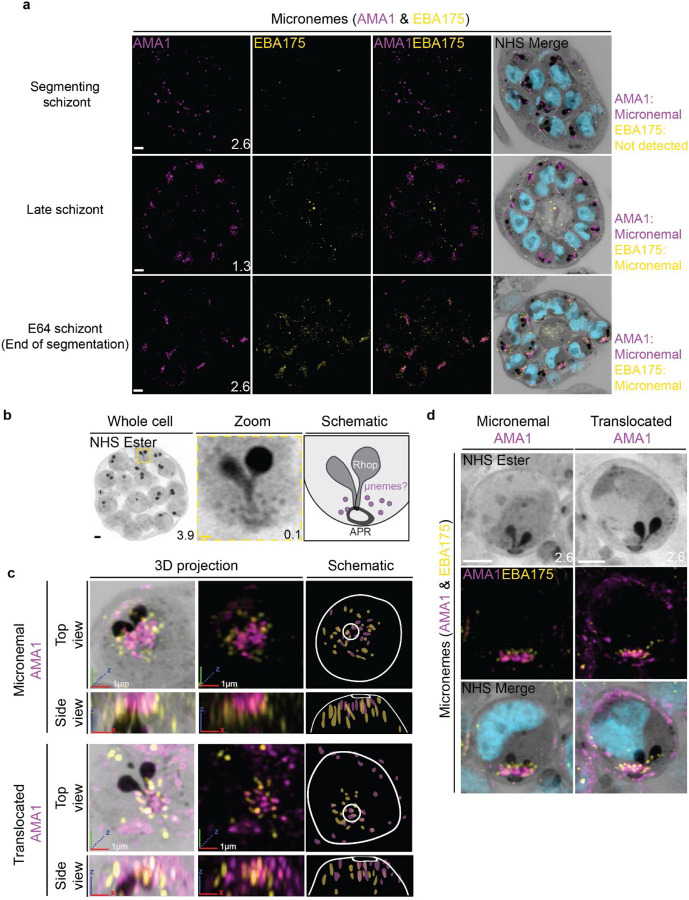
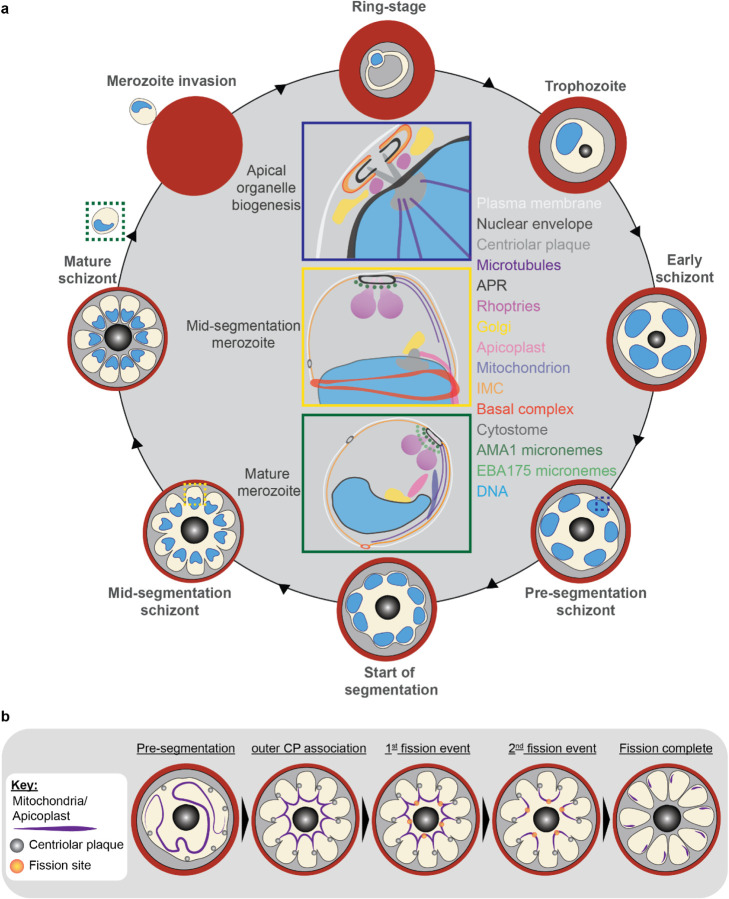
Apicomplexan parasites exhibit tremendous diversity in much of their fundamental cell biology, but study of these organisms using light microscopy is often hindered by their small size. Ultrastructural expansion microscopy (U-ExM) is a microscopy preparation method that physically expands the sample ~4.5x. Here, we apply U-ExM to the human malaria parasite Plasmodium falciparum during the asexual blood stage of its lifecycle to understand how this parasite is organized in three-dimensions. Using a combination of dye-conjugated reagents and immunostaining, we have catalogued 13 different P. falciparum structures or organelles across the intraerythrocytic development of this parasite and made multiple observations about fundamental parasite cell biology. We describe that the outer centriolar plaque and its associated proteins anchor the nucleus to the parasite plasma membrane during mitosis. Furthermore, the rhoptries, Golgi, basal complex, and inner membrane complex, which form around this anchoring site while nuclei are still dividing, are concurrently segregated and maintain an association to the outer centriolar plaque until the start of segmentation. We also show that the mitochondrion and apicoplast undergo sequential fission events while maintaining an association with the outer centriolar plaque during cytokinesis. Collectively, this study represents the most detailed ultrastructural analysis of P. falciparum during its intraerythrocytic development to date, and sheds light on multiple poorly understood aspects of its organelle biogenesis and fundamental cell biology.


Conflict of interest statement

COMPETING INTERESTS The authors declare no competing interests.

Figures

Figure 1:
Figure 1:. U-ExM workflow and summary of parasite structures imaged in this study.
(a) Diagram of asexual blood stage lifecycle of P. falciparum. (b) Ultrastructure expansion microscopy (U-ExM) workflow used in this study. PFA = paraformaldehyde, FA = formaldehyde, AA = acrylamide PG = propyl gallate. Snowflake indicates steps where gels were cryopreserved. (c) Comparison of brightfield and DAPI staining of unexpanded P. falciparum parasites (inset) with P. falciparum prepared by U-ExM, stained with NHS Ester (protein density; greyscale) and SYTOX Deep Red (DNA; cyan) and imaged using Airyscan microscopy. Images are maximum-intensity projections, number on image = Z-axis thickness of projection in μm. Scale bars = 2 μm. (d) Summary of all organelles, and their corresponding antibodies, imaged by U-ExM in this study.
Figure 2:
Figure 2:. Centriolar plaque (CP) biogenesis and dynamics.
3D7 parasites were prepared by U-ExM, stained with NHS ester (greyscale), BODIPY TRc (white), SYTOX (cyan) and anti-centrin (outer centriolar plaque (CP); magenta) antibodies and imaged using Airyscan microscopy.. (a) Images of whole parasites throughout asexual blood-stage development. (b) Whole parasite panel (left) followed by individual centriolar plaque or centriolar plaque pair zooms following our proposed timeline of events in centriolar plaque biogenesis, dynamics, and disassembly. Yellow line = cytoplasmic extensions, blue line = nuclear envelope, green line = parasite plasma membrane. Images are maximum-intensity projections, number on image = Z-axis thickness of projection in μm. White scale bars = 2 μm, yellow scale bars = 500 nm.
Figure 3:
Figure 3:. Characterisation of intranuclear and subpellicular microtubules.
3D7 parasites were prepared by U-ExM, stained with NHS ester (greyscale), BODIPY TRc (white), SYTOX (cyan) and anti-tubulin (microtubules; magenta) antibodies, and imaged using Airyscan microscopy. (a) Images of whole parasites throughout asexual blood-stage development. (b) Nuclei in the process of dividing, with their centriolar plaques connected by an interpolar spindle. (c) The number and type of microtubule branches in interpolar spindles and (d) length of interpolar microtubules. (e) Subpellicular microtubules (SPMTs) stained with an anti-poly-glutamylation (PolyE; yellow) antibody. (f) Quantification of the number of SPMTs per merozoite from C1-treated schizonts. (g) SPMT biogenesis throughout segmentation. (h) Model for SPMT biogenesis. PPM = parasite plasma membrane, APRs = apical polar rings, BC = basal complex, CP = centriolar plaque. Images are maximum-intensity projections, number on image = Z-axis thickness of projection in μm. Scale bars = 2 μm.
Figure 4:
Figure 4:. Basal complex biogenesis and development throughout segmentation.
Parasites expressing an smV5-tagged copy of the basal complex marker CINCH were prepared by U-ExM, stained with NHS ester (greyscale), BODIPY TRc (white), SYTOX (cyan) and anti-V5 (basal complex; magenta) antibodies and imaged using Airyscan microscopy across segmentation. (a) Images of whole parasites throughout asexual blood-stage development. (b) Basal complex development during schizogony. The basal complex is formed around the PPM anchor of the outer CP. In nuclei whose outer CP has two branches, and will therefore undergo mitosis, the basal complex rings are duplicated. From early segmentation, the basal complex acquires a stable, expanding ring form. Cytostomes that will form part of merozoites are marked with a white asterisk, while those outside merozoites are marked with a yellow asterisk. Images are maximum-intensity projections, number on image = Z-axis thickness of projection in μm. Scale bars = 2 μm.
Figure 5:
Figure 5:. Growth and fission of the mitochondrion.
Parasites with an smHA-tagged copy of the ATP Synthase F0 Subunit D (ATPd, Pf3D7_0311800) as a mitochondrial marker were prepared by U-ExM, stained with NHS ester (greyscale), BODIPY TRc (white), SYTOX (cyan) and anti-HA (mitochondrion; magenta) antibodies and imaged using Airyscan microscopy. (a) Images of whole parasites throughout asexual blood-stage development. Maximum intensity projections of both a subsection of the cell (partial mito) and the full cell (full mito) are shown. (b) ATPd staining was compared against Mitotracker orange CMTMRos (yellow), which showed discontinuous staining in looped regions. (c) Area of the mitochondrion was quantified for parasites of varying nucleus number. 73 cells were counted across 4 biological replicates. **** = p<0.001, ns = p>0.05 by one-way ANOVA, error bars = SD. (d) Schizont with mitochondria that have undergone fission (yellow zoom), mitochondria that are shared between two nascent merozoites (black zoom), and mitochondria left outside merozoites in the forming residual body (grey). (e) During fission, mitochondria associate with the outer centriolar plaque (oCP). Images are maximum-intensity projections, number on image = Z-axis thickness of projection in μm. White scale bars = 2 μm, yellow scale bars = 500 nm.
Figure 6:
Figure 6:. Growth and fission of the apicoplast.
Parasites expressing GFP-conjugated to the apicoplast transit signal of ACP (ACPTs-GFP) were prepared by U-ExM, stained with NHS ester (greyscale), BODIPY TRc (white), SYTOX (cyan) and anti-GFP (apicoplast) (magenta) antibodies and using Airyscan microscopy.(a) Images of whole parasites throughout asexual blood-stage development. Maximum intensity projections of both a subsection of the cell (partial mito) and the full cell (full mito) are shown. (b) Area of the apicoplast was quantified for parasites of varying nucleus number. 70 cells were counted across 3 biological replicates. **** = p<0.001, * = p<0.05 by one-way ANOVA, error bars = SD. (c) Representative images of the different stages of apicoplast fission. Images are maximum-intensity projections, number on image = Z-axis thickness of projection in μm. Asterisks represent centriolar plaques. Scale bars = 2 μm.
Figure 7:
Figure 7:. Cytostomes are observable by U-ExM throughout the asexual blood stage of the lifecycle.
(a) Parasites expressing an smV5-tagged copy of the basal complex marker CINCH, prepared by U-ExM, and stained with anti-V5, show NHS ester dense rings that are negative for this basal complex marker. (b) Parasites prepared by U-ExM where the cytostome marker Kelch13 was conjugated to GFP (K13-GFP) and stained with anti-GFP. Image shows colocalization between K13-GFP and the putative cytostome. NHS ester-dense ring. (c) Comparison between PFA-only and PFA-glutaraldehyde fixed U-ExM parasites, showing lysed (PFA only, orange) and intact (PFA-glutaraldehyde, magenta) RBC membranes. (d) In PFA only fixed parasites, only the cytostomal collar is preserved, while both the collar and bulb are preserved upon PFA-glutaraldehyde fixation. (e) K13-GFP parasites were either fixed in PFA only or PFA-glutaraldehyde, prepared by U-ExM, stained with NHS ester (greyscale), SYTOX (cyan) and anti-GFP (Cytostome) (magenta) antibodies and imaged using Airyscan microscopy across the asexual blood stage. Zoomed regions show cytostomes\ Images are maximum-intensity projections, number on image = Z-axis thickness of projection in μm. White scale bars = 2 μm. Yellow scale bars = 500 nm.
Figure 8:
Figure 8:. Rhoptries undergo biogenesis near the centriolar plaque and are segregated during nuclear division.
3D7 parasites were prepared by U-ExM, stained with NHS ester (greyscale), BODIPY TRc (white), SYTOX (cyan) and an anti-rhoptry antibodies and imaged using Airyscan microscopy. (a) Images of whole parasites throughout schizogony stained using an anti-RAP1 (rhoptry bulb; magenta)- antibody. (b) Zoom into rhoptry pairs of 3D7 parasites that were prepared for U-ExM and stained with NHS Ester (greyscale) along with antibodies against RAMA (rhoptry bulb; magenta) and RON4 (rhoptry neck; yellow) to assess rhoptry neck biogenesis. We observed that the rhoptry neck begins as a single focus inside each rhoptry. Rhoptries then get duplicated and segregated alongside the centriolar plaque. During the final mitosis, the rhoptry neck begins to elongate and the rhoptries separate from centriolar plaque. Images are maximum-intensity projections, number on image = Z-axis thickness of projection in μm. Scale bars = 2 μm.
Figure 9:
Figure 9:. Micronemal proteins AMA1 and EBA175 reside in separate micronemes.
3D7 parasites were prepared by U-ExM, stained with NHS ester (greyscale), SYTOX (cyan) and antibodies against the micronemal markers AMA1 (magenta) and EBA-175 (yellow), and imaged using Airyscan microscopy in segmenting schizonts. (a) Images of whole parasites throughout schizogony. In schizonts still undergoing segmentation, AMA1 localized to the apical end while EBA175 was not detected. In late schizonts, both EBA175 and AMA1 were present in the micronemes. In E64-arrested schizonts, AMA1 was translocated to the merozoite surface while EBA175 remained micronemal. 3D rendering (b) and zooms (c) of merozoites with either micronemal or translocated AMA1. Foci of AMA1 and EBA175 to not routinely colocalize with each other. Images are maximum-intensity projections, number on image = Z-axis thickness of projection in μm. White scale bars = 2 μm, RGB scale bars for 3D rendering = 1 μm.
Figure 10:
Figure 10:. Summary of organelle organization and fission during schizogony.
(a) Apical organelle biogenesis: Biogenesis of the rhoptries, Golgi, basal complex, and apical polar rings occur at outer centriolar plaque (CP), between the nuclear envelope and parasite plasma membrane. Duplication and segregation of these organelles appears to be tied to centriolar plaque duplication and segregation following nuclear divison. Mid-segmentation merozoite: The rhoptry neck is distinguishable from the bulb, and AMA1-positive micronemes are present at the apical end of the forming merozoite. Each merozoite has inherited a cytostome. Subpellicular microtubules stretch the entire distance from the apical polar rings and the basal complex. The apicoplast has attached to the outer CP and begun fission. Mature merozoite: The parasite has completed segmentation, and each merozoite contains a full suite of organelles. The centriolar plaque is no longer visible, and EBA175-positive micronemes are both visible and separate from AMA1-positive micronemes. (b) Model for fission of the mitochondrion and apicoplast. Prior to fission, both the apicoplast and mitochondrion branch throughout the parasite cytoplasm, before associating with the outer CP of each forming merozoite. For the apicoplast, this occurs during the final mitosis, but not until late in segmentation for the mitochondrion. Following outer CP association, the apicoplast and mitochondrion undergo a first fission event, which leaves an apicoplast and mitochondrion shared between forming merozoite pairs. Subsequently both organelles undergo a second fission event, leaving each forming merozoite with a single apicoplast and mitochondrion.

Similar articles

Cited by

References

    1. Absalon S., Blomqvist K., Rudlaff R. M., DeLano T. J., Pollastri M. P., & Dvorin J. D. (2018). Calcium-Dependent Protein Kinase 5 Is Required for Release of Egress-Specific Organelles in Plasmodium falciparum. mBio, 9(1). doi:10.1128/mBio.00130-18 - DOI - PMC - PubMed
    1. Aikawa M. (1967). Ultrastructure of the pellicular complex of Plasmodium fallax. Journal of Cell Biology, 35(1), 103–113. doi:10.1083/jcb.35.1.103 - DOI - PMC - PubMed
    1. Aikawa M. (1971). Plasmodium: the fine structure of malarial parasites. Exp Parasitol, 30(2), 284–320. doi:10.1016/0014-4894(71)90094-4 - DOI - PubMed
    1. Anderson-White B., Beck J. R., Chen C.-T., Meissner M., Bradley P. J., & Gubbels M.-J. (2012). Chapter One - Cytoskeleton Assembly in Toxoplasma gondii Cell Division. In Jeon K. W. (Ed.), International Review of Cell and Molecular Biology (Vol. 298, pp. 1–31): Academic Press. - PMC - PubMed
    1. Bannister L. H., Hopkins J. M., Fowler R. E., Krishna S., & Mitchell G. H. (2000). Ultrastructure of rhoptry development in Plasmodium falciparum erythrocytic schizonts. Parasitology, 121 (Pt 3), 273–287. doi:10.1017/s0031182099006320 - DOI - PubMed

Publication types