[Preprint]. 2023 Mar 21:rs.3.rs-2674892.
doi: 10.21203/rs.3.rs-2674892/v1.

Single cell and spatial alternative splicing analysis with long read sequencing

Affiliations

Single cell and spatial alternative splicing analysis with long read sequencing

Yuntian Fu et al. Res Sq. .

Update in

Abstract

Long-read sequencing has become a powerful tool for alternative splicing analysis. However, technical and computational challenges have limited our ability to explore alternative splicing at single cell and spatial resolution. The higher sequencing error of long reads, especially high indel rates, have limited the accuracy of cell barcode and unique molecular identifier (UMI) recovery. Read truncation and mapping errors, the latter exacerbated by the higher sequencing error rates, can cause the false detection of spurious new isoforms. Downstream, there is yet no rigorous statistical framework to quantify splicing variation within and between cells/spots. In light of these challenges, we developed Longcell, a statistical framework and computational pipeline for accurate isoform quantification for single cell and spatial spot barcoded long read sequencing data. Longcell performs computationally efficient cell/spot barcode extraction, UMI recovery, and UMI-based truncation- and mapping-error correction. Through a statistical model that accounts for varying read coverage across cells/spots, Longcell rigorously quantifies the level of inter-cell/spot versus intra-cell/ spot diversity in exon-usage and detects changes in splicing distributions between cell populations. Applying Longcell to single cell long-read data from multiple contexts, we found that intra-cell splicing heterogeneity, where multiple isoforms co-exist within the same cell, is ubiquitous for highly expressed genes. On matched single cell and Visium long read sequencing for a tissue of colorectal cancer metastasis to the liver, Longcell found concordant signals between the two data modalities. Finally, on a perturbation experiment for 9 splicing factors, Longcell identified regulatory targets that are validated by targeted sequencing.


Figures

Figure 1:
Figure 1:. Overview of single cell Nanopore RNA seq preprocessing.
A The structure of a read. 10mers aside the cell barcode (marked by red box) is extracted from sequences in real data. Then we compare those 10mers to their original sequences, and their edit distance distribution indicates the influence of sequencing errors to the UMI (bottom left). Bottom right shows the distribution of edit distance for the same region in our simulated sequences, which is very similar to that in real data. B Expected nearest edit distance between true UMI sequences of a gene at varying expression. 10 bp UMIs are randomly sampled at increasing counts to mimic the UMIs representing a single isoform in a single cell. As expected, as gene expression increases, the nearest neighbor edit distances between UMIs decrease. For example, since an insertion or a deletion can lead to an edit distance of 2, two different UMIs with edit distance lower than 4 can be connected by a “bridge” UMI sequence to which each differs by only an insertion or a deletion. The probability of such linkage increases with increasing gene expression. C UMI graph. Each node is a UMI after amplification with simulated sequencing errors to mimic the situation in Nanopore long reads. The color indicates if they are amplified from the same original UMI. UMIs with edit distance lower than 2 will be connected by an edge. Left: Simulation with 5 original UMIs and mean PCR amplification fold of 5. Different UMI clusters are separated. There also exist some singletons which is away from its original UMI cluster. Right: Simulation with 30 original UMIs and mean PCR amplification fold of 5. More singletons emerge in such high expression condition. Different UMI clusters are connected to each other by some bridge nodes into a connected sub graph (as marked by red circle). D UMI deduplication procedure: (1) simulated isoforms for a gene for illustration, including two types of isoforms (abbreviated as a and b) and a fake isoform due to wrong mapping (abbreviated as n). (2) UMIs are first clustered within each single cell. (3) Then isoform clusters are compared across all cells to correct for wrong mapping. Truncation errors are corrected by comparing to complete read within each cluster. (4) After the correction of truncation and mapping errors, small UMI clusters may be pruned based on the distribution of cluster sizes for clusters involving the same isoform. E We applied different clustering methods on this graph and show the clustering result on the marked sub graph in Fig 1.C right to see if they could separate the different UMI clusters. Left: Zoom in to the marked UMI sub graph, the color is the same as Fig 1.C right to indicate the original UMI. Middle: clustering result for dbscan method (eps=2) on the marked sub graph. All UMIs are clustered into one group. Right: clustering result for iterative louvain method on the marked sub graph. Most UMI clusters are recovered. F We sample 10mer adapters in different number (2~50) to mimic PCR replicates of a UMI, then apply dbscan cluster (eps = 2, merge UMIs with edit distance lower than 2) and Longcell to sampled 10mer adapters to do deduplication. The dbscan method leads to inflated UMI estimation when amplification fold gets higher, while Longcell has a stable estimation even under the high amplification condition.
Figure 2:
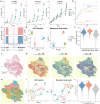
Figure 2:. UMI deduplication results on simulated and real datasets.
A The comparison of gene quantification by different methods on the simulated data across different amplification fold and gene expression. B The comparison of psi estimation by different methods on the simulated data across different PCR amplification fold, evaluated by mean square error. C Correction of wrongly mapped exons for RPL41–204 after UMI deduplication. D UMAP built on gene expression from 10X and paired ONT scRNA sequencing of the CRCLM sample. E Gene-wise correlation with Illumina-based estimates, per cell, for raw and processed ONT-based estimates. F The histological annotation for the CRCLM sample. Non-tumor regions are marked with red circles. G Cell type composition in each Visium spot (Left: tumor epithelial. Middle: stromal. Right: Myeloid). H The spatial view of the Visium spot clustering. I UMAP built on gene expression from long reads and paired short reads. J The per spot correlation between long reads Visium sequencing and paired short reads Visium sequencing for a CRCLM sample.
Figure 3:
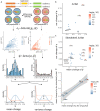
Figure 3:. Quantification of intra-cell versus inter-cell isoform heterogeneity in colorectal metastasis to the liver.
A The relationship between ψ and ϕ,ψ=intra-cell heterogeneity, ϕ=inter-cell heterogeneity. B ϕ vs. ψ distribution for alternative spliced exons in CRCLM single cell data, the color indicates the confidence interval of ϕ. Circles indicate two examples with low and high ϕ. C The ψ distribution for exon 4 of H3–3B, which has a relatively low ϕ, indicating low intercell heterogeneity. D The ψ distribution for exon 4 of H3–3B across cells, showing similar inclusion-level of this exon across all cells. E Distribution of the two dominantly expressed isoforms across different cell types, both isoforms are co-expressed in each cell at a similar ratio. F The ψ distribution for exon 6 of MYL6, which has a very high ϕ, indicating high intercell heterogeneity. G The ψ distribution for exon 6 of MYL6 across cells, epithelial shows the highest inclusion-level of this exon. H Distribution of the two dominantly expressed isoforms across different cell types, epithelial has higher expression of MYL6–218 compared to other cell types. I The correspondence of ψ between single cell long reads and Visium long reads sequencing. J The relationship between ψ and ϕ in CRCLM Visium sequencing. K The spatial view of ψ for exon 6 of MYL6, the aggregation regions of myeloid are marked by blue, which show low inclusion of this exon, while the aggregation region of stromal is marked by red circle. The rest is tumor epithelial. Both epithelial and stromal region show high inclusion of exon 6 of MYL6.
Figure 4:
Figure 4:. Quantification of intra-cell versus inter-cell isoform heterogeneity in embryo mouse brain.
A ϕ vs. ψ distribution for alternative spliced exons, color indicates the confidence interval of ϕ. The circle indicates the high ϕ example Pkm exon 9. B The ψ distribution for exon 9 of Pkm, which has a relatively high ϕ and show a bimodal distribution, indicating a high inter-cell heterogeneity. C Umap of cells in mouse embryo brain. Cells are colored by ψ for exon 9 of Pkm. Cells which have low expression (<10) of this gene and couldn’t give a confident ψ estimation are colored in grey. D Umap of cells in mouse embryo brain. Cells are colored by cell types. Three parts of cells are circled according to their ψ for exon 9 of Pkm. E The alternative splicing for Pkm in above three circled groups. The alternative splicing of exon 9 in Pkm mainly leads to 2 isoforms: Pkm-201 ad Pkm-202. An obvious transition of the expression of two isoforms can be identified both in both bulk (sashimi plot at left) and single cell level (heatmap at right).
Figure 5:
Figure 5:. Differential splicing analysis and the detection of alternative splicing regulated by splicing factors.
A The principle of generalized likelihood ratio test to identify differentially expressed isoforms. B, C All significant exons identified in Jurkat (B) and stimulated Jurkat cells (C) after knock-out of spicing factors. D Correspondence of significant exons between original and stimulated Jurkat cells. After stimulation there is a significant change of gene expression and alternative splicing in Jurkat cells, but the regulation of splicing factors keeps the same direction.
Figure 6:
Figure 6:. Isoform transition of DGUOK after knock-out of PCBP2.
A ψ distribution of exon 3 and 4 of DGUOK in nontarget and PCBP2 knock-out cells. An obvious decreasing of ψ can be observed after knock-out. Left for the full transcriptome and right for the target sequencing. B Comparison of expression for 3 main DGUOK isoforms in nontarget and PCBP2 knock-out cell populations. Both full transcriptome (left) and target sequencing (right) show the same pattern. C Sashimi plot for 3 main DGUOK isoforms in Nontarget and PCBP2 knock-out cell populations.

References

    1. Scotti M.M. & Swanson M.S. RNA mis-splicing in disease. Nat Rev Genet 17, 19–32 (2016). - PMC - PubMed
    1. Baralle F.E. & Giudice J. Alternative splicing as a regulator of development and tissue identity. Nat Rev Mol Cell Biol 18, 437–451 (2017). - PMC - PubMed
    1. Zhang Y., Qian J., Gu C. & Yang Y. Alternative splicing and cancer: a systematic review. Signal Transduct Target Ther 6, 78 (2021). - PMC - PubMed
    1. Stanley R.F. & Abdel-Wahab O. Dysregulation and therapeutic targeting of RNA splicing in cancer. Nat Cancer 3, 536–546 (2022). - PMC - PubMed
    1. Zhang X. et al. Cell-Type-Specific Alternative Splicing Governs Cell Fate in the Developing Cerebral Cortex. Cell 166, 1147–1162 e1115 (2016). - PMC - PubMed

Publication types

LinkOut - more resources