[Preprint]. 2023 Oct 11:2023.03.23.533976.
doi: 10.1101/2023.03.23.533976.

CDH1 loss promotes diffuse-type gastric cancer tumorigenesis via epigenetic reprogramming and immune evasion

Affiliations

CDH1 loss promotes diffuse-type gastric cancer tumorigenesis via epigenetic reprogramming and immune evasion

Gengyi Zou et al. bioRxiv. .

Update in

Abstract

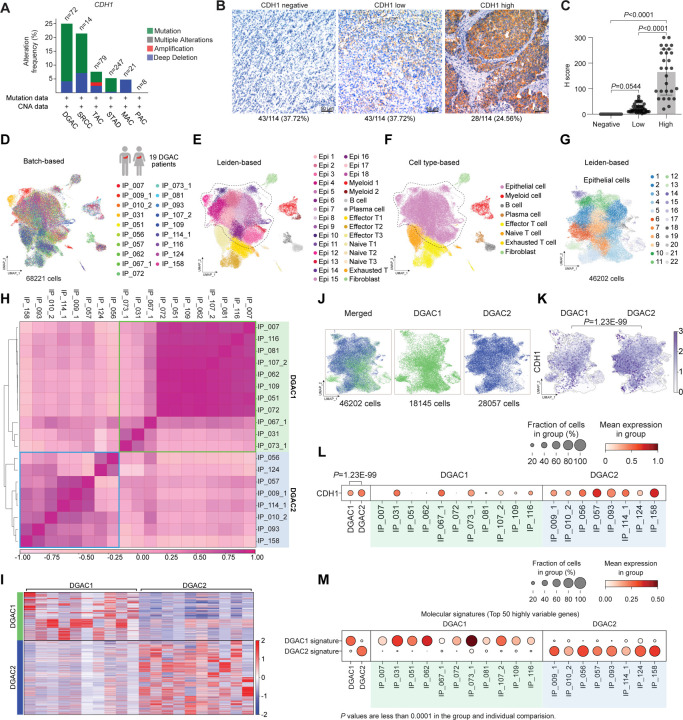
Diffuse-type gastric adenocarcinoma (DGAC) is a deadly cancer often diagnosed late and resistant to treatment. While hereditary DGAC is linked to CDH1 gene mutations, causing E-Cadherin loss, its role in sporadic DGAC is unclear. We discovered CDH1 inactivation in a subset of DGAC patient tumors. Analyzing single-cell transcriptomes in malignant ascites, we identified two DGAC subtypes: DGAC1 (CDH1 loss) and DGAC2 (lacking immune response). DGAC1 displayed distinct molecular signatures, activated DGAC-related pathways, and an abundance of exhausted T cells in ascites. Genetically engineered murine gastric organoids showed that Cdh1 knock-out (KO), KrasG12D, Trp53 KO (EKP) accelerates tumorigenesis with immune evasion compared to KrasG12D, Trp53 KO (KP). We also identified EZH2 as a key mediator promoting CDH1 loss-associated DGAC tumorigenesis. These findings highlight DGAC's molecular diversity and potential for personalized treatment in CDH1-inactivated patients.

Keywords: CDH1; E-Cadherin; EZH2; cancer subtyping; diffuse-type gastric adenocarcinoma; gastric cancer; gastric organoids; immune evasion; immune landscape remodeling; single-cell transcriptomics.


Figures

Figure 1.
Figure 1.. CDH1 inactivation in DGAC patient tumor cells
A. Genetic alteration of the CDH1 based on the cBioPortal stomach cancer datasets (http://www.cbioportal.org). n represents the total patients number enrolled in each subtype. DGAC, diffuse-type gastric adenocarcinoma; SRCC, signet ring cell carcinoma; TAC, tubular adenocarcinoma; STAD, stomach adenocarcinoma; MAC, mucinous adenocarcinoma; PAC, papillary adenocarcinoma. B, C. IHC staining of CDH1 in 114 DGAC patient tumor samples. The representative images are shown (B). Quantification of H score of CDH1 expression (C). P values were calculated using the one-way ANOVA; error bars: standard deviation (SD). Clinical information of 114 DGAC patients was showed in Table S4. D. Merged batch-based integrated UMAPs of 19 DGAC patients; integration package: Harmony. Clinical information of 19 DGAC patients was showed in Table S5. E. Merged Leiden-based integrated UMAP of 19 DGAC patients. Dashed line circle: epithelial cells. Epi: epithelial cells; Myeloid: myeloid cells; Effector T: effector T cells; Naïve T: naïve T cells; Exhausted T: exhausted T cells. F. Merged cell type-based UMAP of 19 DGAC patients. All cells were re-clustered according to the Leiden clusters and gathered as mega clusters. Dashed line circle: epithelial cells. G. Epithelial cells were re-clustered by Leiden. H. Correlation matrix plot of epithelial cells showing pair-wise correlations among all samples above. The dendrogram shows the distance of each dataset based on principal component analysis, and the Pearson correlation is displayed with a color spectrum. Groups of patients were categorized by dendrogram and correlation. I. Type-based heatmap of epithelial cells of merged datasets in 19 DGAC patients. Top 100 highly variable genes of each type were showed in Table S8. J. Type-based integrated and separated UMAPs of DGAC1 and DGAC2. K. Feature plots of epithelial cells displaying CDH1 expression. L. Dot plots of epithelial cells of CDH1 expression in different DGAC groups and individual patients. M. Molecular signatures of DGAC1 and DGAC2 patients. Top 50 highly variable genes were used to calculate the molecular signature of each group. Gene list was showed in Table S8. Dot plots of epithelial cells of each molecular signature in different subtypes and individual patient.
Figure 2.
Figure 2.. Comparative analyses of immune landscapes of DGAC subtypes
A-B. Cell type-based and Leiden-based UMAPs of DGAC1 and DGAC2. C. Absolute and relative cell proportions of individual patients and DGAC subtypes. Patients list was ranked by the DGAC group that they belong. D. Total cell-cell interactions from DGAC1 and DGAC2 were analyzed by using the CellChat package. More interactions were found in DGAC1. E, F. Differential number of interactions between DGAC1 and DGAC2 using circle plots (E) and heatmap (F). Red (or blue) colored edges (E) and squares (F) represent increased (or decreased) signaling in the DGAC1 compared to DGAC2. G-I. Score-based dot plot (G), feature plots (H), and dot plot of individual marker gene (I) of exhausted T cell score (markers are included in that score: LAG3, TIGIT, CTLA4, and HAVCR2). Genes that included in score analysis were showed in Table S9. P values were calculated by using a t-test. J-L. Score-based dot plot (J), feature plots (K), and dot plot of individual marker gene (L) of immune checkpoint score (markers are included in that score: CTLA4, PDCD1, PDCD1LG2, and CD274). Genes that included in score analysis were showed in Table S9. P values were calculated by using a t-test. M-O. Score-based dot plot (M), feature plots (N), and dot plot of individual marker gene (O) of exhausted T cell score (markers are included in that score: IFITM1, JUNB, CLEC4E, IL1B, PLA2G7, ARG2, CLEC4D, CTSD, and CD84). Genes that included in score analysis were showed in Table S9. P values were calculated by using a t-test.
Figure 3.
Figure 3.. Establishment of genetically engineered gastric organoids with CDH1- inactivation
A. Genetic alteration of the KRAS, and TP53 genes based on the cBioPortal. n represents the total patients number enrolled in each subtype. DGAC, diffuse- type gastric adenocarcinoma; SRCC, signet ring cell carcinoma; TAC, tubular adenocarcinoma; STAD, stomach adenocarcinoma; MAC, mucinous adenocarcinoma; PAC, papillary adenocarcinoma. B. Illustration of the workflow for stomach tissue collection and dissociation, gene manipulation of the gastric organoids (GOs), GOs culture, and representative image of GOs. Three GO lines were generated, including WT, KP, and EKP. WT mice and KP mice were sacrificed to collect stomach tissue. After removing forestomach, stomach tissue was dissociated into single cell and culture as organoids. Adeno-Cre virus was used to treat KrasLSL-G12D; Trp53fl/fl organoids to generate KP organoids, followed by nutlin-3 selection. After selection, EKP organoids were generated using CRISPR-mediated Cdh1 KO from KP GOs. C. Representative images of WT, KP, and EKP GOs at passage day 8. Scale bar: 200 μm. D. Growth analysis for WT, KP, and EKP GOs in two passages at day 8 of each passage. P values were calculated using the one-way ANOVA; error bars: SD. Numbers below each label represent the number of organoids. E. Hematoxylin and eosin (H & E) staining of WT, KP, and EKP GOs. F. MKI67 staining of WT, KP, and EKP GOs (n=5). G. CDH1 staining of WT, KP, and EKP GOs (n=5). H. Statistics analysis of MKI67 staining (Figure 3F). P values were calculated using the one-way ANOVA; error bars: SD. The representative images are shown. I. Batch-based UMAPs of WT, KP, and EKP GOs. The Harmony integration package was used to remove the batch effect. J. Leiden-based clustering UMAPs of WT, KP, and EKP GOs. Cell clusters were named by the most highly variable genes. K. Cell proportion analysis of WT, KP, and EKP GOs. Each color represents a different cell type. The color code is based on the cell types shown in Figure 3J. L. Batch-based and Scissor-based UMAP of WT and EKP GOs generated by Scissor package. TCGA datasets of normal stomach and DGAC patients were utilized. M. Cluster-based and Scissor-based UMAP of EKP GOs generated by Scissor package. DGAC1 and DGAC2 datasets were utilized to perform the comparison. N. Dot plots of EKP GOs of DGAC1 and DGAC2 molecular signatures. Top 50 highly variable genes were used to calculate the molecular signature of each DGAC subtype. Gene list was showed in Table S8.
Figure 4.
Figure 4.. CDH1 KO promotes KP-driven gastric tumorigenesis
A. Bright-field images of KP and EKP cells in low and high magnification. B. Crystal violet staining of KP and EKP GOs-derived cells. C. Bright-field images of KP and EKP allograft tumors; tumor incidence of allograft tumors. D, E. Plot for tumor mass (D) and tumor size (E) assessment of KP and EKP allografts. F. H & E staining of KP and EKP allograft tumors (n≥3). G, H. MKI67 (G) and E-Cadherin (H) staining of KP and EKP allograft tumors (n≥3). Left images: low magnification. Right images: high magnification. Scale bars were shown on the representative images. I. Statistics analysis of MKi67 staining in Figure 4G. P values were calculated using Student’s t-test; error bars: SD. J-O. CD3 (J), CD4 (K), CD8 (L), PDCD1 (M), TIM3 (N) staining and CD11B/LY6G co-staining (O) of KP and EKP allograft tumors (n≥3). Middle and Cortex represents the middle and cortex of the tumor, respectively. In each panel, left images showed low magnification, and right images showed high magnification. Scale bars were shown on the representative images. P-U. Statistics analysis of CD3 (P), CD4 (Q), CD8 (R), PDCD1 (S), TIM3 (T) staining and CD11B/LY6G co-staining (U). The positive cell percentage indicates the area of cells expressing a specific marker divided by the total field occupied cells stained by DAPI in the same area, which allows for normalization. Md: Middle; Ct: Cortex. P values were calculated using the one-way ANOVA; error bars: SD.
Figure 5.
Figure 5.. CDH1 KO-activated EZH2 promotes gastric tumorigenesis
A. Integrated batch-based and regulon pattern-based UMAP for WT, KP, and EKP GOs. Six transcriptional modules were identified. B. Separated regulon patterns based UMAP for WT, KP, and EKP GOs. C. Flow chart of regulons selection process. D. Regulons enriched in WT, KP, and EKP GOs, based on Z Score. 32 regulons were highly expressed in EKP samples compared to WT and KP. E. Regulons enriched in WT, KP, and EKP GOs, based on Regulon Specificity Score (RSS). The top 20 were selected by Z score. The whole regulon list based on RSS was showed in Table S18. F. Venn diagram for the regulons from figure 5D and 5E. 20 regulons were overlapped. G. Dot plot of the regulons (WT, KP and EKP GOs) increased in TCGA DGAC patients. H. Regulon activity-based UMAP of Ezh2 in WT, KP, and EKP GOs. The cells with lighter color represent regulated by Ezh2. I, J. Dot plots of EZH2 downstream target genes (I, genes which are downregulated by EZH2 activation through histone modification; J, genes which are downregulated by EZH2 activation reported in gastric cancer) scores in the epithelial cells of DGAC1 and DGAC2. Gene list of EZH2 targeted genes was listed in Table S9. K. The level of H3K27Ac and H3K27Me3 expression in KP and EKP allografts. Quantification was displayed. L. Crystal violet staining of KP and EKP cells after GSK343 (EZH2 inhibitor, 10 μM, 96 hrs). M. Bright field images (M) of KP and EKP GOs after treating with GSK343 (EZH2 inhibitor, 10 μM, 96 hrs). D2: day2; D6: day6. N. Statistical analysis of KP and EKP gastric organoid size and number in response to GSK343 treatment. The number of organoids (right Y-axis) and their size (left Y-axis) were assessed following treatment with GSK343. At Day 2 (D2), the number of organoids was determined for the image depicted in figure 5M, and this count was considered as 100% (n numbers are presented in the bubble plot). At Day 6 (D6), the number of organoids in the same field for each group was counted (n numbers also displayed in the bubble plot). The percentage of each group on D6 was calculated by dividing the number of viable organoids at D6 by the number at D2. The viable percentage is presented in the bar graph. O-Q. Transplantation of EKP cells followed by EZH2 inhibition. Bright-field images of EKP allograft tumors treated with DMSO and GSK343 (20 mg/kg) separately (O). Tumor growth curve of EKP allografts treated with DMSO and GSK343 (20 mg/kg) after cell subcutaneous transplantation (P). Tumor mass of EKP allografts treated with DMSO and GSK343 (20 mg/kg) after mice scarification (Q). P values were calculated using Student’s t-test; error bars: SD.

References

    1. Aibar S., Gonzalez-Blas C. B., Moerman T., Huynh-Thu V. A., Imrichova H., Hulselmans G., Rambow F., Marine J. C., Geurts P., Aerts J., van den Oord J., Atak Z. K., Wouters J. and Aerts S.. 2017. SCENIC: single-cell regulatory network inference and clustering. Nat Methods 14: 1083–1086. - PMC - PubMed
    1. Ajani J. A., D’Amico T. A., Bentrem D. J., Chao J., Cooke D., Corvera C., Das P., Enzinger P. C., Enzler T., Fanta P., Farjah F., Gerdes H., Gibson M. K., Hochwald S., Hofstetter W. L., Ilson D. H., Keswani R. N., Kim S., Kleinberg L. R., Klempner S. J., Lacy J., Ly Q. P., Matkowskyj K. A., McNamara M., Mulcahy M. F., Outlaw D., Park H., Perry K. A., Pimiento J., Poultsides G. A., Reznik S., Roses R. E., Strong V. E., Su S., Wang H. L., Wiesner G., Willett C. G., Yakoub D., Yoon H., McMillian N. and Pluchino L. A.. 2022. Gastric Cancer, Version 2.2022, NCCN Clinical Practice Guidelines in Oncology. J Natl Compr Canc Netw 20: 167–192. - PubMed
    1. Al-Ahmadie H. A., Iyer G., Lee B. H., Scott S. N., Mehra R., Bagrodia A., Jordan E. J., Gao S. P., Ramirez R., Cha E. K., Desai N. B., Zabor E. C., Ostrovnaya I., Gopalan A., Chen Y. B., Fine S. W., Tickoo S. K., Gandhi A., Hreiki J., Viale A., Arcila M. E., Dalbagni G., Rosenberg J. E., Bochner B. H., Bajorin D. F., Berger M. F., Reuter V. E., Taylor B. S. and Solit D. B.. 2016. Frequent somatic CDH1 loss-of-function mutations in plasmacytoid variant bladder cancer. Nat Genet 48: 356–358. - PMC - PubMed
    1. Ashburner M., Ball C. A., Blake J. A., Botstein D., Butler H., Cherry J. M., Davis A. P., Dolinski K., Dwight S. S., Eppig J. T., Harris M. A., Hill D. P., Issel-Tarver L., Kasarskis A., Lewis S., Matese J. C., Richardson J. E., Ringwald M., Rubin G. M. and Sherlock G.. 2000. Gene ontology: tool for the unification of biology. The Gene Ontology Consortium. Nat Genet 25: 25–29. - PMC - PubMed
    1. Assumpcao P. P., Barra W. F., Ishak G., Coelho L. G. V., Coimbra F. J. F., Freitas H. C., Dias-Neto E., Camargo M. C. and Szklo M.. 2020. The diffuse-type gastric cancer epidemiology enigma. BMC Gastroenterol 20: 223. - PMC - PubMed

Publication types