[Preprint]. 2023 Sep 28:2023.03.16.532969.
doi: 10.1101/2023.03.16.532969.

Benchmarking of deep neural networks for predicting personal gene expression from DNA sequence highlights shortcomings

Affiliations

Benchmarking of deep neural networks for predicting personal gene expression from DNA sequence highlights shortcomings

Alexander Sasse et al. bioRxiv. .

Update in

Abstract

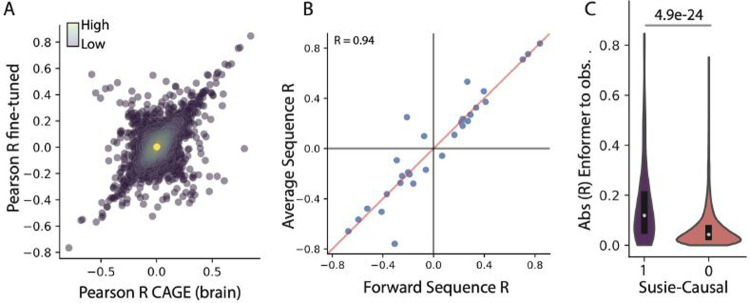
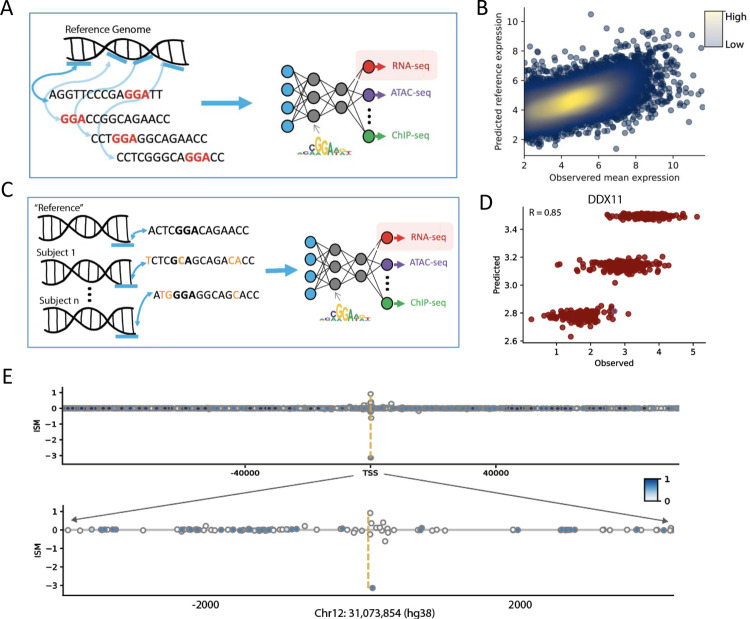
Deep learning methods have recently become the state-of-the-art in a variety of regulatory genomic tasks1-6 including the prediction of gene expression from genomic DNA. As such, these methods promise to serve as important tools in interpreting the full spectrum of genetic variation observed in personal genomes. Previous evaluation strategies have assessed their predictions of gene expression across genomic regions, however, systematic benchmarking is lacking to assess their predictions across individuals, which would directly evaluates their utility as personal DNA interpreters. We used paired Whole Genome Sequencing and gene expression from 839 individuals in the ROSMAP study7 to evaluate the ability of current methods to predict gene expression variation across individuals at varied loci. Our approach identifies a limitation of current methods to correctly predict the direction of variant effects. We show that this limitation stems from insufficiently learnt sequence motif grammar, and suggest new model training strategies to improve performance.


Conflict of interest statement

Competing Interests Statement The authors declare no competing interests.

Figures

Extended Figure 1
Extended Figure 1
Sensitivity analysis for Enformer predictions. (A) Density plot, where each dot represents a gene (n=13,397). X-axis shows Pearson R coefficients for Enformer predictions for the single most relevant track
Extended Figure 2
Extended Figure 2. Performance of the simple CNN model.
(A) Density plot of observed population-average expression of test set genes (n=3,401 genes) in cerebral cortex versus simple CNN’s predicted gene expression from the Reference sequences. This plot only displays genes which could be assigned to Enformer’s test set. Colors depict local density. (B) Y-axis shows Pearson R coefficients between observed expression values and a simple CNN’s predicted values per individual. X-axis shows the negative log10 p-value computed with a gene-specific Null model (one-sided T-test, n=50 independent samples per gene; Supplementary Method). The color represents the predicted mean expression. Red dashed line indicates FDRBH=0.05.
Figure 1.
Figure 1.. Evaluation of Enformer across genomic regions and select loci.
(A) Schematic of the Reference-based training approach. Different genomic regions from the Reference genome are treated as data points. Genomic DNA underlying a given region is the input to the model, and the model learns to predict various functional properties including gene expression (CAGE-seq), chromatin accessibility (ATAC-Seq), or TF binding (ChIP-Seq). (B) Population-average gene expression levels in cerebral cortex (averaged in ROSMAP samples, n=839) for expressed genes (n=13,397) versus Enformer’s predictions. (C) Schematic of the per-locus evaluation strategy. (D) Predicted and observed DDX11 gene expression levels in cortex for individuals in the ROSMAP cohort (n=839). Each dot represents an individual. Output of Enformer is fine-tuned using an elastic net model (Methods). (E) In-silico mutagenesis (ISM) values for all SNVs which occur at least once in 839 genomes within 98Kb of DDX11 TSS. SNVs are colored by minor allele frequency (MAF).
Figure 2.
Figure 2.. Evaluation of Enformer on prediction of gene expression across individuals.
(A) Y-axis shows the Pearson R coefficient between observed expression values and Enformer’s predicted values per-gene (genes=6,825, individuals=839). X-axis shows the negative log10 p-value, computed using a gene-specific null model (Method, one-sided T-test, permutation analysis with n=50 independent samples per gene). The color represents the predicted mean expression using the most relevant Enformer output track (“CAGE, adult, brain”). Red dashed line indicates FDRBH=0.05. (B) Y-axis shows the prediction from Enformer’s “CAGE, adult, brain” track across individuals for the GSTM3 gene (n=839), x-axis shows the observed gene expression values. (C) Pearson R coefficients between PrediXcan predicted versus observed expression across individuals is shown on the x-axis, Enformer’s Pearson R coefficients are shown on the y-axis. Red lines indicate threshold for significance (abs(R)>0.2, Bonferroni corrected nominal p-value), darker colored dots are significant genes from panel A. Green cross represents the location of the mean across all x- and y-values. (D) ISM value versus eQTL effect size for all SNVs (n=706 with MAF>0.1) within the 196Kb input sequence of the GSTM3 gene. Red circles represent driver SNVs. SNVs are defined as supported or unsupported based on the concordance with the sign of the eQTL effect size. (E) Fraction of supported driver SNVs per gene (y-axis) versus Pearson’s R coefficients between Enformer’s predictions and observed expressions (x-axis) (n=87 supported genes, n=161 unsupported genes). (F) Number of driver SNVs within the 1000bp window of the TSS. Main drivers are the drivers with the strongest impact on linear approximation, shown in different colors. Left plot, n=983 driver SNVs; Right plot, n=564 driver SNVs.

References

    1. Avsec Ž. et al. Effective gene expression prediction from sequence by integrating long-range interactions. Nat. Methods 18, 1196–1203 (2021). - PMC - PubMed
    1. Avsec Ž. et al. Base-resolution models of transcription-factor binding reveal soft motif syntax. Nat. Genet. 53, 354–366 (2021). - PMC - PubMed
    1. Eraslan G., Avsec Ž., Gagneur J. & Theis F. J. Deep learning: new computational modelling techniques for genomics. Nat. Rev. Genet. 20, 389–403 (2019). - PubMed
    1. Zhou J. et al. Whole-genome deep-learning analysis identifies contribution of noncoding mutations to autism risk. Nat. Genet. 51, 973–980 (2019). - PMC - PubMed
    1. Zhou J. Sequence-based modeling of three-dimensional genome architecture from kilobase to chromosome scale. Nat. Genet. 54, 725–734 (2022). - PMC - PubMed

Publication types