[Preprint]. 2023 Mar 24:rs.3.rs-2698203.
doi: 10.21203/rs.3.rs-2698203/v1.

Central circuit controlling thermoregulatory inversion and torpor-like state

Affiliations

Central circuit controlling thermoregulatory inversion and torpor-like state

Domenico Tupone et al. Res Sq. .

Abstract

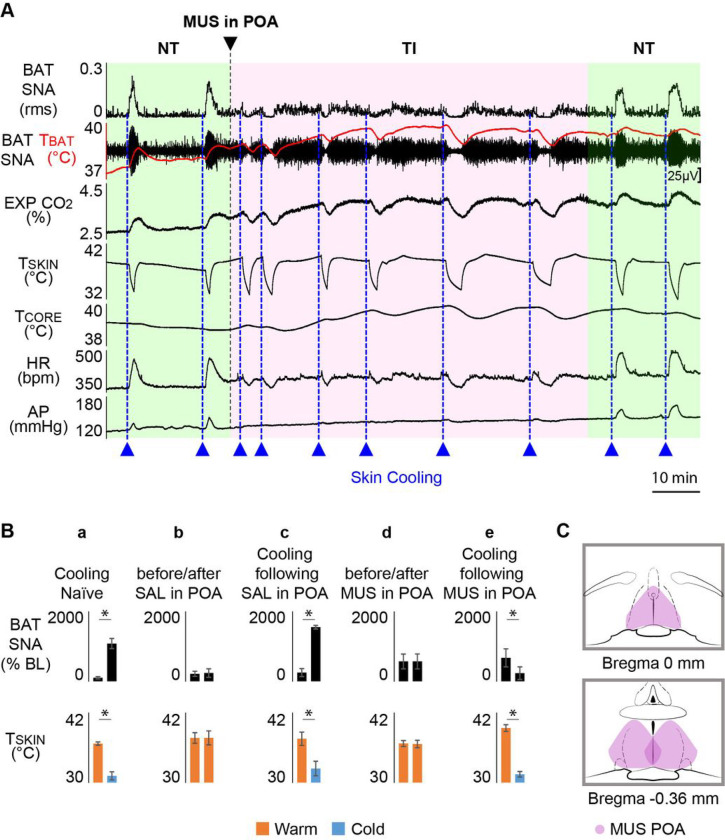
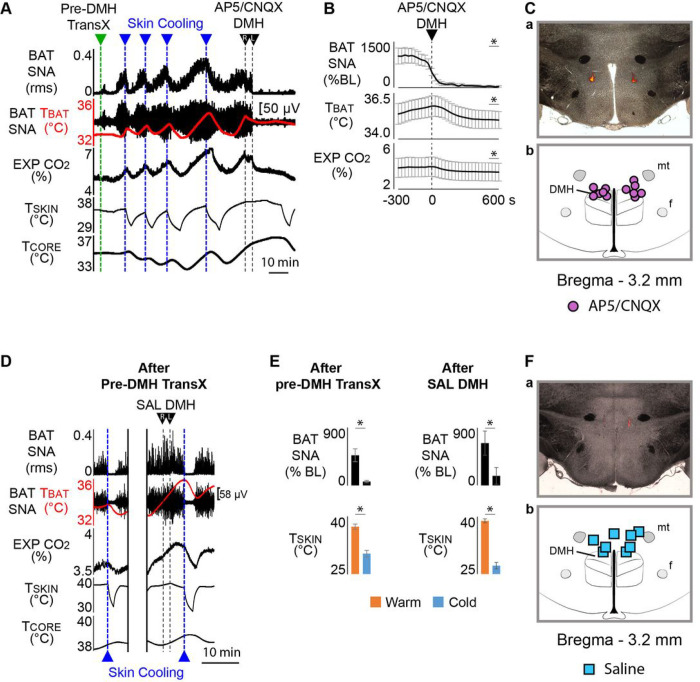
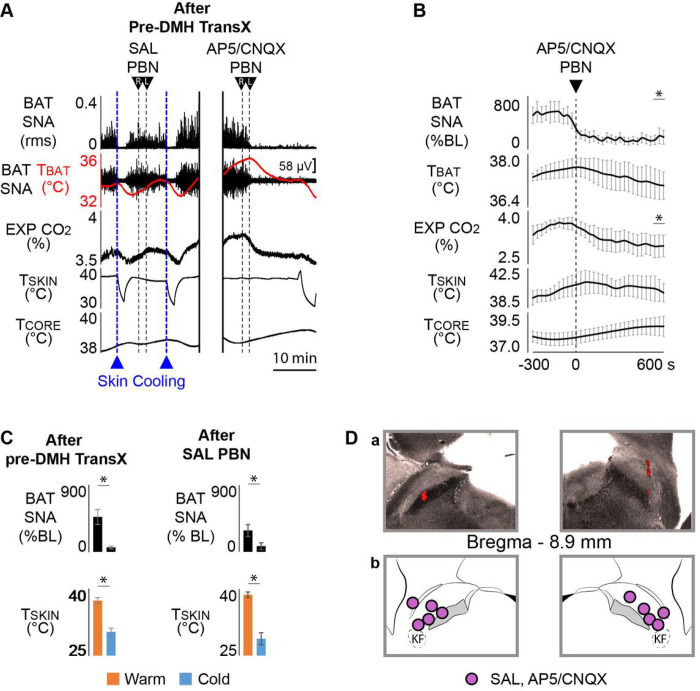
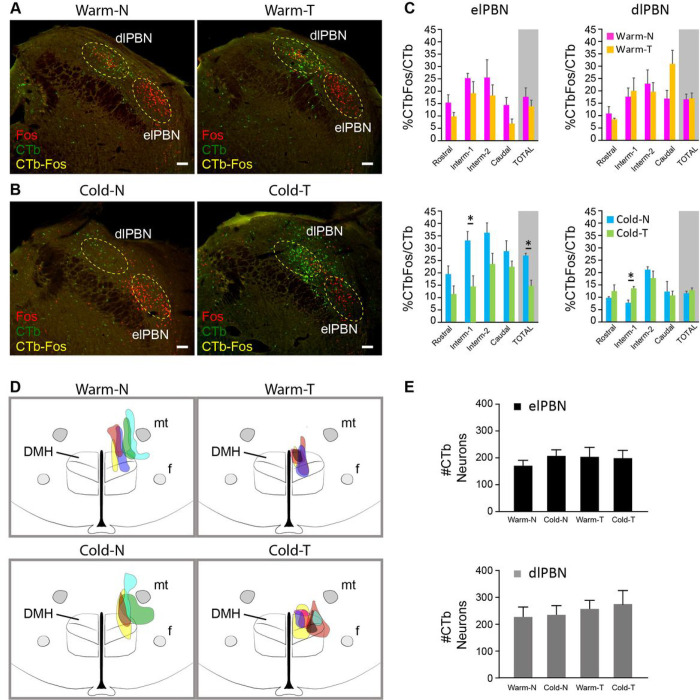
To maintain core body temperature in mammals, the CNS thermoregulatory networks respond to cold exposure by increasing brown adipose tissue and shivering thermogenesis. However, in hibernation or torpor, this normal thermoregulatory response is supplanted by "thermoregulatory inversion", an altered homeostatic state in which cold exposure causes inhibition of thermogenesis and warm exposure stimulates thermogenesis. Here we demonstrate the existence of a novel, dynorphinergic thermoregulatory reflex pathway between the dorsolateral parabrachial nucleus and the dorsomedial hypothalamus that bypasses the normal thermoregulatory integrator in the hypothalamic preoptic area to play a critical role in mediating the inhibition of thermogenesis during thermoregulatory inversion. Our results indicate the existence of a neural circuit mechanism for thermoregulatory inversion within the CNS thermoregulatory pathways and support the potential for inducing a homeostatically-regulated, therapeutic hypothermia in non-hibernating species, including humans.


Conflict of interest statement

Competing interests No conflicts of interest, financial or otherwise, are declared by the authors.

Figures

Figure 1
Figure 1. Inhibition of preoptic area (POA) neurons induces thermoregulatory inversion (TI) of brown adipose tissue (BAT) thermogenesis.
A. During normal thermoregulation (NT) in an anesthetized, naïve rat, episodes of skin cooling (reductionsin skin temperature (TSKIN), dotted blue lines) produced an increase in BAT sympathetic nerve activity (SNA), BAT temperature (TBAT, BAT thermogenesis), expired CO2 (EXP CO2), heart rate (HR), and arterial pressure (AP). Skin rewarming inhibited BAT SNA and reversed all the effects of skin cooling. Bilateral nanoinjection of muscimol (MUS) into the POA did not alter the ongoing level of BAT SNA, but subsequent episodes of skin cooling elicited inhibitions of BAT SNA, and reductions in TBAT, EXP CO2, and HR. Skin rewarming reactivated BAT SNA and increased TBAT, EXP CO2, and HR. Such cooling-evoked inhibitions and warming-evoked activations of BAT SNA are the hallmark of the TI state. Normal thermoregulatory responses to skin cooling and skin rewarming returned as the pharmacological effect of MUS on POA neurons waned. B. Group data representing the changes in BAT SNA in response to changes in TSKIN. a. Skin cooling in naïve rats increased BAT SNA; b. the low BAT SNA during skin warming was unaffected by saline (SAL) injection in POA; c. skin cooling increased BAT SNA after SAL injection in POA; d. MUS injection in POA did not change the ongoing level of BAT SNA; e. after MUS injection in POA, BAT SNA is lower during skin cooling than during skin warming. *p < 0.05; TCORE: core temperature. C. Schematic of the observed extent and location of MUS nanoinjections in the POA.
Figure 2
Figure 2. Pre-dorsomedial hypothalamus transection (Pre-DMH TransX) induces shivering thermoregulatory inversion (TI).
A. During normal thermoregulation (NT) in an anesthetized, naïve rat, episodes of skin and core cooling (reductions in skin temperature (TSKIN), dotted blue lines) produced an increase in the neck muscle EMG (reductions in skin temperature (TSKIN), dotted blue lines) produced an increase in the neck muscle EMG (nEMG), indicative of shivering. Skin rewarming reversed the increases in nEMG. A pre-DMH transX to a depth of −9 mm ventral to brain surface (pre-DMH TransX, DV −9 mm) did not affect the low level of nEMG when TCORE and TSKIN were warm; however, skin and core cooling no longer activated nEMG. Completing the pre-DMH TransX to −10 mm produced an immediate increase in nEMG. Subsequent skin cooling inhibited nEMG, indicating the TI state. With the rat in the TI state, bilateral nanoinjection of AP5/CNQX into the DMH completely reversed the warm-evoked increases in nEMG. B. Histological section through the DMH illustrating the deposits of blue fluorescent beads indicating thelocation of bilateral nanoinjection sites of AP5/CNQX in DMH. C. Schematic of the observed location of AP5/CNQX nanoinjections into the DMH (n = 6). D. Group data representing the changes in nEMG (%BL: % baseline) in response to changes in TSKIN, pre-DMH TransX (schematic below bar graphs) (n = 9) or nanoinjection of AP5/CNQX in DMH (n = 6). a. Skin cooling in naïve rats increased nEMG; b. pre-DMH TransX to DV −9 mm did not alter the low level of nEMG in warm rats; c. after pre-DMH TransX to DV −9 mm, skin cooling no longer increased nEMG; d. complete pre-DMH TransX to −10 mm elicited an immediate increase in nEMG in warm rats; e. after complete pre-DMH TransX, nEMG was lower during skin cooling than during skin warming; f. in the TI state, after complete pre-DMH TransX, AP5/CNQX nanoinjections into the DMH eliminated the warm-evoked activation of nEMG. *p < 0.05; TCORE: core temperature; TSKIN: skin temperature.
Figure 3
Figure 3. Following pre-DMH TransX, bilateral nanoinjection of AP5/CNQX in the DMH blocks the warm-evoked increase in BAT SNA.
A. In the TI state following a complete pre-DMH TransX, episodes of skin cooling (reductions in skin temperature (TSKIN), dotted blue lines) produced the typical cold-evoked inhibition of BAT sympathetic nerve activity (SNA), and reductions in BAT temperature (TBAT, BAT thermogenesis) and expired CO2 (EXP CO2). Skin rewarming activated BAT SNA and reversed the effects of skin cooling. Bilateral nanoinjection of AP5/CNQX into the DMH produced a prompt and long-lasting inhibition of the warm-evoked activation of BAT SNA. B. Group data (n = 6) representing the changes in BAT SNA (% BL: % baseline), TBAT, and EXP CO2, in response to nanoinjection of AP5/CNQX into the DMH. *p < 0.05; TCORE: core temperature. C. a. An example of a histological section through the DMH illustrating the deposits of red fluorescent beads indicating the locations of the bilateral nanoinjection sites of AP5/CNQX in the DMH; b. schematic of the locations of the nanoinjection sites of AP5/CNQX in the DMH. D. Following a complete pre-DMH TransX, episodes of skin cooling (reductions in TSKIN, dotted blue lines) produced the cold-evoked inhibition of BAT SNA, TBAT, and EXP CO2, characteristic of the TI state. Bilateral nanoinjections of saline (SAL) into the DMH did not alter either the ongoing level of BAT SNA or the subsequent episodes of skin cooling-elicited inhibitions of BAT SNA and reductions in TBAT and EXP CO2. E. Group data (n = 4) representing the changes in BAT SNA (% BL: % baseline), TBAT, and EXP CO2 in response to nanoinjections of SAL into the DMH. *p < 0.05. F. a. An example of a histological section through the DMH illustrating the deposits of red fluorescent beads indicating the locations of the bilateral nanoinjection sites of saline (SAL) in the DMH; b. schematic of the locations of the bilateral nanoinjections of SAL into the DMH.
Figure 4
Figure 4. Bilateral nanoinjections of AP5/CNQX in the parabrachial nuclei (PBN) blocked the warm-evoked BAT SNA characteristic of TI.
A. In the TI state following a complete pre-DMH TransX, episodes of skin cooling (reductions in TSKIN dotted blue lines) produced the typical cold-evoked inhibition of BAT SNA and reductions in TBAT and expired CO2 (EXP CO2). Skin rewarming activated BAT SNA and reversed the effects of skin cooling. Bilateral nanoinjections of saline (SAL) into the PBN did not alter either the ongoing level of BAT SNA or the inhibitions of BAT SNA and reductions in TBAT and EXP CO2 during skin cooling. Subsequent nanoinjections of AP5/CNQX into the PBN produced a prompt and long-lasting inhibition of the warm-evoked activation of BAT SNA and reduced TBAT and EXP CO2. B. Group data (n = 5) representing the time course of the reductions in BAT SNA (% BL: % baseline) andEXP CO2 in response to nanoinjections of AP5/CNQX into the PBN. *p < 0.05; TCORE: core temperature; TBAT: BAT temperature. C. Group data (n = 5) representing the levels of BAT SNA (% BL: % baseline) vs. TSKIN. Following a complete pre-DMH TransX, BAT SNA was elevated during skin warming, typical of the TI state. BAT SNA remained higher during skin warming than during skin cooling after nanoinjections of SAL into PBN. *p < 0.05. D. a. An example of a histological section through the PBN illustrating the deposits of red fluorescent beads indicating the locations of the bilateral nanoinjection sites of SAL and of AP5/CNQX in the PBN; b. schematic of the locations of the bilateral nanoinjections of SAL and of AP5/CNQX into the PBN.
Figure 5
Figure 5. Effect of warm and cold exposure on the activation of DMH-projecting neurons in the PBNfollowing pre-DMH TransX.
A. An example of the distribution of neurons double-labeled for warm-evoked Fos (red nucleus) and for CTb retrogradely transported from DMH (green cytoplasm) in the PBN of anesthetized naïve rats (Warm-N) and anesthetized pre-DMH TransX rats (Warm-T). The dotted yellow circles in dlPBN and elPBN represent the counting boxes used for the quantitative analysis reported in panel C. B. An example of the distribution of neurons double-labeled for warm-evoked Fos (red nucleus) andretrogradely transported CTb from DMH (green cytoplasm) in the parabrachial nuclei (PBN) of anesthetized naïve rats (Cold-N) and anesthetized pre-DMH TransX rats (Cold-T). The dotted yellow circles in dlPBN and in elPBN represent the counting boxes used for the quantitative analysis reported in panel C. C. Group data representing the changes in the percentage of retrogradely-labeled neurons (% CTbFos/CTb) in dlPBN and elPBN at the different rostrocaudal levels of PBN that also exhibited Fos in response to the four different treatments: Warm-N, Warm-T, Cold-N, and Cold-T. *p < 0.05. D. Schematic of the location and diffusion of unilateral (right) nanoinjection of the retrograde tracer, cholera toxin subunit B (CTb), into the DMH of the four treatment groups: Warm-N, Warm-T, Cold-N, and Cold-T. E. Group data indicating the counts (#CTb) of dlPBN and elPBN neurons retrogradely-labeled from CTbinjections in the DMH in the different treatment groups: Warm-N, Warm-T, Cold-N, and Cold-T. There were no differences in CTb counts among the 4 groups. Scale bar in all images = 100 μm.
Figure 6
Figure 6. Anatomical identification of the DMH-projecting neurons in PBN activated during warm and cold exposure in free-behaving, naïve rats.
A. Left picture: an example of the distribution of neurons double-labeled for warm-evoked Fos (red nucleus) and retrogradely transported CTb from DMH (green cytoplasm) in the parabrachial nuclei (PBN). The dashed yellow circles in the dorsolateral PBN (dlPBN) and in the externolateral PBN (elPBN) represent the counting boxes used for the quantitative analysis reported in panel C. The middle and right pictures show the dlPBN and elPBN, respectively, at higher magni cation. White arrows indicate a few examples of warm-activated neurons projecting to DMH (CTbFos) in dlPBN and elPBN. B. Left picture: an example of the distribution of neurons double-labeled for cold-evoked Fos (red nucleus) and retrogradely transported CTb from DMH (green cytoplasm) in the PBN. The dashed yellow circles in dlPBN and elPBN represent the counting boxes used for the quantitative analysis reported in panel C. The middle and right pictures show the dlPBN and elPBN, respectively, at higher magni cation. White arrows indicate a few examples of cold-activated neurons projecting to DMH (CTbFos) from the dlPBN and the elPBN. C. Group data representing the changes in the percentage of retrogradely-labeled neurons (% CTbFos/CTb) in dlPBN and elPBN responding to warm (pink) and cold exposure (blue). *p < 0.05. Scale bar in all images =100 μm.
Figure 7
Figure 7. VGluT2-expressing Dynorphinergic neurons in PBN project to DMH and are activated during TI.
A. Dynorphinergic neurons (containing pDyn transcripts; red) were observed in several PBN subdivisions along its rostro-caudal extent, but the strongest labeling was in dense clusters located in the dlPBN at the intermediate-1 and -2 levels. All Dyn neurons in these clusters express VGluT2 transcripts (blue), but none expresses VGAT transcripts (green). Neurons expressing both pDyn and VGluT2 transcripts display pink fluorescence. Samples were processed for ISH with RNAScope. B. A subset of DMH-projecting neurons in the dlPBN (green), retrogradely labeled with CTb, colocalize Dyn(red) in rats treated with colchicine to concentrate the neuropeptide in the cell bodies. Double-labeled neurons (with IHC) display yellow fluorescence. C. Example of DMH-projecting (CTb labelingwith IHC; green) Dyn (pDyn transcripts with ISH; red) neuronsin the dlPBN activated (c-fos transcripts with ISH; blue) during skin warming in an anesthetized naïve rat (Warm-N), a condition in which we expect thermogenesis to be inhibited. Triple-labeled neurons (CTb-pDyn-c-fos) display light brown fluorescence. Double-labeled neurons CTb-pDyn appear yellow, double-labeled neurons CTb-c-fos appear cyan, whereas double-labeled neurons pDyn-c-fos appear pink. D. Fewer Dyn neurons (pDyn transcripts with ISH; blue) in the dlPBN were activated (c-fos transcripts withISH; red) in anesthetized naïve rats exposed to skin cooling (Cold-N) than in either anesthetized naïve rats during skin warming (Warm-N) or pre-DMH TransX rats subjected to skin cooling (Cold-T). These observations are consistent with a thermogenesis-inhibiting role for these DMH-projecting Dyn neurons in the dlPBN, also supported by our nding that more of them are activated in Warm-N and Cold-T rats when thermogenesis is inhibited than in Cold-N rats, when thermogenesis is active. Scale bar in all images = 100 μm.
Figure 8
Figure 8. Activation of κ-opioid receptors is necessary for the cold-evoked inhibition of BAT SNA in the TI and torpor-like state.
A. During normal thermoregulation (NT) in an anesthetized, naïve rat, skin cooling (reductions in skin temperature (TSKIN)) was used to elicit a sustained increase in BAT sympathetic nerve activity (SNA) and BAT temperature (TBAT, BAT thermogenesis). Bilateral nanoinjections of dynorphin (Dyn) into the DMH produced a prompt and complete inhibition of the cooling-evoked level of BAT SNA and resulted in a strong decrease of TBAT. Bilateral injection of the protease inhibitor, Amastatin, into DMH was used to inhibit Dyn cleavage. B. Group data (n = 4) representing the time course of the changes in BAT SNA (% BL: % baseline), and in TBAT following nanoinjections of either Amastatin or Dyn into DMH. *p < 0.05; TBAT: BAT temperature. C. a. An example of a histological section through the DMH illustrating the deposits of green fluorescent beads indicating the locations of the bilateral nanoinjection sites of Amastatin and Dyn into the DMH; b. schematic of the locations of the bilateral nanoinjections of Amastatin and Dyn into the DMH. D. In the TI state following a complete pre-DMH TransX, episodes of skin cooling (reductions in TSKIN, dotted blue lines) produced the typical cold-evoked inhibition of BAT SNA. Skin rewarming activated BAT SNA and reversed the effects of skin cooling. Bilateral nanoinjections of the κ-opioid antagonist, NOR-BNI, into the DMH completely prevented the cold-evoked inhibition of BAT SNA. E. Group data (n = 6) representing the levels of BAT SNA (% BL: % baseline) vs. TSKIN. Following a complete pre-DMH TransX, BAT SNA was elevated during skin warming and reduced by skin cooling. Nanoinjection of NOR-BNI into the PBN eliminated the skin cooling-evoked decrease in BAT SNA, which remained elevated during skin cooling to a level comparable to that during skin warming. *p < 0.05. F. a. An example of a histological section through the DMH illustrating the deposits of blue fluorescent beads indicating the locations of the bilateral nanoinjections sites of NOR-BNI into DMH; b. schematic of the locations of the bilateral nanoinjections of NOR-BNI into DMH. G. Group data (n = 4) representing the mean ± SEM time course of the reductions in core temperature (TCORE) in response to ICV injection of either NOR BNI + CHA (purple trace) or SAL + CHA (green trace) in free-behaving rats maintained in a cold ambient temperature (TAMB). *p < 0.05.

References

    1. Morrison S.F. & Nakamura K. Central Mechanisms for Thermoregulation. Annu Rev Physiol 81, 285–308 (2019). - PubMed
    1. Morrison S.F., Madden C.J. & Tupone D. Central control of brown adipose tissue thermogenesis. Front Endocrinol (Lausanne) 3 (2012). - PMC - PubMed
    1. Nakamura K. & Morrison S.F. A thermosensory pathway mediating heat-defense responses. Proc Natl Acad Sci U S A 107, 8848–8853 (2010). - PMC - PubMed
    1. Nakamura K. & Morrison S.F. A thermosensory pathway that controls body temperature. Nat Neurosci 11, 62–71 (2008). - PMC - PubMed
    1. Cano G., et al. Anatomical substrates for the central control of sympathetic outflow to interscapular adipose tissue during cold exposure. J Comp Neurol 460, 303–326 (2003). - PubMed

Publication types

LinkOut - more resources