[Preprint]. 2023 Mar 20:2023.03.16.532979.
doi: 10.1101/2023.03.16.532979.

Two-fluid dynamics and micron-thin boundary layers shape cytoplasmic flows in early Drosophila embryos

Affiliations

Two-fluid dynamics and micron-thin boundary layers shape cytoplasmic flows in early Drosophila embryos

Claudio Hernández López et al. bioRxiv. .

Update in

Abstract

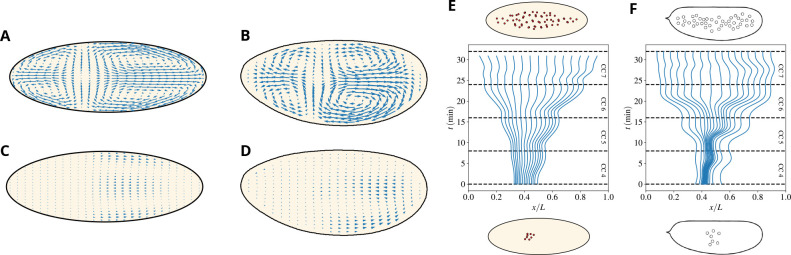
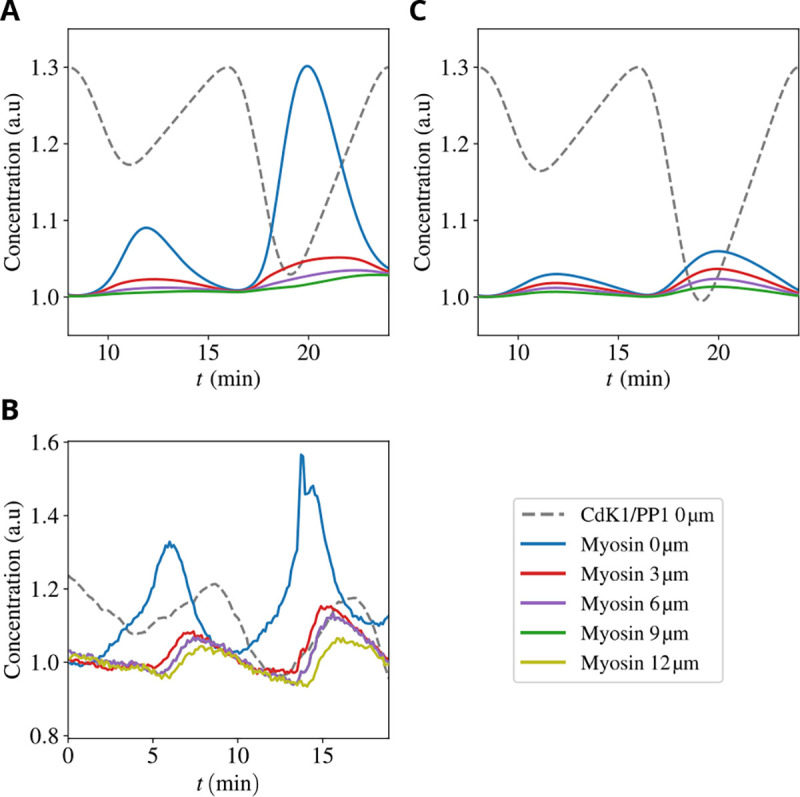
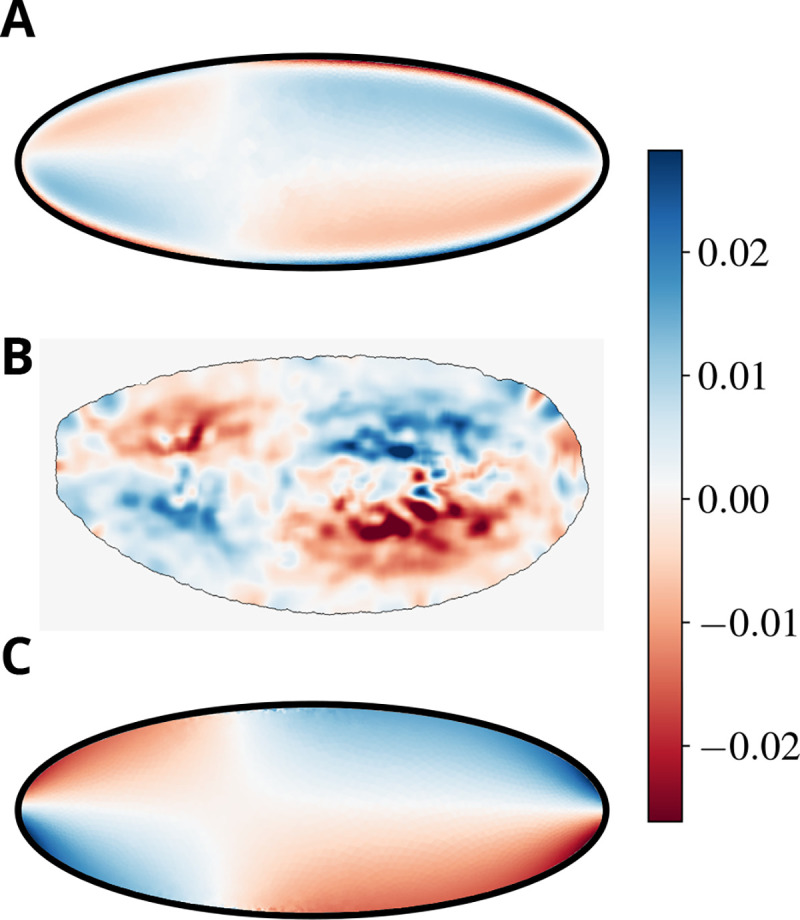
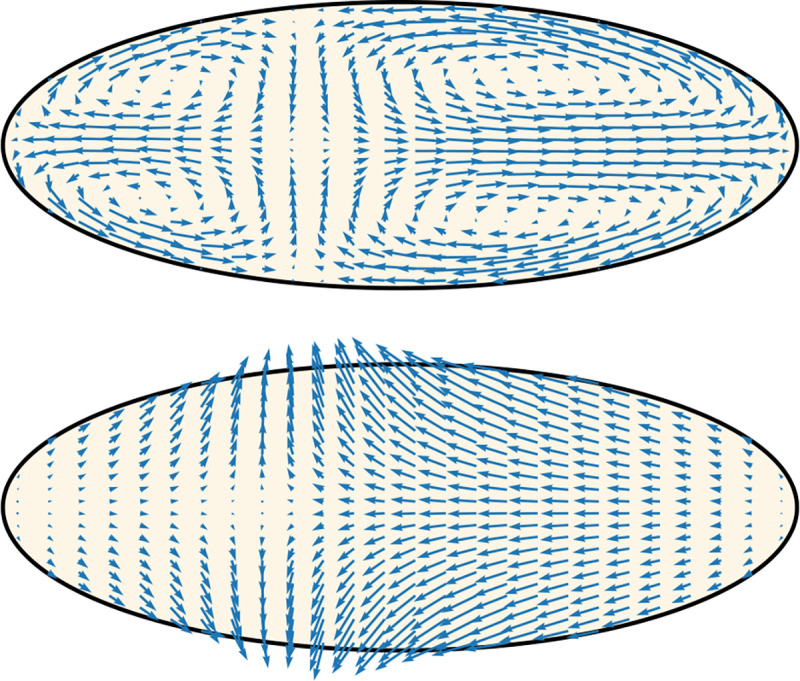
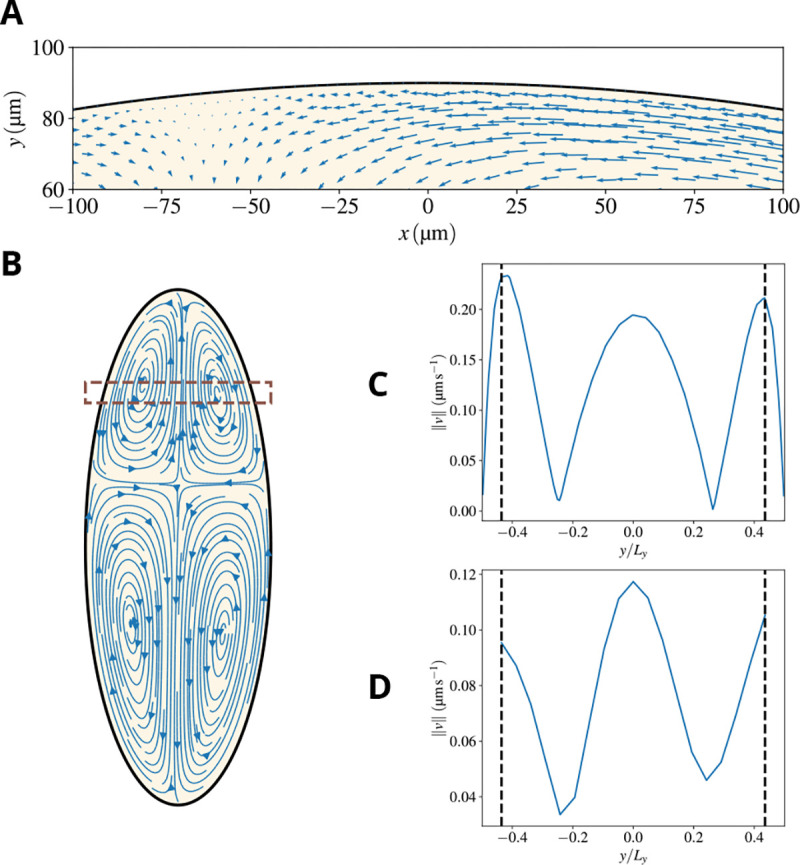
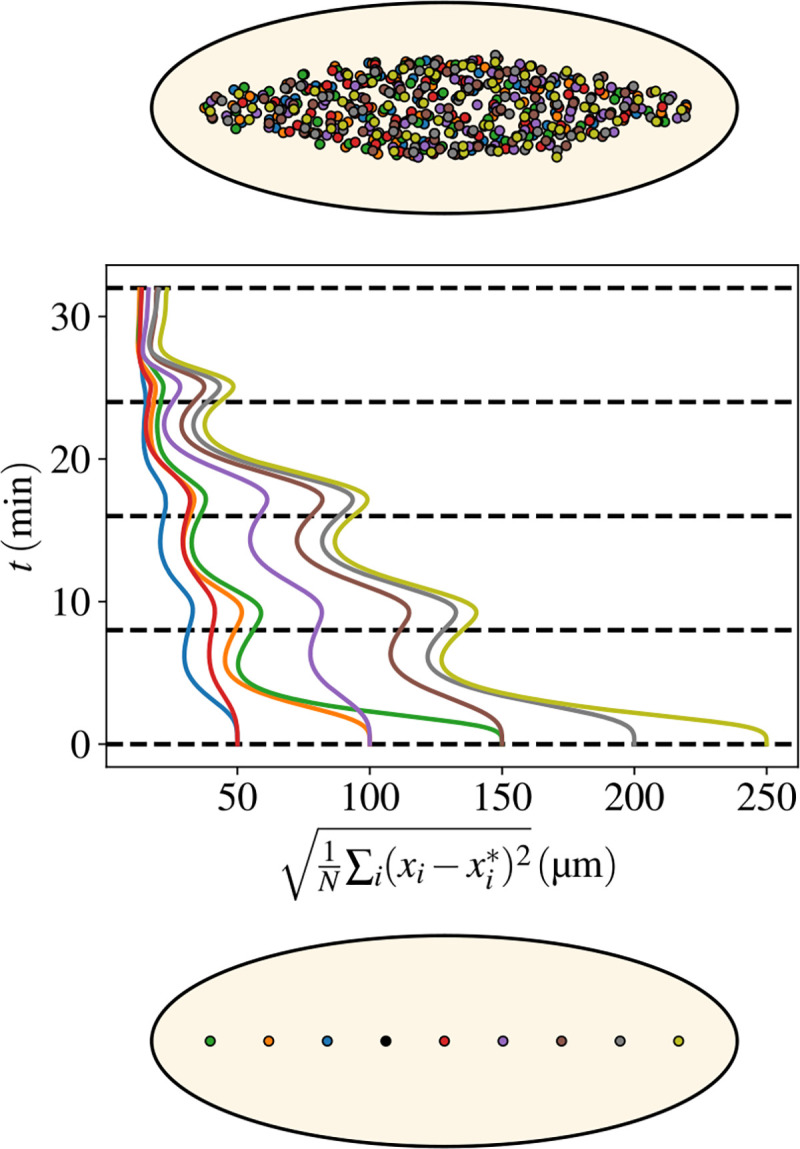
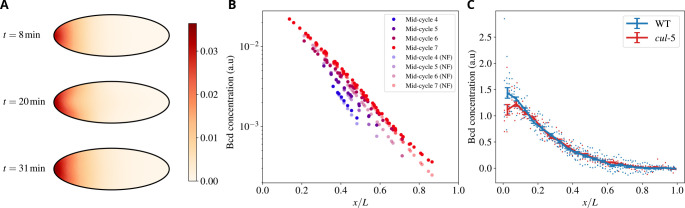
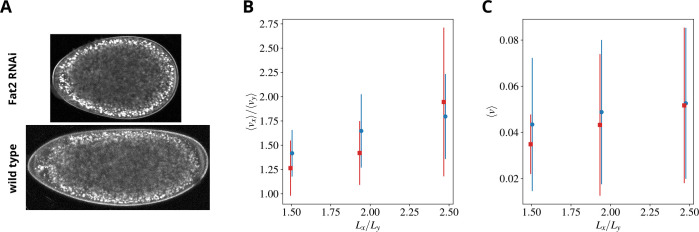
Cytoplasmic flows are widely emerging as key functional players in development. In early Drosophila embryos, flows drive the spreading of nuclei across the embryo. Here, we combine hydrodynamic modeling with quantitative imaging to develop a two-fluid model that features an active actomyosin gel and a passive viscous cytosol. Gel contractility is controlled by the cell cycle oscillator, the two fluids being coupled by friction. In addition to recapitulating experimental flow patterns, our model explains observations that remained elusive, and makes a series of new predictions. First, the model captures the vorticity of cytosolic flows, which highlights deviations from Stokes' flow that were observed experimentally but remained unexplained. Second, the model reveals strong differences in the gel and cytosol motion. In particular, a micron-sized boundary layer is predicted close to the cortex, where the gel slides tangentially whilst the cytosolic flow cannot slip. Third, the model unveils a mechanism that stabilizes the spreading of nuclei with respect to perturbations of their initial positions. This self-correcting mechanism is argued to be functionally important for proper nuclear spreading. Fourth, we use our model to analyze the effects of flows on the transport of the morphogen Bicoid, and the establishment of its gradients. Finally, the model predicts that the flow strength should be reduced if the shape of the domain is more round, which is experimentally confirmed in Drosophila mutants. Thus, our two-fluid model explains flows and nuclear positioning in early Drosophila, while making predictions that suggest novel future experiments.


Figures

Figure 1.
Figure 1.. The two-fluid model captures the large-scale feature of embryonic flows.
A)-B) Typical cytoplasmic flow observed during the AP expansion phase in our model (A) and experiments (B). C)-D) Typical cytoplasmic backflow observed during the AP contraction phase in our model (C) and experiments (D). The length of the arrows is in the same units as in panel (A,B) so as to highlight the reduced speed of backflow. E)-F) Reconstructed initial distributions to achieve a uniform nuclear distribution at the end of cell cycle 7 in our model (E) and wild-type experiments (F). Particles are uniformly distributed along the AP axis at the end of cycle 7 and simulated (E) or measured (F) cytoplasmic flows are used to evolve their position backward in time until the beginning of cycle 4.
Figure 2.
Figure 2.. Myosin dynamics in the early embryo.
Upper and middle panels: Total concentration of myosin for cell cycles 5–6 at embryo surface (blue line) and varying distances from the surface (see legend) in our model (A) and experiments (B). Dotted black line: The Cdk1 to PP1 ratio, which constitutes a proxy for the phase of the cell cycle. Lower panel: Total concentration of myosin for the same conditions as in panel (A) but for a passive gel, i.e., suppressing the active component σa of the stress in (4).
Figure 3.
Figure 3.. Our model explains experimental observations of the sol vorticity.
A)-B) A heatmap showing the vorticity field ωv=×v) of the sol flow in our model (A) and in experiments (B). C) The total vorticity ηsωu+ηωv (normalized by η+ηs to preserve its physical dimensions), showing its extrema at the boundary of the domain, which reflect the harmonic nature of the field in our specific model (see discussion in the body of the paper).
Figure 4.
Figure 4.. The multiphase nature of the dynamics in our model is germane.
The two plots show a typical flow of the sol (upper) and the gel (lower). Note that, contrary to the sol, the gel mainly flows from the inside of the embryo towards the cortex, driving the peaks in myosin concentration in Figure 2.
Figure 5.
Figure 5.. Our model predicts a thin boundary layer close to the cortex.
A) A zoom of the region close to the cortex, meant to highlight that substantial cytoplasmic flows are observed relatively close to the cortex, as observed in experiments. In fact, the no-slip boundary condition forces the sol velocity to drop to zero at the cortex but the decrease is sharp and happens in a boundary layer that is micronthick. This is visually demonstrated by taking the velocity in the box shown in panel (B) and plotting its amplitude vs the position (normalized by the width of the embryo at that AP position). Panel (C) shows results for our simulations, and panel (D) for an analogous region in the experiments. The segmented vertical lines represent the point from which no experimental velocities can be resolved, which reinforces the impossibility of resolving a boundary layer such as the one present in the simulations with the available experimental data.
Figure 6.
Figure 6.. Flows ensure a uniform distribution of nuclei along the AP embryonic axis irrespective of the initial nucleus’ location.
Bottom: A series of positions (coded by different colors) for the first nucleus that starts the division cycles. The nine different locations go from 10% to 90% of the embryo AP length. The reference configuration has the nucleus placed at 40% of the embryo AP length. Middle: The evolution in time (flowing upwards) of the distance with respect to the reference configuration. The distance is defined as 1Ni=1Nxixi*2, where N is the total number of nuclei (at that time), xi* and xi are the positions of nuclei in the reference or the displaced configurations. The best matching that minimizes the total distance between the two sets of nuclei is obtained by using the Belief Propagation algorithm described in the Methods. Colors of the curves correspond to the initial positions in the bottom panel. Three pairs correspond to the two sides of the reference positions and the last two curves refer to the initial positions at 80% and 90% of the AP length. Top: The final configurations of nuclei (for the whole ensemble of colors). Note that all colors are mixed up, witnessing the self-correcting nature of the AP spreading process. That is shown more quantitatively by the middle curves, which all reduce to values corresponding to distances of a few microns distance between pairs of nuclei of the various configurations.
Figure 7.
Figure 7.. Embryonic cytoplasmic flows weakly affect the establishment of the Bicoid morphogenetic gradient.
A) Heatmap showing the Bicoid concentration profile in the embryo, and the characteristic half-moon shape with the concentration higher at the cortex than in the bulk. B) The concentration of Bicoid vs the (normalized) position along the AP axis for various cycles, as indicated in the color legend. NF stands for “No Flow”, i.e., situations where cytoplasmic flows were suppressed. Values are reported at the position of each nucleus. C) Experimental comparison of the Bicoid gradient at cell cycle 13 in wild-type and cullin-5 mutant embryos, where flows are strongly suppressed [29]. Datapoints were binned in each case, with the continuous line and error bars representing each bin’s average and standard error respectively.
Figure 8.
Figure 8.. Predictions and experimental verification of flows in rounded embryos
A) A wild-type and a round embryo are shown in the lower/upper panels, respectively. Mutants are generated by using a knockdown of Fat2 (Fat2 RNAi), a major regulator of the elongation of the egg chamber. Panels B) and C) show the ratio between the embryo-averaged longitudinal and transverse sol speeds and the embryo-averaged sol speed, respectively, time-averaged over CC6. Simulation/experimental data are shown in blue circles/red squares, respectively. Error bars represent the standard deviation of the space averages during CC6.

Similar articles

References

    1. Seifriz W., Mechanism of Protoplasmic Movement, Nature 171, 1136 (1953). - PubMed
    1. Alim K., Amselem G., Peaudecerf F., Brenner M. P., and Pringle A., Random network peristalsis in Physarum polycephalum organizes fluid flows across an individual, Proceedings of the National Academy of Sciences 110, 13306 (2013). - PMC - PubMed
    1. Stewart P. A., The Organization of Movement in Slime Mold Plasmodia, in Primitive Motile Systems in Cell Biology (Second Edition), edited by Allen R. D. and Kamiya N. (Academic Press, 1964) pp. 69–78.
    1. Nonaka S., Tanaka Y., Okada Y., Takeda S., Harada A., Kanai Y., Kido M., and Hirokawa N., Randomization of Left–Right Asymmetry due to Loss of Nodal Cilia Generating Leftward Flow of Extraembryonic Fluid in Mice Lacking KIF3B Motor Protein, Cell 95, 829 (1998). - PubMed
    1. Hirokawa N., Tanaka Y., Okada Y., and Takeda S., Nodal Flow and the Generation of Left-Right Asymmetry, Cell 125, 33 (2006). - PubMed

Publication types