[Preprint]. 2023 Mar 15:2023.03.13.532299.
doi: 10.1101/2023.03.13.532299.

GITR and TIGIT immunotherapy provokes divergent multi-cellular responses in the tumor microenvironment of gastrointestinal cancers

Affiliations

GITR and TIGIT immunotherapy provokes divergent multi-cellular responses in the tumor microenvironment of gastrointestinal cancers

Anuja Sathe et al. bioRxiv. .

Update in

Abstract

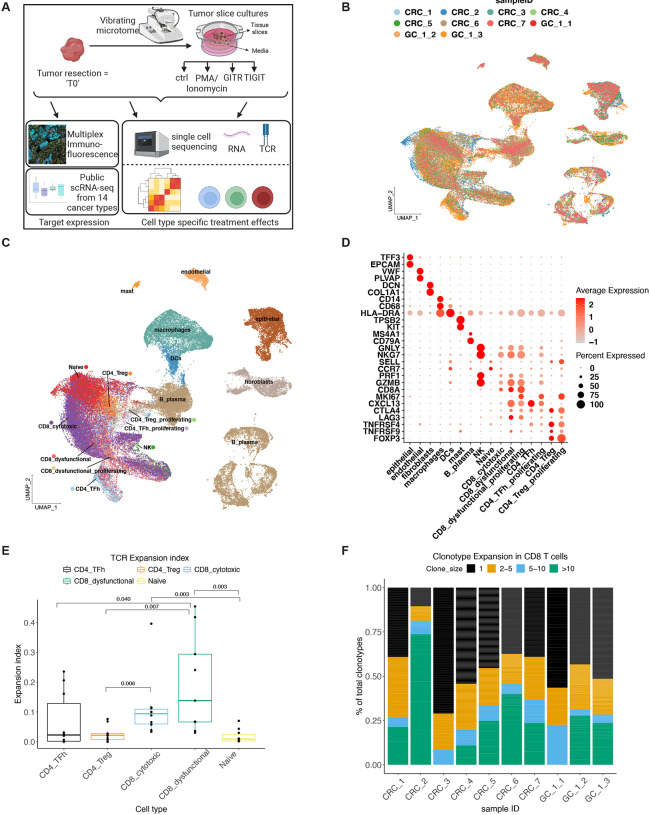
Understanding the cellular mechanisms of novel immunotherapy agents in the human tumor microenvironment (TME) is critical to their clinical success. We examined GITR and TIGIT immunotherapy in gastric and colon cancer patients using ex vivo slice tumor slice cultures derived from cancer surgical resections. This primary culture system maintains the original TME in a near-native state. We applied paired single-cell RNA and TCR sequencing to identify cell type specific transcriptional reprogramming. The GITR agonist was limited to increasing effector gene expression only in cytotoxic CD8 T cells. The TIGIT antagonist increased TCR signaling and activated both cytotoxic and dysfunctional CD8 T cells, including clonotypes indicative of potential tumor antigen reactivity. The TIGIT antagonist also activated T follicular helper-like cells and dendritic cells, and reduced markers of immunosuppression in regulatory T cells. Overall, we identified cellular mechanisms of action of these two immunotherapy targets in the patients' TME.

Keywords: GITR; TIGIT; colon cancer; gastric cancer; scRNA-seq; tumor microenvironment.


Conflict of interest statement

Conflict of interest statement: The authors declare no potential conflicts of interest.

Figures

Figure 1.
Figure 1.
(A) Schematic representation of study design. (B-C) UMAP representation of dimensionally reduced data following batch-corrected graph-based clustering of all datasets colored by (B) samples and (C) cell type. (D) Dot plot depicting average expression levels of specific lineage-based marker genes together with the percentage of cells expressing the marker. (E) TCR expansion index for respective cell types. p from pairwise Wilcoxon test with Benjamini-Hochberg correction. (F) Frequencies of clonotypes in CD8 T cells from respective patients.
Figure 2.
Figure 2.
(A-B) Scaled expression of respective genes in various cell types from (A) all CRC T0 resections, (B) all GC T0 resections. (C-D) Immunofluorescence staining for respective proteins or their merged image in an example region of interest from sample CRC-2. Scale bar = 50 μm. (E-G) Scaled expression of respective genes in various cell types from (E) CRCs in the publicly available tumor immune atlas dataset, (F) our previously published GC dataset and (G) remaining 12 tumor types in the tumor immune atlas dataset.
Figure 3.
Figure 3.
(A-B) UMAP representation of dimensionally reduced data from T0 and 24 hour ctrl TSCs following batch-corrected graph-based clustering of all datasets colored by (A) experimental condition and (B) cell type. (C) Quantile-quantile plot comparing the proportion distributions of respective cell lineages across all T0 and ctrl TSCs. (D) Scatter plot indicating average log expression of marker genes for T0 cell lineages in T0 and ctrl TSC in respective cell lineage, annotated with the number of marker genes examined. Pearson’s co-efficient was calculated using non-log transformed values.
Figure 4.
Figure 4.
(A-C) Scaled expression of respective genes in control or PMA/Ionomycin treated (A) CD8 T cells, (B) TFh-like cells and (C) Treg cells. (D-E) Respective pathway activity in control and treated CD8 T cells with T-test p. (F-G) Cohen’s effect size and p of t-test comparison of respective pathway activity between control and treated cells from each individual sample.
Figure 5.
Figure 5.
(A) Violin plot depicting the expression of CCL4 in control or GITR agonist treated CD8 T cells derived from all samples. (B) Cohen’s effect size and p of t-test comparison of cytotoxic effector pathway activity between control and treated CD8 T cells from each individual sample. (C) UMAP representation of T0 samples identifying cells significantly associated with transcriptional responders (TR) or non-responders (TNR) based on differential abundance analysis. (D) Scaled expression of respective genes in cells significantly associated with TR or TNR. (E) Expression of gene signature of CD8 T cell dysfunction in TR and TNR with t-test p. (F) Cytotoxic effector pathway activity in control and treated cytotoxic and dysfunctional CD8 T cells with t-test p. (G) Schematic representation summarizing the ex vivo effects of GITR agonist in the TME.
Figure 6.
Figure 6.
(A) Scaled expression of respective genes in control or TIGIT inhibitor treated CD8 T cells. (B-D) Respective pathway activity in control and treated CD8 T cells with t-test p in (B-C) CD8 T cell subtypes and (D) baseline expanded CD8 TCR clonotypes per sample. (E-F) Cohen’s effect size and p of t-test comparison of respective pathway activity between control and treated cells from each individual sample. (G) Violin plots depicting the expression of respective genes in CD8 T cells from GC-1–2 and GC-1–3 samples.
Figure 7.
Figure 7.
(A) Volcano plot demonstrating significant differentially expressed genes in TFh-like cells relative to control following TIGIT inhibition. (B) Pathway activity in control and treated TFh-like cells with t-test p. (C) Cohen’s effect size and p of t-test comparison of pathway activity between control and treated TFh-like cells from each individual sample. (D) Average expression of respective genes in each sample in control and treated Treg cells with MAST DE adjusted p-value. (E) Average expression of respective genes in each sample in control and treated dendritic cells with MAST DE adjusted p-value. (F) Cohen’s effect size and p of t-test comparison of pathway activity between control and treated tumor epithelial cells from each individual sample. (G) Schematic representation summarizing the ex vivo effects of TIGIT antagonist in the TME.

References

    1. Ho WW, Pittet MJ, Fukumura D, Jain RK. The local microenvironment matters in preclinical basic and translational studies of cancer immunology and immunotherapy. Cancer Cell. 2022;40(7):701–2. - PMC - PubMed
    1. van der Leun AM, Thommen DS, Schumacher TN. CD8(+) T cell states in human cancer: insights from single-cell analysis. Nat Rev Cancer. 2020;20(4):218–32. - PMC - PubMed
    1. Voabil P, de Bruijn M, Roelofsen LM, Hendriks SH, Brokamp S, van den Braber M, et al. An ex vivo tumor fragment platform to dissect response to PD-1 blockade in cancer. Nature Medicine. 2021;27(7):1250–61. - PubMed
    1. Jiang X, Seo YD, Sullivan KM, Pillarisetty VG. Establishment of Slice Cultures as a Tool to Study the Cancer Immune Microenvironment. Methods Mol Biol. 2019;1884:283–95. - PubMed
    1. Kenerson HL, Sullivan KM, Labadie KP, Pillarisetty VG, Yeung RS. Protocol for tissue slice cultures from human solid tumors to study therapeutic response. STAR Protoc. 2021;2(2):100574. - PMC - PubMed

Publication types