. 2023 Mar 13:14:1140993.
doi: 10.3389/fimmu.2023.1140993. eCollection 2023.

A degradome-based prognostic signature that correlates with immune infiltration and tumor mutation burden in breast cancer

Affiliations

A degradome-based prognostic signature that correlates with immune infiltration and tumor mutation burden in breast cancer

Yulou Luo et al. Front Immunol. .

Abstract

Introduction: Female breast cancer is the most common malignancy worldwide, with a high disease burden. The degradome is the most abundant class of cellular enzymes that play an essential role in regulating cellular activity. Dysregulation of the degradome may disrupt cellular homeostasis and trigger carcinogenesis. Thus we attempted to understand the prognostic role of degradome in breast cancer by means of establishing a prognostic signature based on degradome-related genes (DRGs) and assessed its clinical utility in multiple dimensions.

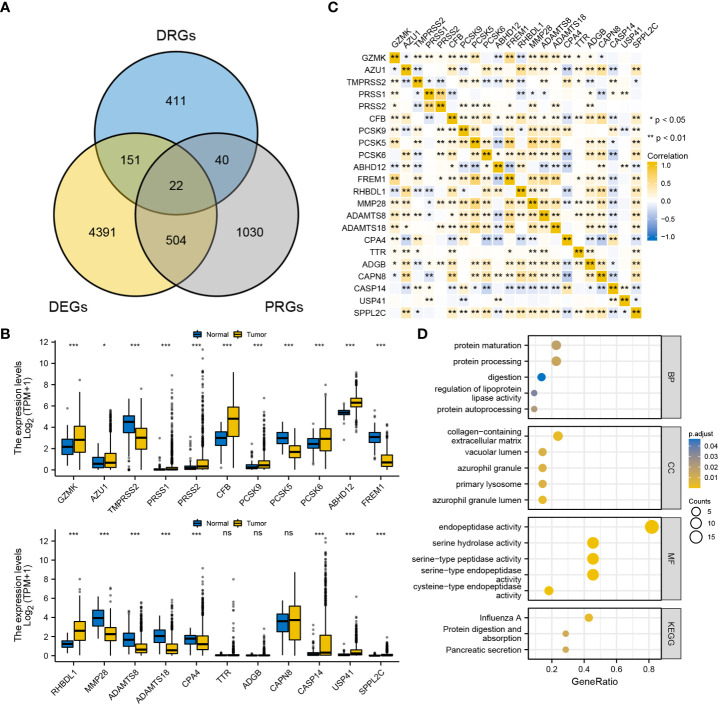
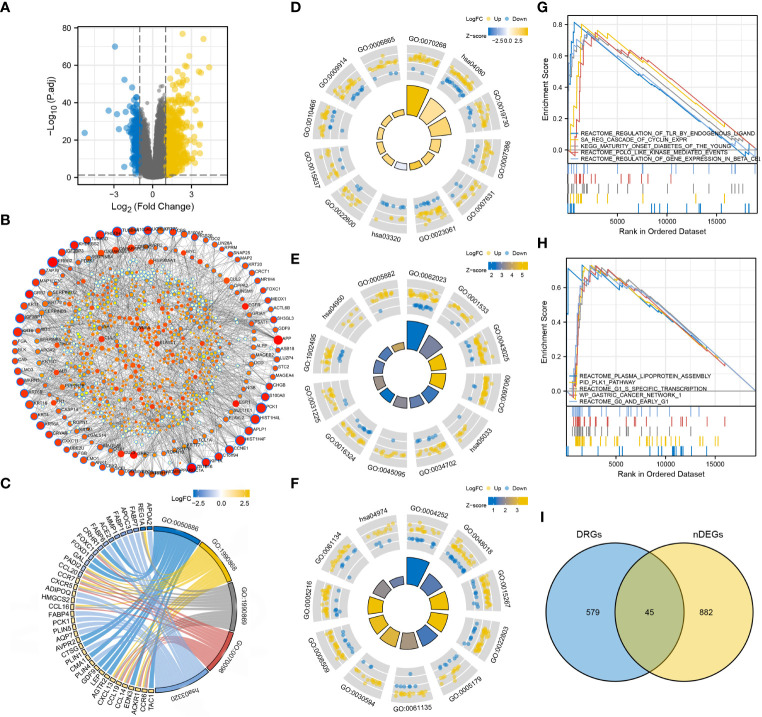
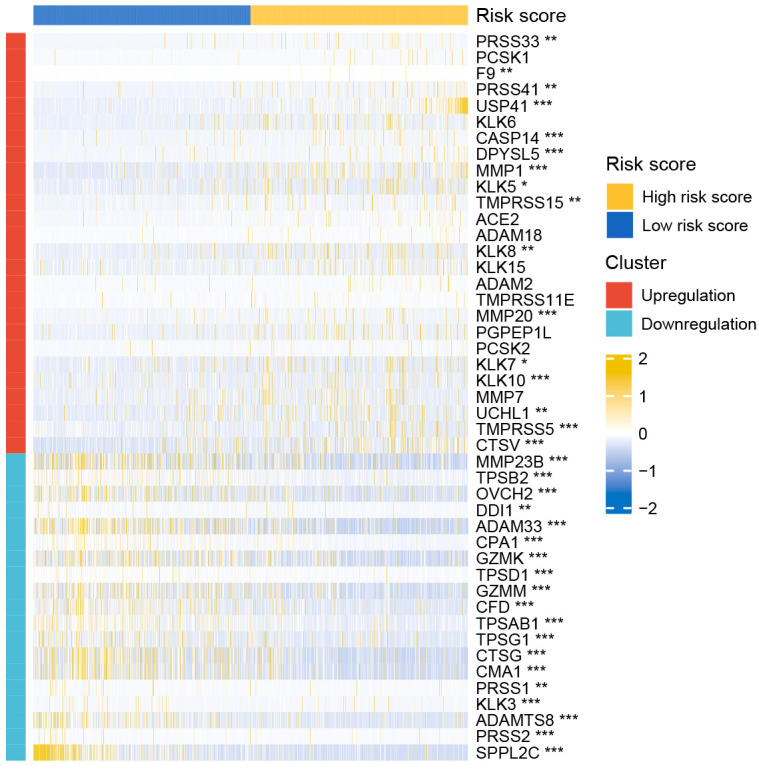
Methods: A total of 625 DRGs were obtained for analysis. Transcriptome data and clinical information of patients with breast cancer from TCGA-BRCA, METABRIC and GSE96058 were collected. NetworkAnalyst and cBioPortal were also utilized for analysis. LASSO regression analysis was employed to construct the degradome signature. Investigations of the degradome signature concerning clinical association, functional characterization, mutation landscape, immune infiltration, immune checkpoint expression and drug priority were orchestrated. Cell phenotype assays including colony formation, CCK8, transwell and wound healing were conducted in MCF-7 and MDA-MB-435S breast cancer cell lines, respectively.

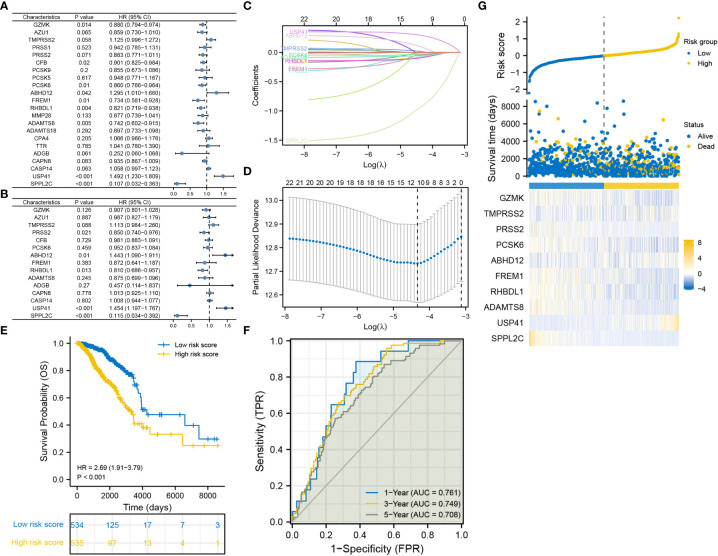
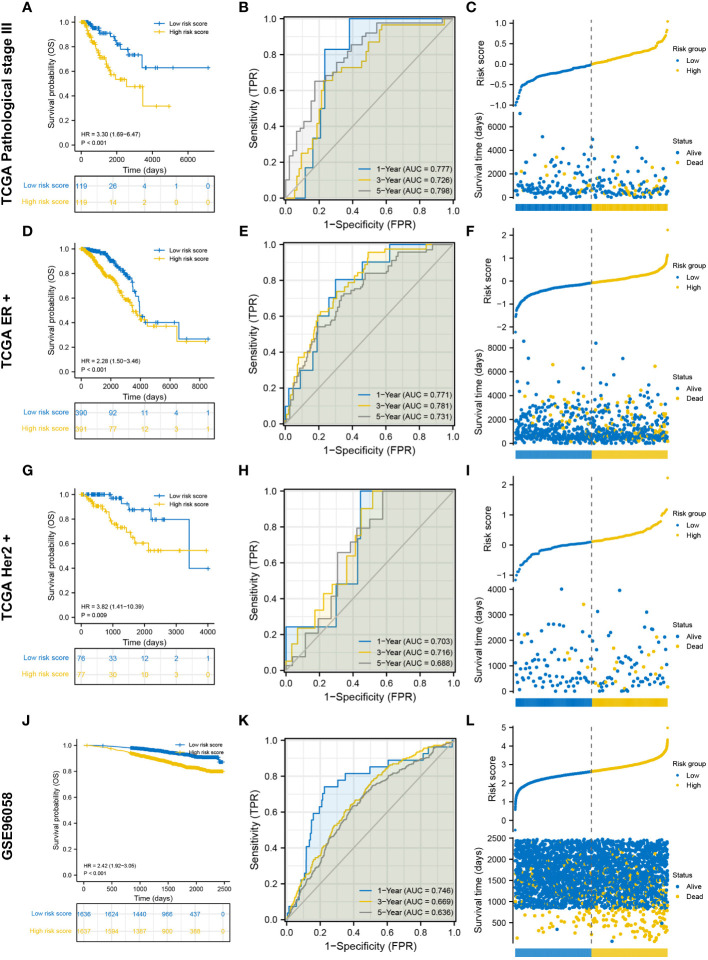
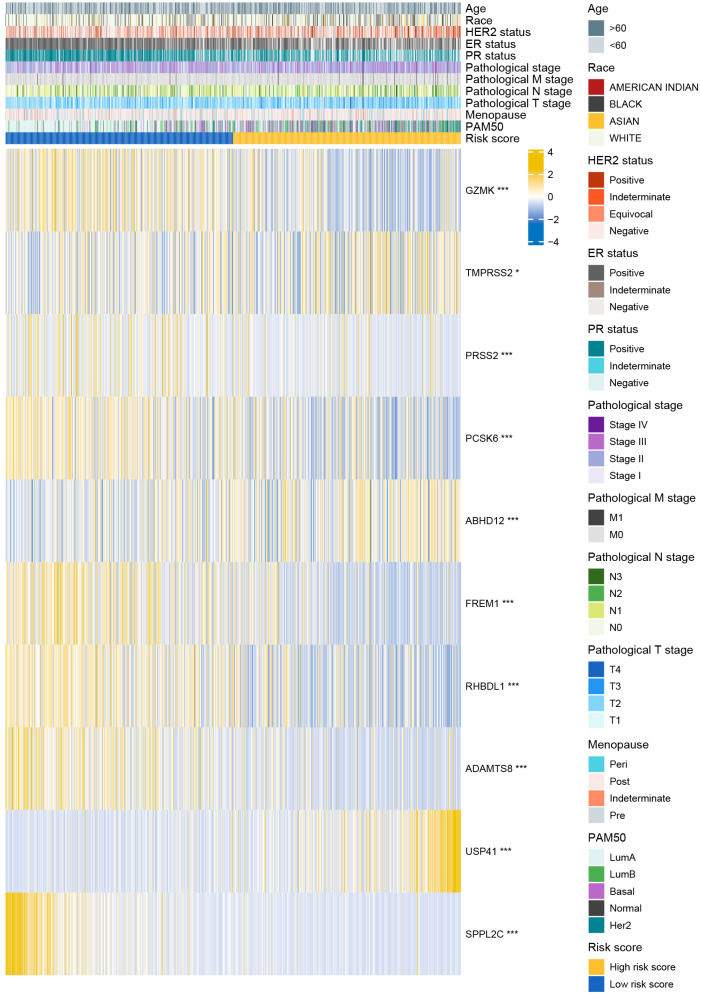
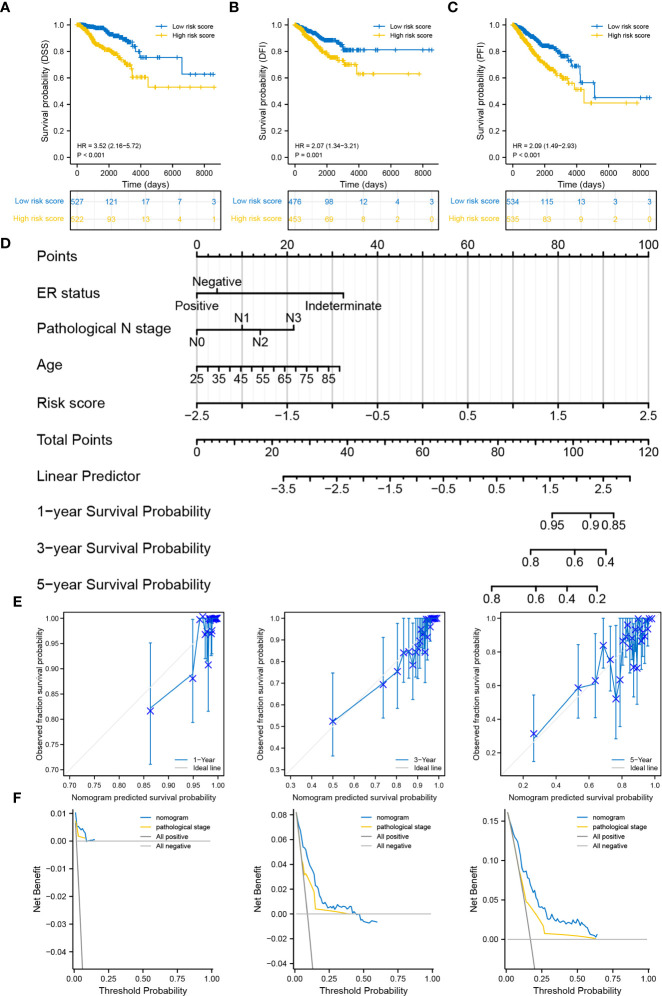
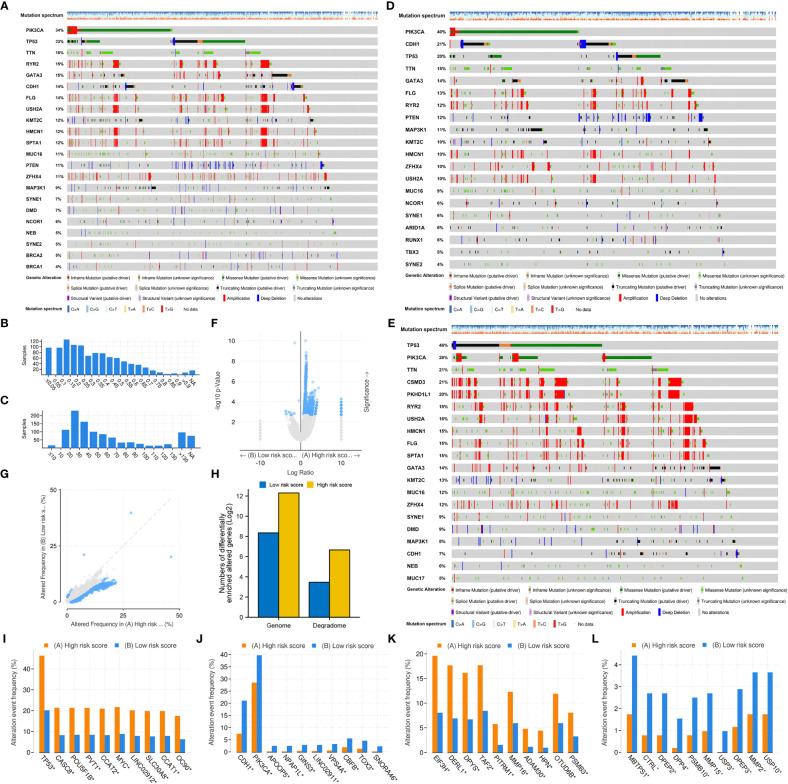
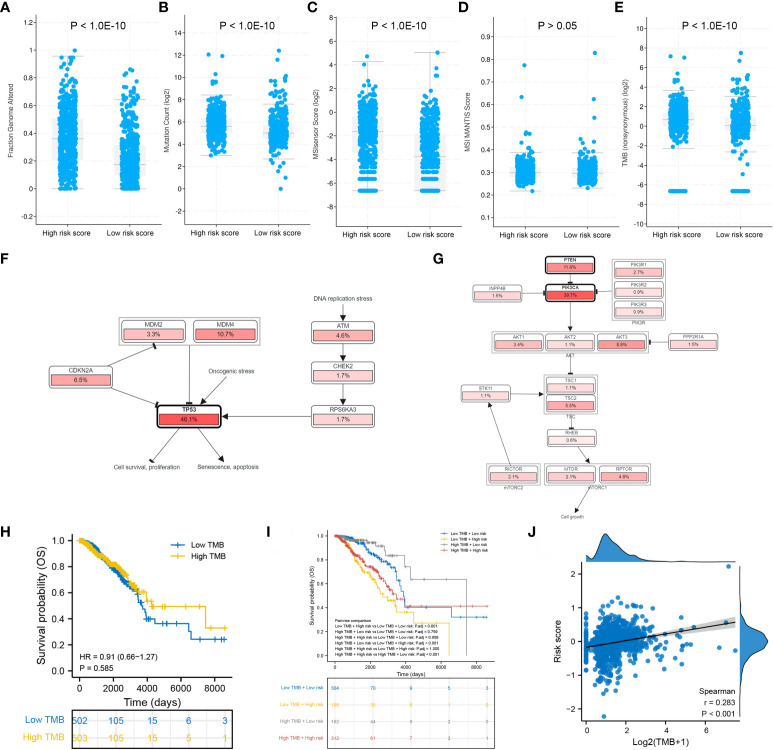
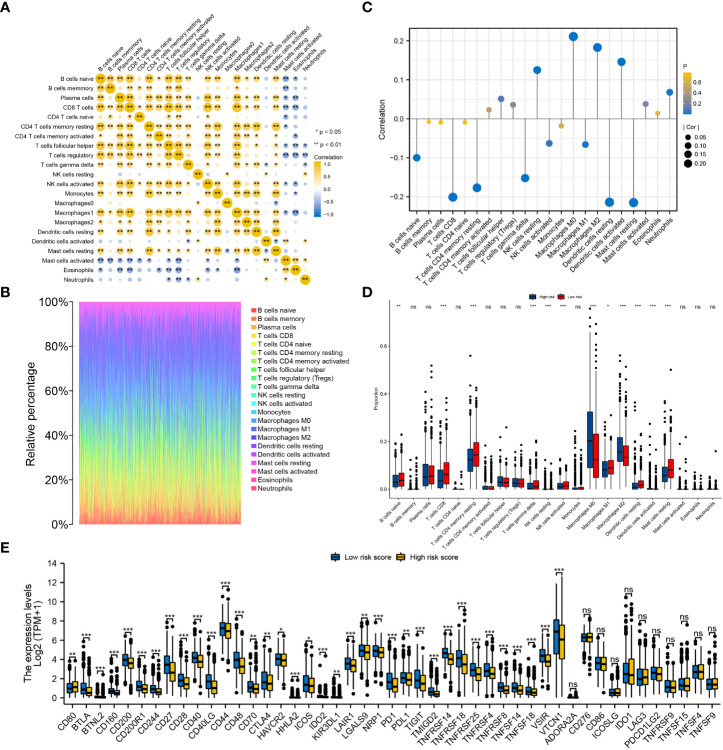
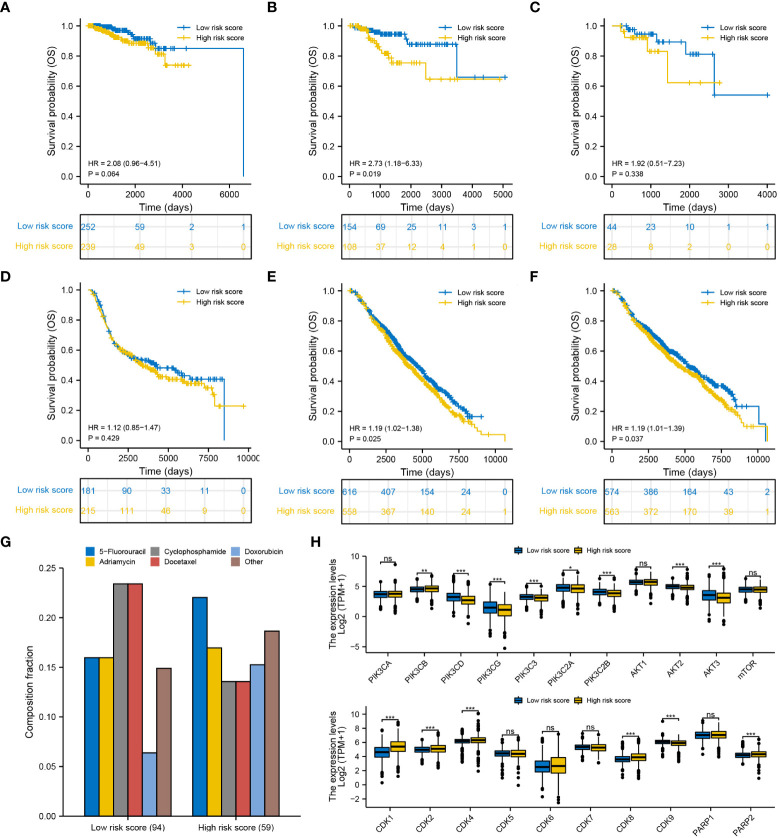
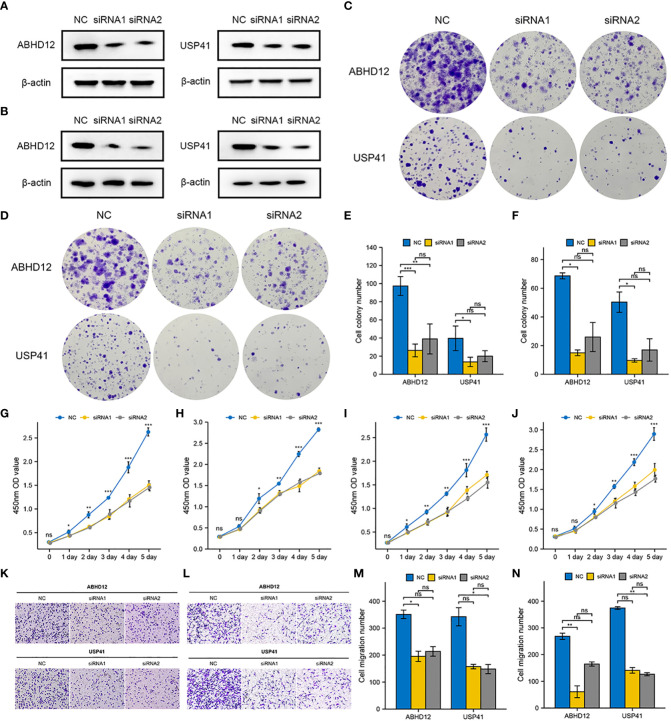
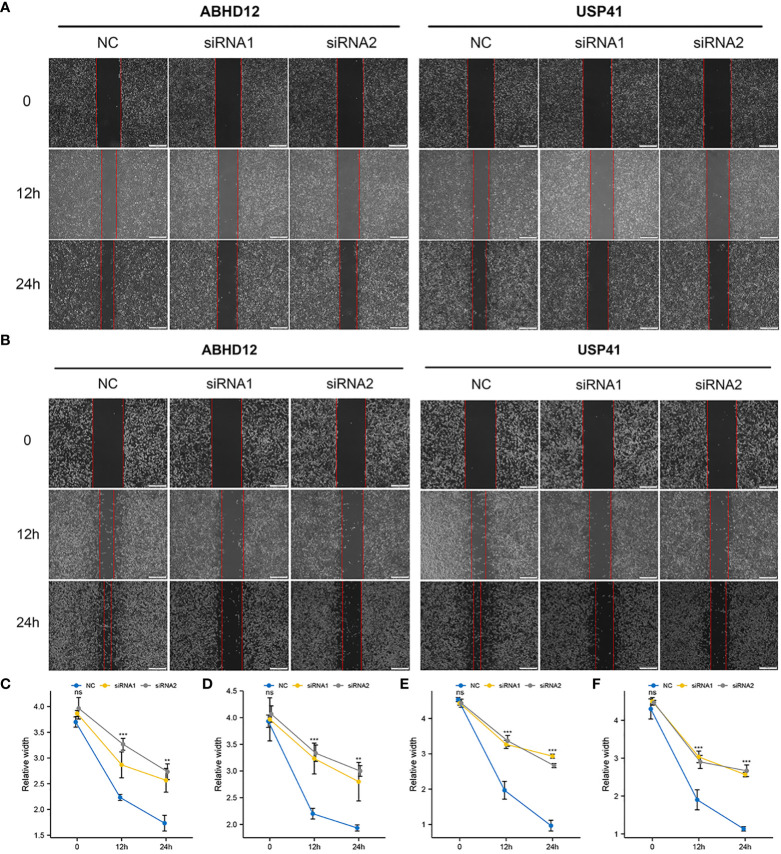
Results: A 10-gene signature was developed and verified as an independent prognostic predictor combined with other clinicopathological parameters in breast cancer. The prognostic nomogram based on risk score (calculated based on the degradome signature) showed favourable capability in survival prediction and advantage in clinical benefit. High risk scores were associated with a higher degree of clinicopathological events (T4 stage and HER2-positive) and mutation frequency. Regulation of toll-like receptors and several cell cycle promoting activities were upregulated in the high-risk group. PIK3CA and TP53 mutations were dominant in the low- and high-risk groups, respectively. A significantly positive correlation was observed between the risk score and tumor mutation burden. The infiltration levels of immune cells and the expressions of immune checkpoints were significantly influenced by the risk score. Additionally, the degradome signature adequately predicted the survival of patients undergoing endocrinotherapy or radiotherapy. Patients in the low-risk group may achieve complete response after the first round of chemotherapy with cyclophosphamide and docetaxel, whereas patients in the high-risk group may benefit from 5-flfluorouracil. Several regulators of the PI3K/AKT/mTOR signaling pathway and the CDK family/PARP family were identified as potential molecular targets in the low- and high-risk groups, respectively. In vitro experiments further revealed that the knockdown of ABHD12 and USP41 significantly inhibit the proliferation, invasion and migration of breast cancer cells.

Conclusion: Multidimensional evaluation verified the clinical utility of the degradome signature in predicting prognosis, risk stratification and guiding treatment for patients with breast cancer.

Keywords: breast cancer; degradome; immune infiltration; immunotherapy; prognostic signature; tumour mutation burden.


Conflict of interest statement

The authors declare that the research was conducted in the absence of any commercial or financial relationships that could be construed as a potential conflict of interest.

Figures

Figure 1
Figure 1
Primary identification and verification of DRGs in BRCA. (A) Intersection of DRGs, DEGs and PRGs. (B) Expression pattern of the 22 DRGs between BRCA and the normal. (C) Correlation among the expression of the 22 DRGs in BRCA. (D) GO/KEGG functional enrichment analyses of the 22 DRGs. ‘***’ indicates P-value < 0.001. "ns" represents non-significant.
Figure 2
Figure 2
Construction of the degradome signature via LASSO regression analysis. (A) Univariate Cox regression analysis. (B) Multivariate Cox regression analysis. (C, D) LASSO regression analysis. (E) K-M curve for comparing OS between the low- and high-risk groups. (F) ROC curves of the degradome signature at 1-, 3- and 5-year. (G) Distribution of risk scores and survival time (days) between the low- and high-risk groups.
Figure 3
Figure 3
Internal and external validation of the degradome signature. (A–C) Internal validation based on TCGA pathological stage III cohort. (D–F) Internal validation based on TCGA ER-positive cohort. (G–I) Internal validation based on TCGA HER2-positive cohort. (J–L) External validation based on GSE96058 dataset.
Figure 4
Figure 4
Distribution of clinicopathological characteristics in the low- and high-risk groups.
Figure 5
Figure 5
Correlation between the degradome signature and clinicopathological characteristics. (A–C) Survival differences in DSS, DFI and PFI between the low- and high-risk groups. (D) Prognostic nomogram based on clinicopathological characteristics and risk score. (E) Calibration curves of the nomogram at 1-, 3- and 5-year. (F) DCA of the nomogram at 1-, 3- and 5-year.
Figure 6
Figure 6
Functional characterization in the two risk groups. (A) DEGs between the low- and high-risk groups. (B) Tissue-specific PPI network of the DEGs. Dots with blue borders represent nDEGs. Dots with a larger size and stronger colour intensity indicate nDEGs that play a more important role in the PPI network. (C) GO/KEGG biological activities that are significantly enriched in the low-risk group. (D–F) GO/KEGG biological activities that are significantly enriched in the high-risk group. (G, H) GSEA in the high-risk group. (I) Identification of DR-nDEGs.
Figure 7
Figure 7
Expression pattern of DRGs between the low- and high-risk groups.
Figure 8
Figure 8
Mutation differences between the low- and high-risk groups. (A) Mutation landscape of the whole TCGA-BRCA cohort. (B) Fraction of genome altered. (C) Gene mutation count. (D) Mutation landscape of the low-risk group. (E) Mutation landscape of the high-risk group. (F, G) Significantly altered genes between the low- and high-risk groups. (H) Genes with significantly different mutation frequencies in the entire genome and degradome in the two risk groups. (I, J) The top 10 genes with significantly different mutation frequencies in the high- and low-risk groups. (K, L) The top 10 DRGs with significantly different mutation frequencies in the high- and low-risk groups.
Figure 9
Figure 9
Mutation differences between the low- and high-risk groups. Differences in (A) fraction of genome altered, (B) gene mutation count, (C) MSIsensor score, (D) MSI MANTIS score and (E) TMB between the two risk groups. Dominant signaling pathways in the (F) high-risk group and (G) low-risk group. (H) Survival analysis between the low- and high-TMB groups. (I) Survival analysis integrating the risk score and TMB. (J) Correlation between the risk score and TMB.
Figure 10
Figure 10
Evaluation of the infiltration levels of immune cells and the expression pattern of immune checkpoints between the low- and high-risk groups. (A) Correlation among the infiltration levels of 22 types of immune cells in BRCA. (B) Infiltration levels of immune cells in each BRCA sample. (C) Correlation between the risk score and infiltration levels of the 22 types of immune cells. (D) Differences in the infiltration levels of the 22 types of immune cells between the two risk groups. (E) Differential expression of 47 immune checkpoints between the low- and high-risk groups. ‘***’ indicates P-value < 0.001. "ns" represents non-significant.
Figure 11
Figure 11
Efficiency of the degradome signature in predicting the prognosis of patients with BRCA undergoing different therapies. Differences in the survival of patients undergoing (A) chemotherapy, (B) endocrinotherapy and (C) radiotherapy between the low- and high-risk groups in TCGA cohort. Differences in the survival of patients undergoing (D) chemotherapy, (E) endocrinotherapy and (F) radiotherapy between the low- and high-risk groups in the METABRIC cohort. (G) Proportion of patients with complete response to the first-round chemotherapy and the corresponding drug agents in the two risk groups. (H) Expression pattern of 21 potential molecular targets between the low- and high-risk groups.
Figure 12
Figure 12
Effects of ABHD12 and USP41 on cell proliferation and migration. (A) Evaluation of silencing of ABHD12 and USP41 via western blotting in MCF-7 cells. (B) Evaluation of silencing of ABHD12 and USP41 via western blotting in MDA-MB-435S cells. (C, E) Colony formation assay in MCF-7 cells. (D, F) Colony formation assay in MDA-MB-435S cells. (G, H) CCK8 assay in MCF-7 cells. (I, J) CCK8 assay in MDA-MB-435S cells. (K, M) Transwell assay in MCF-7 cells. (L, N) Transwell assay in MDA-MB-435S cells. ‘*’ indicates P-value < 0.05; ‘**’ indicates P-value < 0.01; ‘***’ indicates P-value < 0.001. "ns" represents non-significant.
Figure 13
Figure 13
Effects of ABHD12 and USP41 on cell invasion. (A, C, D) Wound healing assay in MCF-7 cells. (B, E, F) Wound healing assay in MDA-MB-435S cells. ‘**’ indicates P-value < 0.01; ‘***’ indicates P-value < 0.001. "ns" represents non-significant.

References

    1. Sung H, Ferlay J, Siegel RL, Laversanne M, Soerjomataram I, Jemal A, et al. . Global cancer statistics 2020: GLOBOCAN estimates of incidence and mortality worldwide for 36 cancers in 185 countries. CA Cancer J Clin (2021) 71(3):209–49. doi: 10.3322/caac.21660 - DOI - PubMed
    1. Xie J, Luo X, Deng X, Tang Y, Tian W, Cheng H, et al. . Advances in artificial intelligence to predict cancer immunotherapy efficacy. Front Immunol (2023) 13:1076883. doi: 10.3389/fimmu.2022.1076883 - DOI - PMC - PubMed
    1. Harbeck N, Penault-Llorca F, Cortes J, Gnant M, Houssami N, Poortmans P, et al. . Breast cancer. Nat Rev Dis Primers (2019) 5(1):66. doi: 10.1038/s41572-019-0111-2 - DOI - PubMed
    1. Li W, Wang H, Dong S, Tang ZR, Chen L, Cai X, et al. . Establishment and validation of a nomogram and web calculator for the risk of new vertebral compression fractures and cement leakage after percutaneous vertebroplasty in patients with osteoporotic vertebral compression fractures. Eur Spine J (2022) 31(5):1108–21. doi: 10.1007/s00586-021-07064-z - DOI - PubMed
    1. Li W, Dong S, Wang B, Wang H, Xu C, Zhang K, et al. . The construction and development of a clinical prediction model to assess lymph node metastases in osteosarcoma. Front Public Health (2022) 9:813625. doi: 10.3389/fpubh.2021.813625 - DOI - PMC - PubMed

Publication types