

Pan-tumor T-lymphocyte detection using deep neural networks: Recommendations for transfer learning in immunohistochemistry
- PMID: 36994311
- PMCID: PMC10040882
- DOI: 10.1016/j.jpi.2023.100301
Pan-tumor T-lymphocyte detection using deep neural networks: Recommendations for transfer learning in immunohistochemistry
Erratum in
-
Erratum Regarding Previously Published Articles.J Pathol Inform. 2024 Mar 30;15:100365. doi: 10.1016/j.jpi.2024.100365. eCollection 2024 Dec. J Pathol Inform. 2024. PMID: 39712975 Free PMC article.
Abstract
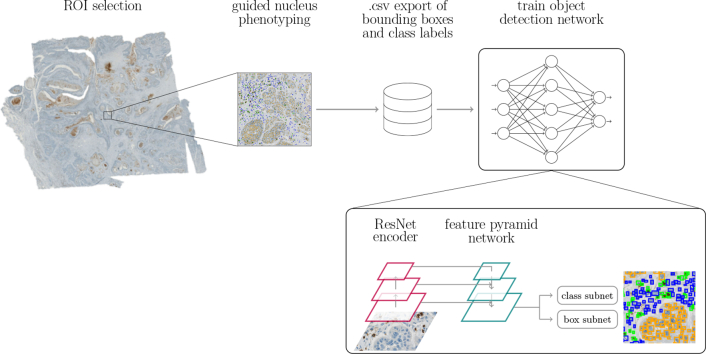
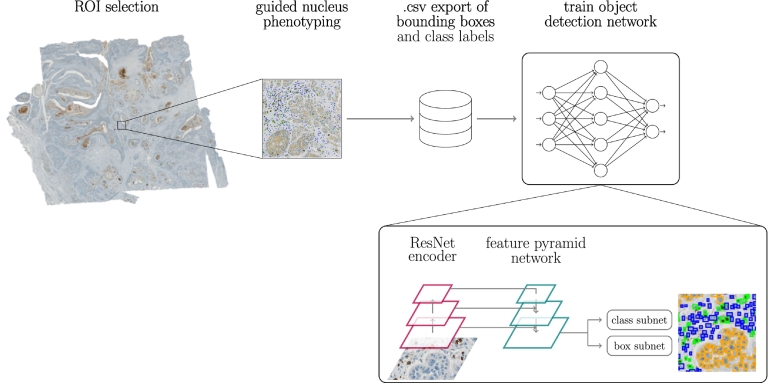
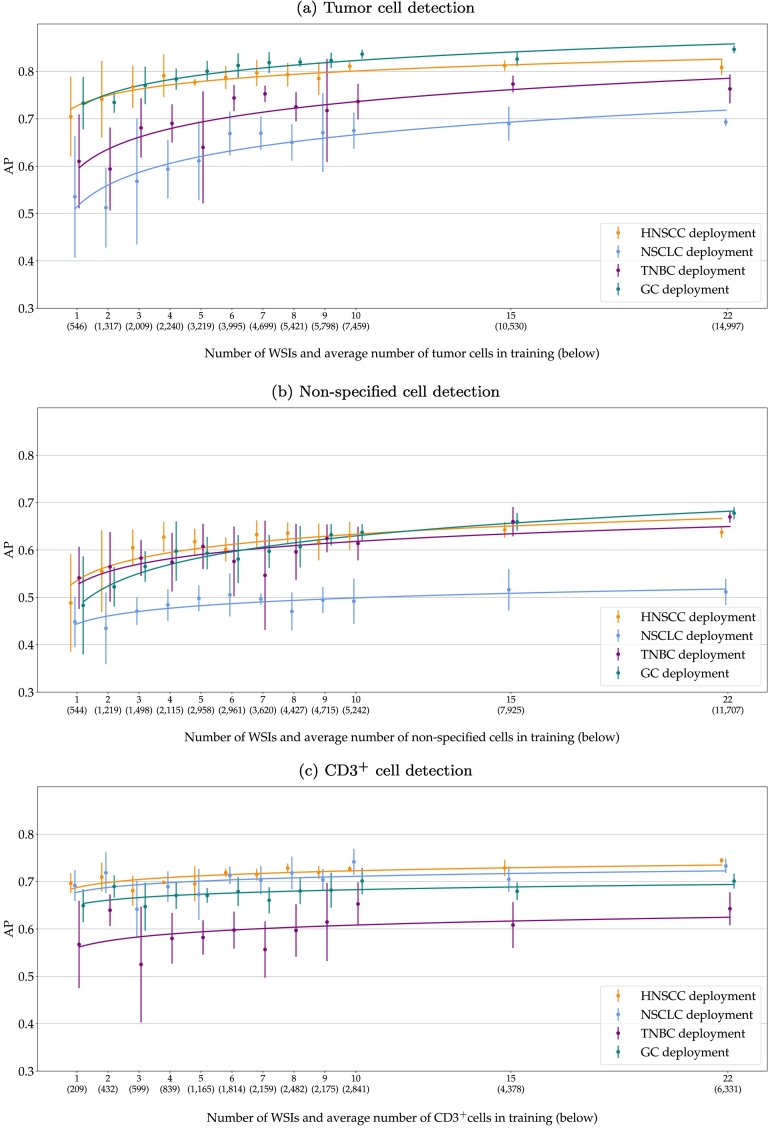
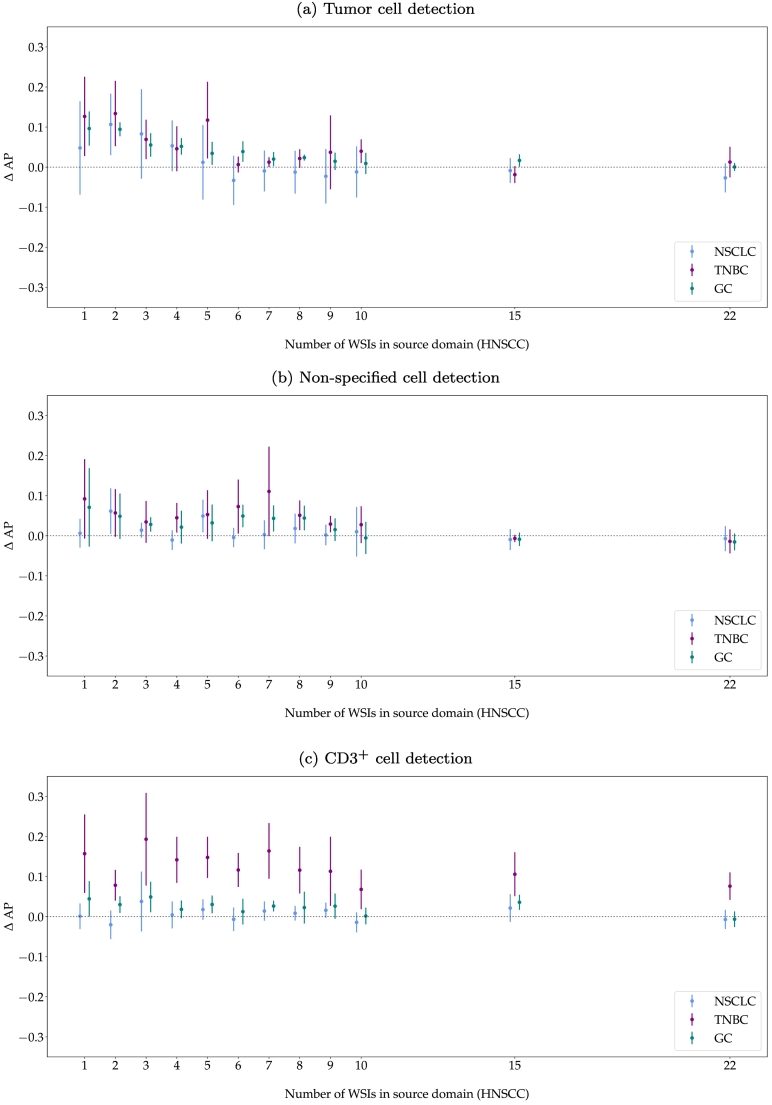
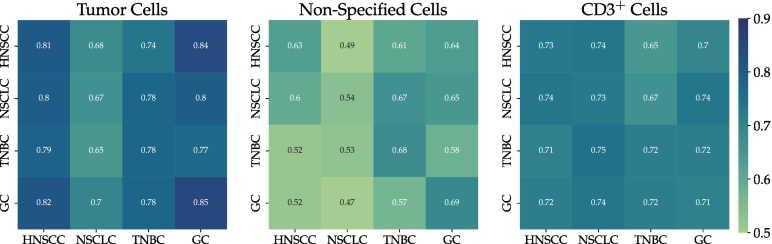
The success of immuno-oncology treatments promises long-term cancer remission for an increasing number of patients. The response to checkpoint inhibitor drugs has shown a correlation with the presence of immune cells in the tumor and tumor microenvironment. An in-depth understanding of the spatial localization of immune cells is therefore critical for understanding the tumor's immune landscape and predicting drug response. Computer-aided systems are well suited for efficiently quantifying immune cells in their spatial context. Conventional image analysis approaches are often based on color features and therefore require a high level of manual interaction. More robust image analysis methods based on deep learning are expected to decrease this reliance on human interaction and improve the reproducibility of immune cell scoring. However, these methods require sufficient training data and previous work has reported low robustness of these algorithms when they are tested on out-of-distribution data from different pathology labs or samples from different organs. In this work, we used a new image analysis pipeline to explicitly evaluate the robustness of marker-labeled lymphocyte quantification algorithms depending on the number of training samples before and after being transferred to a new tumor indication. For these experiments, we adapted the RetinaNet architecture for the task of T-lymphocyte detection and employed transfer learning to bridge the domain gap between tumor indications and reduce the annotation costs for unseen domains. On our test set, we achieved human-level performance for almost all tumor indications with an average precision of 0.74 in-domain and 0.72-0.74 cross-domain. From our results, we derive recommendations for model development regarding annotation extent, training sample selection, and label extraction for the development of robust algorithms for immune cell scoring. By extending the task of marker-labeled lymphocyte quantification to a multi-class detection task, the pre-requisite for subsequent analyses, e.g., distinguishing lymphocytes in the tumor stroma from tumor-infiltrating lymphocytes, is met.
Keywords: Deep learning; Domain adaptation; Immuno-oncology; Immunohistochemistry; Transfer learning; Tumor-infiltrating lymphocytes.
© 2023 The Authors.
Figures
References
-
- Klauschen F., Müller K.-R., Binder A., et al. Semin Cancer Biol. Vol. 52. Elsevier; 2018. Scoring of tumor-infiltrating lymphocytes: from visual estimation to machine learning; pp. 151–157. - PubMed
-
- Ramos-Vara J. Technical aspects of immunohistochemistry. Vet Pathol. 2005;42(4):405–426. - PubMed
-
- Priego-Torres B.M., Lobato-Delgado B., Atienza-Cuevas L., Sanchez-Morillo D. Deep learning-based instance segmentation for the precise automated quantification of digital breast cancer immunohistochemistry images. Expert Syst Appl. 2022;193:116471.
-
- Garcia E., Hermoza R., Castanon C.B., Cano L., Castillo M., Castanneda C. Proc IEEE Int Symp Comput Based Med Syst. IEEE; 2017. Automatic lymphocyte detection on gastric cancer IHC images using deep learning; pp. 200–204.
-
- Chen T., Chefd’hotel C. Mach Learn Med Imaging. Springer; 2014. Deep learning based automatic immune cell detection for immunohistochemistry images; pp. 17–24.
LinkOut - more resources
Full Text Sources
Miscellaneous
