. 2023 May;10(15):e2206669.
doi: 10.1002/advs.202206669. Epub 2023 Mar 30.

Mitochondrial TSPO Promotes Hepatocellular Carcinoma Progression through Ferroptosis Inhibition and Immune Evasion

Affiliations

Mitochondrial TSPO Promotes Hepatocellular Carcinoma Progression through Ferroptosis Inhibition and Immune Evasion

Deguo Zhang et al. Adv Sci (Weinh). 2023 May.

Abstract

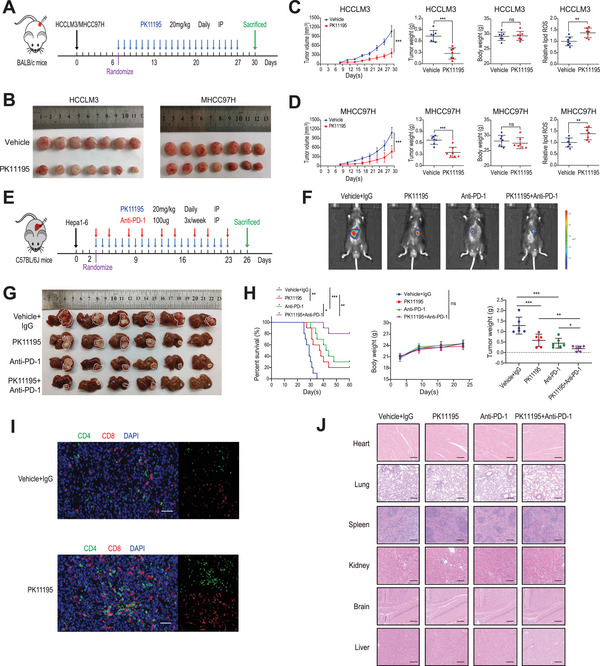
Hepatocellular carcinoma (HCC) is one of the most common malignancies with poor prognosis, and novel treatment strategies are urgently needed. Mitochondria are key regulators of cellular homeostasis and potential targets for tumor therapy. Here, the role of mitochondrial translocator protein (TSPO) in the regulation of ferroptosis and antitumor immunity is investigated and the potential therapeutic implications for HCC are assessed. TSPO is highly expressed in HCC and associated with poor prognosis. Gain- and loss-of-function experiments present that TSPO promotes HCC cell growth, migration, and invasion in vitro and in vivo. In addition, TSPO inhibits ferroptosis in HCC cells via enhancing the Nrf2-dependent antioxidant defense system. Mechanistically, TSPO directly interacts with P62 and interferes with autophagy, leading to the accumulation of P62. The P62 accumulation competes with KEAP1, preventing it from targeting Nrf2 for proteasomal degradation. Furthermore, TSPO promotes HCC immune escape by upregulating PD-L1 expression through Nrf2-mediated transcription. Notably, TSPO inhibitor PK11195 combines with anti-PD-1 antibody showing a synergistic anti-tumor effect in a mouse model. Overall, the results demonstrated that mitochondrial TSPO promotes HCC progression by inhibiting ferroptosis and antitumor immunity. Targeting TSPO can be a promising new strategy for HCC treatment.

Keywords: ferroptosis; hepatocellular carcinoma; immunotherapy; mitochondria; translocator protein.


Conflict of interest statement

The authors declare no conflict of interest.

Figures

Figure 1
Figure 1
TSPO is upregulated and associated with a poor prognosis in HCC. A) TSPO screening process based on the GEO, TCGA, GTEx, and MitoCarta3.0 databases. B) Sorafenib‐resistant HCC cell lines were established by increasing concentrations (IR) or continuously high concentrations (CR) of sorafenib (GSE158458). 422 up‐regulated expressed genes were identified between the four sorafenib‐resistant cell lines and their sorafenib‐responsive ancestors. C) The GEO, TCGA, GTEx and MitoCarta3.0 databases were analyzed by Venn diagram, and 2 candidate mitochondrial genes (TSPO and TMEM65) were finally confirmed. D) TSPO mRNA expression in paired HCC tissues and adjacent non‐tumor tissues evaluated by qRT‐PCR (n = 58). E) TSPO protein expression in paired HCC tissues and adjacent non‐tumor tissues evaluated by Western blot (n = 16). F) H‐score and representative IHC images of TSPO from TMA in normal liver tissues and HCC tissues, which were divided into low and high groups according to the staining intensity. G,H) Kaplan–Meier survival analyses of OS and RFS in different TSPO expression groups (n = 80). I) Basal TSPO expression in 6 HCC cell lines using qRT‐PCR and Western blot. J,K) Validation of TSPO expression after knockdown or overexpression in the indicated cell lines using qRT‐PCR and Western blot. **p < 0.01, ***p < 0.001. The data are expressed as the mean±SD of three independent experiments. T, tumor tissues; P, para‐tumor normal tissues; OS, overall survival; RFS, recurrence free survival.
Figure 2
Figure 2
Knockdown of TSPO inhibits HCC cell proliferation, invasion and metastasis in vitro and in vivo. A,B) The proliferation of HCCLM3 and MHCC97H cells was detected by CCK‐8 and colony formation assays. C,D) The migratory and invasive capabilities of HCCLM3 and MHCC97H cells were evaluated using wound healing and transwell assays. E) The protein levels of EMT markers in HCCLM3 and MHCC97H cells were detected by Western blot. F,G) Representative images of xenograft tumors in nude mice and statistical analyses of tumor volumes, tumor weights, and body weights in the different groups (n = 7). H) Representative images and quantification of metastatic lung nodules in nude mice (red arrows marked, n = 5). **p < 0.01, ***p < 0.001. n.s, not significant. The data are expressed as the mean±SD of three independent experiments.
Figure 3
Figure 3
TSPO inhibits ferroptosis in HCC cells. A) The morphology of mitochondria in HCCLM3 and MHCC97H cells was observed by TEM. Single arrows indicate damaged mitochondria and double arrows indicate autophagosomes. B) The intracellular ROS of HCCLM3 and MHCC97H cells was detected by flow cytometry using DCFH‐DA. C,D) The intracellular and intramitochondrial Fe2+ of HCCLM3 and MHCC97H cells were detected by flow cytometry using FerroOrange and Mito‐FerroGreen, respectively. E) The accumulation of lipid ROS of HCCLM3 and MHCC97H cells was detected by flow cytometry using C11‐BODIPY 581/591. F) The intracellular GSH of HCCLM3 and MHCC97H cells was detected using a GSSG/GSH quantification kit. *p < 0.05, **p < 0.01, ***p < 0.001. The data are expressed as the mean±SD of three independent experiments. TEM, transmission electron microscopy. DCFH‐DA, 20,70‐dichlorodihydrofluorescein diacetate.
Figure 4
Figure 4
TSPO mediates autophagy inhibition and P62 accumulation via interaction with P62. A) IP and silver staining was performed in HCCLM3 and MHCC97H cells with TSPO antibody. B) The TSPO interacting proteins were identified by mass spectrometry. C) Immunofluorescence assay showed the colocalization of TSPO with P62 in HCCLM3 and MHCC97H cells (scale bar, 20 µm). D,E) Co‐IP and GST pull‐down assays to confirm the protein interaction between TSPO and P62 in vivo and in vitro, respectively. F) Co‐IP assays using Flag antibody in HEK293T cells transfected with Flag‐tagged p62 truncated mutants and HA‐TSPO. G) The protein levels of autophagy markers (p62 and LC3B) in HCCLM3 and MHCC97H cells were detected by Western blot. H) Autophagy flux was monitored by mRFP‐GFP‐LC3B adenovirus infection. Representative images show autophagosomes (yellow dots) and autolysosomes (red dots; scale bar, 20 µm). I) The addition of CQ inhibited autophagy caused by TSPO knockdown. **p < 0.01. The data are expressed as the mean±SD of three independent experiments. IP, immunoprecipitation. Co‐IP, co‐immunoprecipitation. GST, glutathione‐S‐transferase. CQ, chloroquine.
Figure 5
Figure 5
TSPO inhibits ferroptosis through P62/KEAP1/Nrf2 antioxidant pathway. A) HCCLM3 cells with stable TSPO knockdown and overexpression were treated with 100 µg mL−1 cycloheximide (CHX) for the indicated times, then lysed and subjected to immunoblotting. B) Cells were transfected with HA‐Ub plasmid and treated with MG132 (10 µm) for 10 h. The ubiquitination levels of Nrf2 were detected by western blot analysis. C) Co‐IP assays were performed to detect the interaction between P62 and KEAP1 when TSPO was knockdown. D) Co‐IP assays were performed to detect the interaction between KEAP1 and Nrf2 when TSPO was knockdown. E) P62 was overexpressed in TSPO knockdown cells, and then Nrf2 expression was examined by Western blot. F,G) Representative images of IHC staining of TSPO, P62, KEAP1, and Nrf2 in TMA samples and subcutaneous xenografts tumor tissues. H) The protein levels of downstream antioxidant genes regulated by Nrf2 in HCCLM3 and MHCC97H cells were detected by Western blot.
Figure 6
Figure 6
TSPO promotes tumor immune escape by upregulating PD‐L1 expression through Nrf2‐mediated transcription. A,B) Representative images of orthotopic liver cancer in C57/BL6 mice and statistical analyses of tumor infiltrated lymphocytes (total T cells, CD4+T cells, CD8+T cells, and functional state of CD8+T cells) by flow cytometric (n = 5). C) Immunofluorescence staining of tissue sections showed the tumor infiltrated lymphocytes (CD4+T cells and CD8+T cells; scale bar, 50 µm). D,E) The protein levels of PD‐L1 in HCCLM3, MHCC97H, and Hepa1‐6 cells were detected by Western blot and flow cytometric. F) The predicted binding site of Nrf2 in the PD‐L1 promoter region according to the Jaspar database. G,H) Dual luciferase reporter and ChIP assays were performed to analyze the direct interaction between Nrf2 and PD‐L1. I–K) The mRNA and protein expression of PD‐L1 was regulated by Nrf2 knockdown or overexpression. L,M) Representative images of IHC staining with TSPO, Nrf2, and PD‐L1 antibodies in orthotopic liver cancer tissues and TMA. N) Western blot analysis demonstrated that the reduction in PD‐L1 expression induced by TSPO knockdown was abolished by Nrf2 overexpression. *p < 0.05, **p < 0.01, ***p < 0.001. The data are expressed as the mean±SD of three independent experiments. TIL, tumor‐infiltrating lymphocyte. ChIP, chromatin immunoprecipitation.
Figure 7
Figure 7
TSPO inhibitor promotes ferroptosis and improves anti‐PD‐1 efficacy in a mouse model. A) Timetable of construction of subcutaneous xenograft tumor model in nude mice and PK11195 treatment strategy. B–D) Representative images of xenograft tumors in nude mice and statistical analyses of tumor volumes, tumor weights, body weights, and lipid ROS levels (n = 7). E) Timetable of construction of orthotopic HCC model in C57/BL6 mice and PK11195 and anti‐PD‐1 antibody treatment strategy. F) Representative bioluminescence images of C57/BL6 mice with orthotopic tumor after 21 days of treatment (n = 6). G,H) Representative images of orthotopic HCC in C57/BL6 mice and statistical analyses of survival time, tumor weights, and body weights. I) Immunofluorescence staining of tissue sections showed the tumor infiltrated lymphocytes (CD4+T cells and CD8+T cells; scale bar, 50 µm). J) Representative images of HE‐stained tissue specimens (heart, lung, spleen, kidney, brain, and liver). *p < 0.05, **p < 0.01, ***p < 0.001. IP, intraperitoneal injection.
Figure 8
Figure 8
A model illustrating the role of TSPO in regulating ferroptosis and antitumor immunity in HCC cells. TSPO interacts with p62 and stabilizes Nrf2 protein in HCC cells, which promotes the expression of antioxidant genes and PD‐L1, leading to ferroptosis inhibition and immune escape (up). However, inhibition of TSPO by PK11195 promotes the ubiquitination and proteasomal degradation of Nrf2, thereby promoting ferroptosis, sensitizing to anti‐PD‐1 immunotherapy and enhancing CD8+T cells‐mediated cell killing (down).

References

    1. Sung H., Ferlay J., Siegel R. L., Laversanne M., Soerjomataram I., Jemal A., Bray F., Ca‐Cancer J. Clin. 2021, 71, 209. - PubMed
    1. Llovet J. M., Ricci S., Mazzaferro V., Hilgard P., Gane E., Blanc J. F., de Oliveira A. C., Santoro A., Raoul J. L., Forner A., Schwartz M., Porta C., Zeuzem S., Bolondi L., Greten T. F., Galle P. R., Seitz J. F., Borbath I., Haussinger D., Giannaris T., Shan M., Moscovici M., Voliotis D., Bruix J., SHARP Investigators Study Group , N. Engl. J. Med.. 2008, 359, 378. - PubMed
    1. Kudo M., Finn R. S., Qin S., Han K. H., Ikeda K., Piscaglia F., Baron A., Park J. W., Han G., Jassem J., Blanc J. F., Vogel A., Komov D., Evans T. R. J., Lopez C., Dutcus C., Guo M., Saito K., Kraljevic S., Tamai T., Ren M., Cheng A. L., Lancet 2018, 391, 1163. - PubMed
    1. Ribas A., Wolchok J. D., Science. 2018, 359, 1350. - PMC - PubMed
    1. El‐Khoueiry A. B., Sangro B., Yau T., Crocenzi T. S., Kudo M., Hsu C., Kim T. Y., Choo S. P., Trojan J., Welling T. H. R. 3rd, Meyer T., Kang Y. K., Yeo W., Chopra A., Anderson J., dela Cruz C., Lang L., Neely J., Tang H., Dastani H. B., Melero I., Lancet. 2017, 389, 2492. - PMC - PubMed

Publication types