. 2023 Jul 25;7(14):3695-3709.
doi: 10.1182/bloodadvances.2022009415.

Unraveling the genetics of transformed splenic marginal zone lymphoma

Affiliations

Unraveling the genetics of transformed splenic marginal zone lymphoma

Marta Grau et al. Blood Adv. .

Abstract

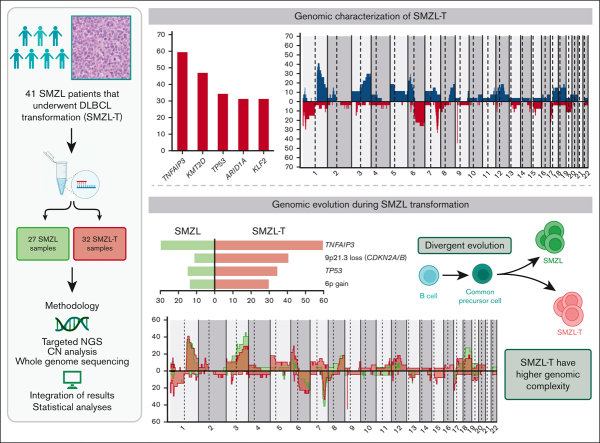
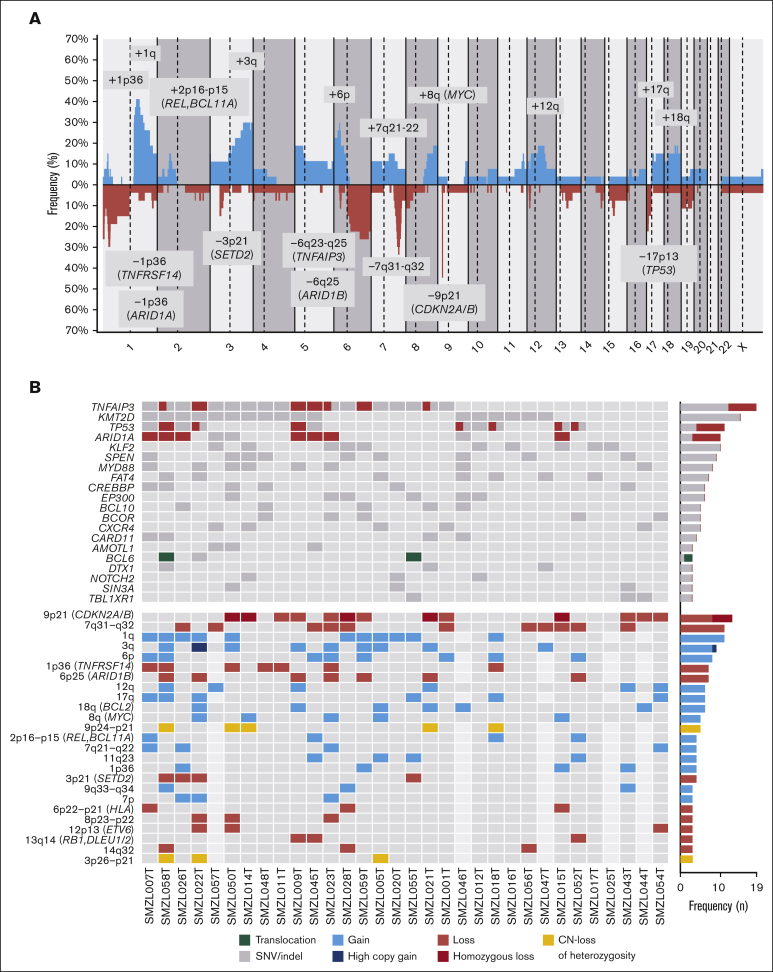
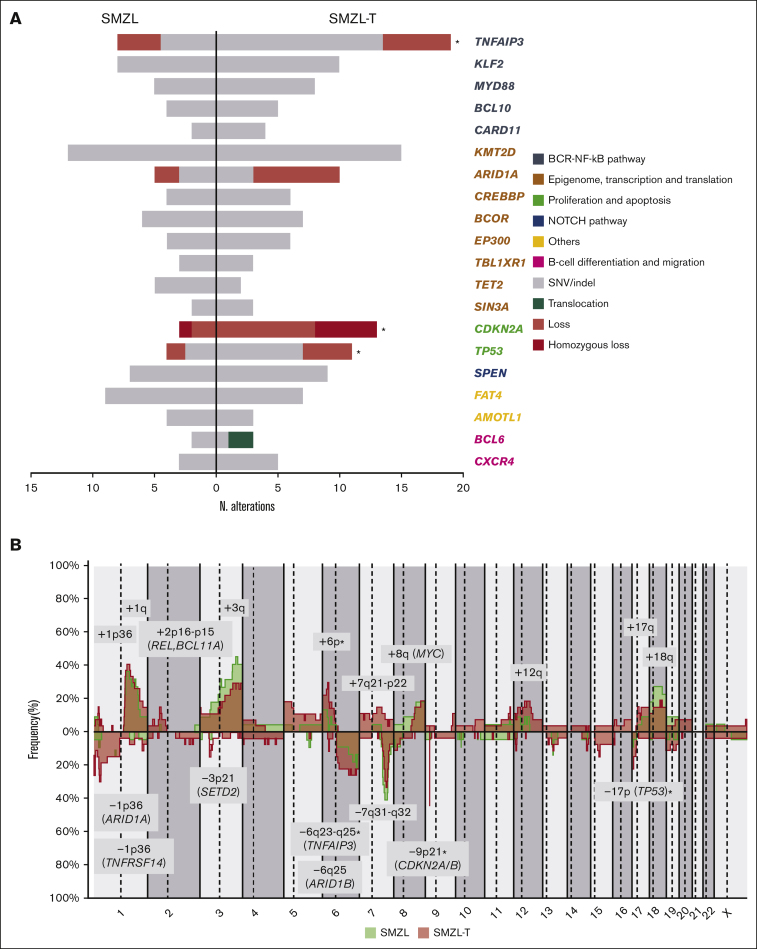
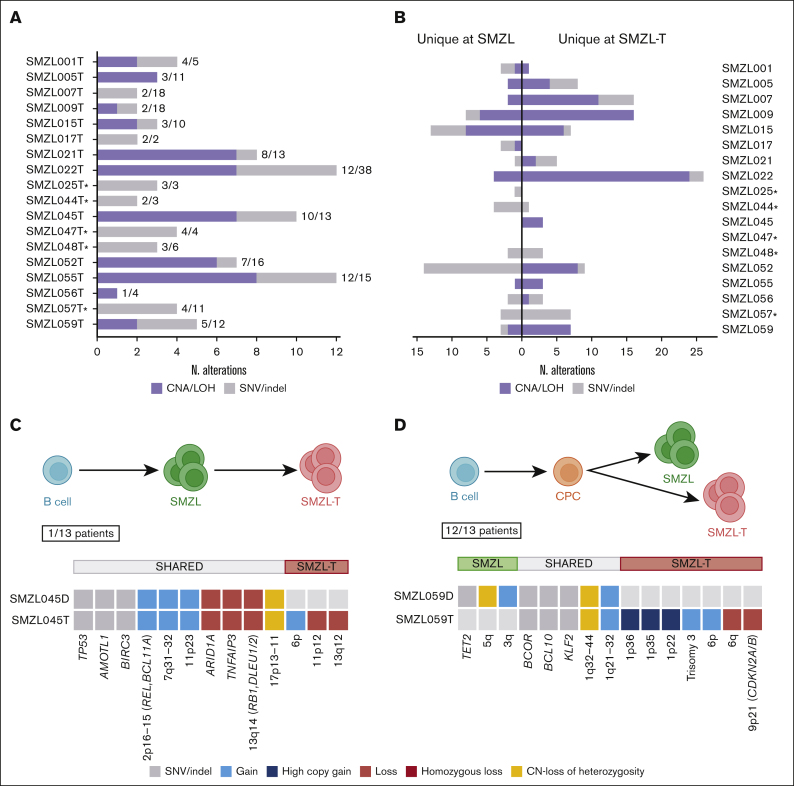
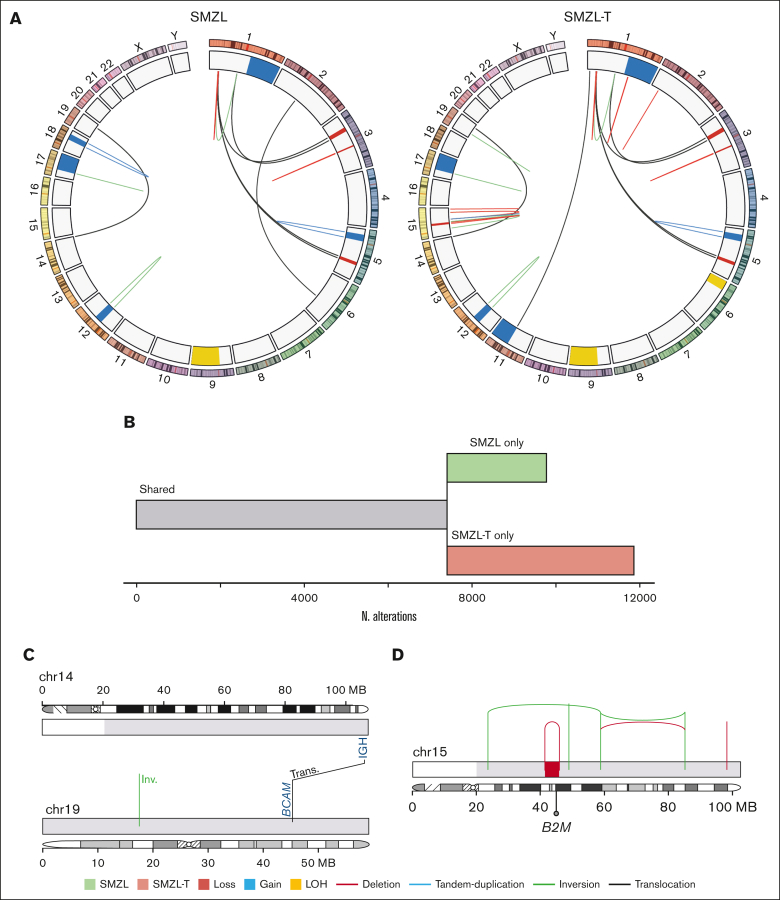
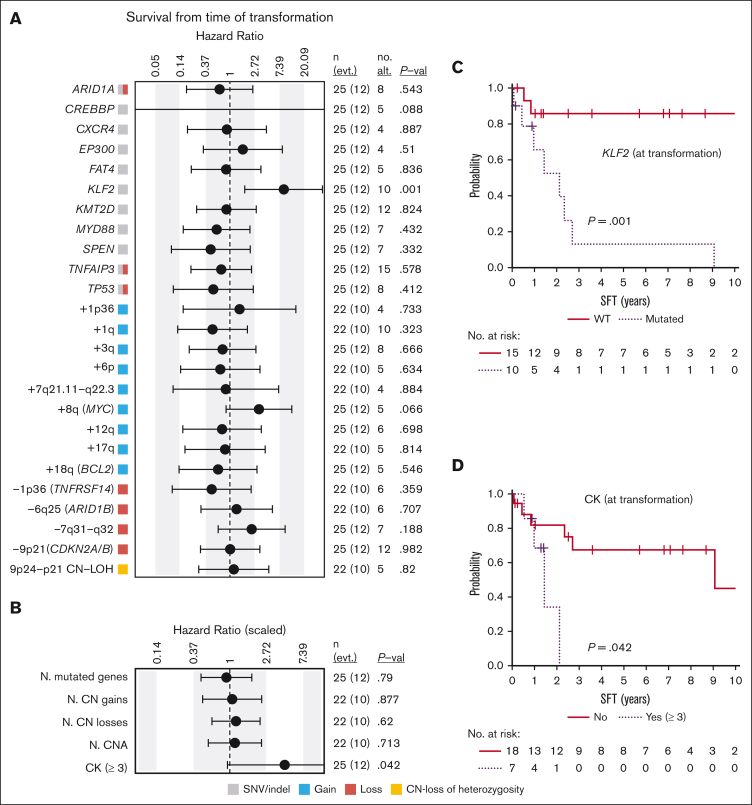
The genetic mechanisms associated with splenic marginal zone lymphoma (SMZL) transformation are not well defined. We studied 41 patients with SMZL that eventually underwent large B-cell lymphoma transformation. Tumor material was obtained either only at diagnosis (9 patients), at diagnosis and transformation (18 patients), and only at transformation (14 patients). Samples were categorized in 2 groups: (1) at diagnosis (SMZL, n = 27 samples), and (2) at transformation (SMZL-T, n = 32 samples). Using copy number arrays and a next-generation sequencing custom panel, we identified that the main genomic alterations in SMZL-T involved TNFAIP3, KMT2D, TP53, ARID1A, KLF2, 1q gains, and losses of 9p21.3 (CDKN2A/B) and 7q31-q32. Compared with SMZL, SMZL-T had higher genomic complexity, and higher incidence of TNFAIP3 and TP53 alterations, 9p21.3 (CDKN2A/B) losses, and 6p gains. SMZL and SMZL-T clones arose by divergent evolution from a common altered precursor cell that acquired different genetic alterations in virtually all evaluable cases (92%, 12 of 13 cases). Using whole-genome sequencing of diagnostic and transformation samples in 1 patient, we observed that the SMZL-T sample carried more genomic aberrations than the diagnostic sample, identified a translocation t(14;19)(q32;q13) present in both samples, and detected a focal B2M deletion due to chromothripsis acquired at transformation. Survival analysis showed that KLF2 mutations, complex karyotype, and International Prognostic Index score at transformation were predictive of a shorter survival from transformation (P = .001; P = .042; and P = .007; respectively). In summary, SMZL-T are characterized by higher genomic complexity than SMZL, and characteristic genomic alterations that could represent key players in the transformation event.


Conflict of interest statement

Conflict-of-interest disclosure: F.N. has received honoraria from Janssen and AbbVie for speaking at educational activities. M.J.B. is currently an employee of Swedish Orphan Biovitrum. E.C. has been a consultant for Takeda, NanoString, AbbVie, and Illumina; has received research support from AstraZeneca; received honoraria from Janssen, EUSPharma, and Roche for speaking at educational activities; and is an inventor on a Lymphoma and Leukemia Molecular Profiling Project patent ‘Method for subtyping lymphoma subtypes by means of expression profiling’ (PCT/US2014/64161). A.L.-G. served on the advisory board of Roche, Celgene, Novartis, and Gilead/Kite, and received grants from Celgene and Gilead/Kite. The remaining authors declare no competing financial interests.

The current affiliation for M.J.B. is Swedish Orphan Biovitrum, Portugal.

Figures

None
Graphical abstract
Figure 1.
Figure 1.
Morphological and immunohistochemical features of SMZL-T. (A) Case SMZL058T showing a lymph node with a diffuse proliferation composed of large lymphocytes with a centroblastic appearance (hematoxylin and eosin stain, original magnification ×20). (B-C) Detail of case SMZL07T showing the interphase between a transformed area (left) and an area with remnant marginal splenic B-cell lymphoma (right). In panel B, hematoxylin and eosin stain (original magnification ×20); and in panel C, immunohistochemical staining for Ki67 showing the different proliferative index between both areas (original magnification ×20). (D-G). Case SMZL012T showing the spleen infiltrated by a lymphoid proliferation arranged in a nodular growth pattern, original magnification ×4 (D), constituted of large, atypical cells (inset, original magnification ×40). (E) These cells were positive for CD20 (original magnification ×2; inset, original magnification ×20), (F) had Kappa light chain restriction (original magnification ×40), and (G) were negative for Lambda light chain (original magnification ×40).
Figure 2.
Figure 2.
Genetic landscape of SMZL-T. (A) CN profile of 27 cases of SMZL-T. On the x-axis, the chromosomes are represented horizontally from 1 to X (chromosome Y is excluded); on the y-axis, the percentages of patients with CNAs are shown, with gains depicted in blue and losses in red. Regions with an incidence of ≥4 cases and potential target genes are indicated. (B) Oncoprint displaying the recurrent alterations (n ≥ 3) found in 32 SMZL-T cases. Each column corresponds to an individual SMZL-T sample. All alterations are displayed by decreasing frequency. In the upper panel, SNVs and indels are shown in gray, deletions in red, and BCL6 translocation in green. In the lower panel, gains (blue), losses (red), and CN-LOH (yellow) of large and focal regions (potential target genes are indicated) are shown.
Figure 3.
Figure 3.
Genomic evolution patterns in SMZL-T. (A) Comparison of frequently altered genes in SMZL (left) and SMZL-T (right). Genes are clustered by pathways (in different colors). Only genes with at least 3 alterations in 1 of the groups are depicted. Asterisks indicate the alterations significantly enriched in 1 of the groups. (B) Comparison of CN profiles of 22 patients with SMZL at diagnosis (green) and 27 patients with SMZL-T at transformation (pink). CN gains are depicted in the upper part of plot, and losses at the bottom. CN regions with recurrence of n ≥ 4 are represented.
Figure 4.
Figure 4.
Different evolution patterns in SMZL-T. Total number of shared and unique alterations identified in patients with paired diagnostic/transformed samples. (A) Bar plot showing the overall shared aberrations in each case between diagnosis and transformed samples. (B) Unique genomic aberrations identified in each case, at diagnosis (left) and at transformation (right). SNVs, indels, gains, losses, and CN-LOH were considered. The asterisks indicate the cases with no CN array data. Models of divergent (C) and linear (D) evolution patterns during SMZL transformation. Upper panels: simplified models; lower panels: an example of each type, case SMZL059 as an example for divergent evolution (C) and case SMZL045, the only case with linear evolution (D). Green and pink cell aggregates depict the SMZL and SMZL-T clones, respectively, common mutated precursor cell (CPC) in orange, and normal B cell is represented in blue.
Figure 5.
Figure 5.
Whole genome landscape of SMZL055 at diagnosis and transformation. (A) Circos plots displaying structural variants and CNAs at diagnosis (left) and transformation (right). (B) Representation of the number of mutations shared by (gray), or specific to, the SMZL (green) and SMZL-T (pink) samples. (C) Representation of the reciprocal translocation t(14;19)(q32;q13). (D) Chromosome 15 of the transformation sample with a chromothripsis pattern inactivating B2M gene, acquired at transformation.
Figure 6.
Figure 6.
Survival from time of transformation. (A) Impact of genetic alterations or (B) the cumulative number of (N.) of genetic changes present at transformation on SFT. The impact is quantified with the hazard ratio and its 95% confidence interval. Continuous variables were scaled. The gray, red, blue, and yellow boxes indicate the type of genetic alterations found in each alteration (SNVs/indel, loss, gain, and CN-LOH, respectively). The right columns show: the number of cases (n) and events (evt.), the number of altered cases (no. alt.), and the P value (P-val) of the log-rank test (for dichotomous variables) or of the Cox regression (for continuous variables). Only alterations with at least 4 altered cases at transformation are shown. Complex karyotype (CK) is dichotomized and defined by the presence of 3 or more aberrations. (C-D) Kaplan-Meier curves of SFT based on (C) the presence of KLF2 mutations or (D) complex karyotype at transformation.

References

    1. Swerdlow SH, Campo E, Harris NL, et al., editors. WHO Classification of Tumours of Haematopoietic and Lymphoid Tissues. Revised. 4th ed. IARC; Lyon, France: 2017.
    1. Campo E, Jaffe ES, Cook JR, et al. The international consensus classification of mature lymphoid neoplasms: a report from the clinical advisory committee. Blood. 2022;140(11):1229–1253. - PMC - PubMed
    1. Alaggio R, Amador C, Anagnostopoulos I, et al. The 5th edition of the World Health Organization Classification of Haematolymphoid Tumours: Lymphoid Neoplasms. Leukemia. 2022;36(7):1720–1748. - PMC - PubMed
    1. Salido M, Baró C, Oscier D, et al. Cytogenetic aberrations and their prognostic value in a series of 330 splenic marginal zone B-cell lymphomas: a multicenter study of the Splenic B-Cell Lymphoma Group. Blood. 2010;116(9):1479–1488. - PubMed
    1. Jaramillo Oquendo C, Parker H, Oscier D, et al. The (epi)genomic landscape of splenic marginal zone lymphoma, biological implications, clinical utility, and future questions. J Transl Genet Genom. 2021;5(2):89–111.

Publication types

MeSH terms