

Erythroferrone exacerbates iron overload and ineffective extramedullary erythropoiesis in a mouse model of β-thalassemia
- PMID: 36995275
- PMCID: PMC10345853
- DOI: 10.1182/bloodadvances.2022009307
Erythroferrone exacerbates iron overload and ineffective extramedullary erythropoiesis in a mouse model of β-thalassemia
Abstract
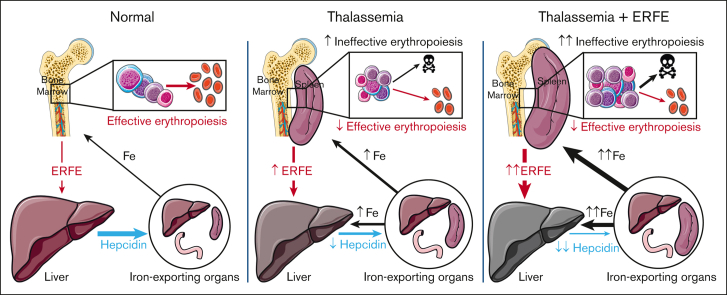
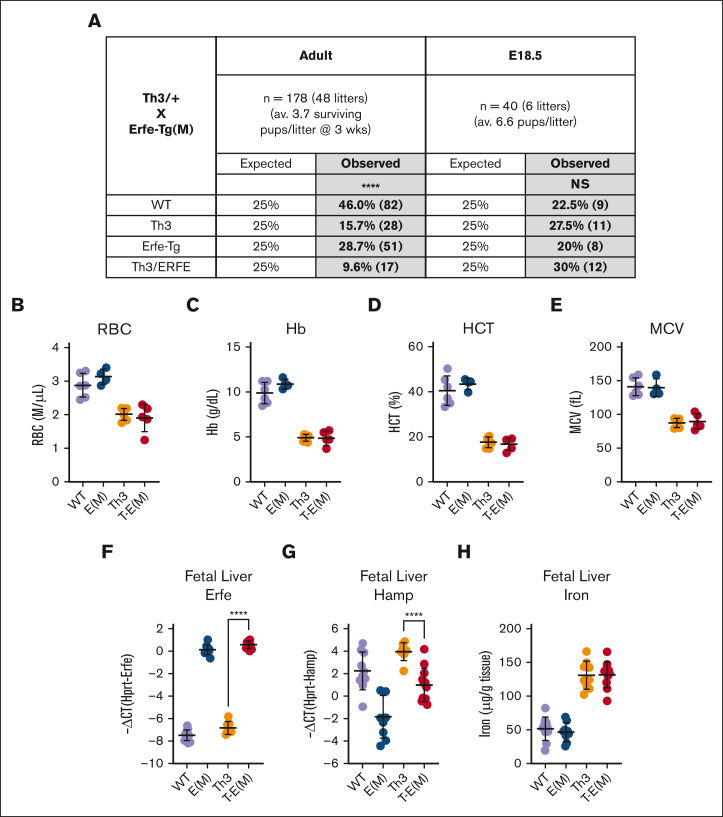
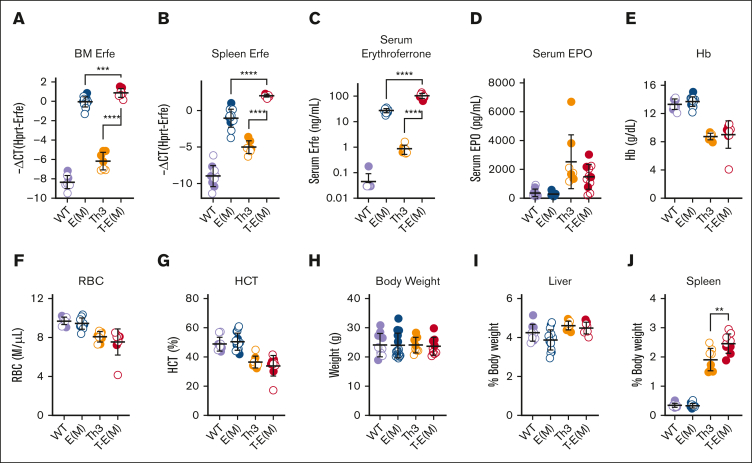
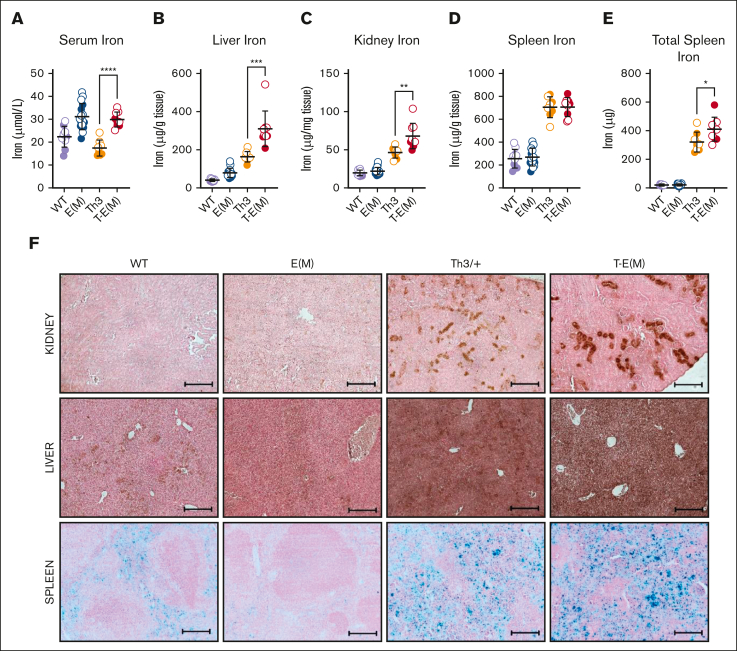
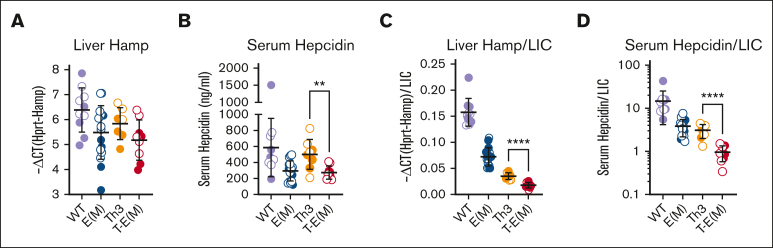
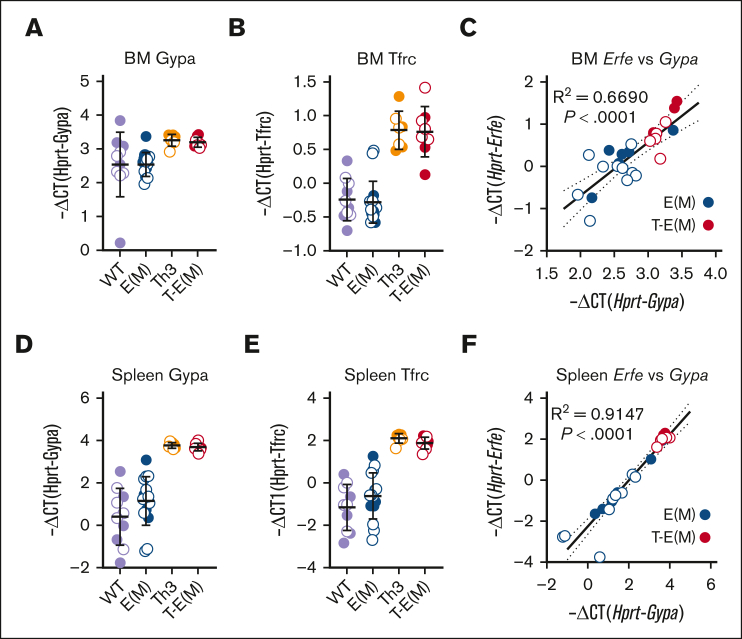
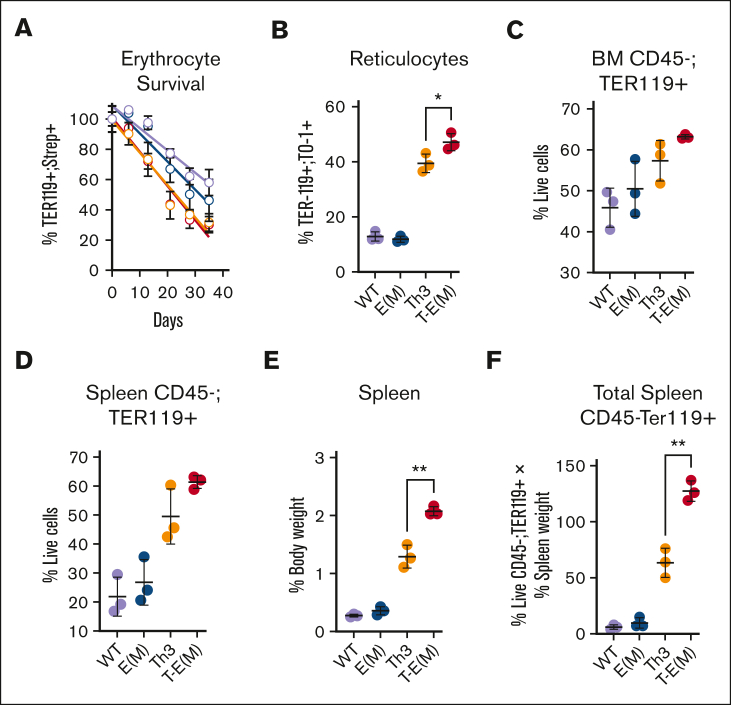
β-thalassemia is characterized by chronic hepcidin suppression and iron overload, even in patients who have not undergone transfusion. The HbbTh3/+ (Th3/+) mouse model of nontransfusion-dependent β-thalassemia (NTDBT) partially recapitulates the human phenotype but lacks chronic hepcidin suppression, progressive iron accumulation into adulthood, or the interindividual variation of the rate of iron loading observed in patients. Erythroferrone (ERFE) is an erythroid regulator that suppresses hepcidin during increased erythropoiesis. ERFE concentrations in the sera of patients with NTDBT correlate negatively with hepcidin levels but vary over a broad range, possibly explaining the variability of iron overload in patients. To analyze the effect of high ERFE concentrations on hepcidin and iron overload in NTDBT, we crossed Th3/+ mice with erythroid ERFE-overexpressing transgenic mice. Th3/ERFE-transgenic mice suffered high perinatal mortality, but embryos at E18.5 showed similar viability, appearance, and anemia effects as Th3/+ mice. Compared with Th3/+ littermates, adult Th3/ERFE mice had similarly severe anemia but manifested greater suppression of serum hepcidin and increased iron accumulation in the liver, kidney, and spleen. The Th3/ERFE mice had much higher concentrations of serum ERFE than either parental strain, a finding attributable to both a higher number of erythroblasts and higher production of ERFE by each erythroblast.Th3/+ and Th3/ERFE mice had similar red blood cell count and shortened erythrocyte lifespan, but Th3/ERFE mice had an increased number of erythroid precursors in their larger spleens, indicative of aggravated ineffective extramedullary erythropoiesis. Thus, high ERFE concentrations increase the severity of nontransfusional iron overload and ineffective erythropoiesis in thalassemic mice but do not substantially affect anemia or hemolysis.
© 2023 by The American Society of Hematology. Licensed under Creative Commons Attribution-NonCommercial-NoDerivatives 4.0 International (CC BY-NC-ND 4.0), permitting only noncommercial, nonderivative use with attribution. All other rights reserved.
Conflict of interest statement
Conflict-of-interest disclosure: T.G. and E.N. are shareholders in Intrinsic LifeSciences and Silarus Therapeutics and have received consulting fees from Disc Medicine, FibroGen, AstraZeneca, Ionis Pharmaceuticals, and Rallybio. T.G. has also received consulting fees from Alnylam Pharmaceuticals, Akebia Therapeutics, Global Blood Therapeutics, Gossamer Bio, Pharmacosmos, Sierra Oncology, and Silence Therapeutics. E.N. received consulting fees from GSK, Novo Nordisk, Protagonist, and Shield Therapeutics. The remaining authors declare no competing financial interests.
Figures
Similar articles
-
Erythroferrone contributes to hepcidin suppression and iron overload in a mouse model of β-thalassemia.Blood. 2015 Oct 22;126(17):2031-7. doi: 10.1182/blood-2015-07-658419. Epub 2015 Aug 14. Blood. 2015. PMID: 26276665 Free PMC article.
-
The hepcidin regulator erythroferrone is a new member of the erythropoiesis-iron-bone circuitry.Elife. 2021 May 18;10:e68217. doi: 10.7554/eLife.68217. Elife. 2021. PMID: 34002695 Free PMC article.
-
Antibodies against the erythroferrone N-terminal domain prevent hepcidin suppression and ameliorate murine thalassemia.Blood. 2020 Feb 20;135(8):547-557. doi: 10.1182/blood.2019003140. Blood. 2020. PMID: 31899794 Free PMC article.
-
Erythroferrone structure, function, and physiology: Iron homeostasis and beyond.J Cell Physiol. 2021 Jul;236(7):4888-4901. doi: 10.1002/jcp.30247. Epub 2020 Dec 28. J Cell Physiol. 2021. PMID: 33372284 Free PMC article. Review.
-
Erythropoietic regulators of iron metabolism.Free Radic Biol Med. 2019 Mar;133:69-74. doi: 10.1016/j.freeradbiomed.2018.07.003. Epub 2018 Jul 5. Free Radic Biol Med. 2019. PMID: 29981834 Free PMC article. Review.
Cited by
-
Mitoxantrone ameliorates ineffective erythropoiesis in a β-thalassemia intermedia mouse model.Blood Adv. 2024 Aug 13;8(15):4017-4024. doi: 10.1182/bloodadvances.2024012679. Blood Adv. 2024. PMID: 38861356 Free PMC article.
-
Genes Selectively Expressed in Rat Organs.Curr Genomics. 2024;25(4):261-297. doi: 10.2174/0113892029273121240401060228. Epub 2024 Apr 8. Curr Genomics. 2024. PMID: 39156728 Free PMC article.
-
In vivo silencing of intestinal DMT1 mitigates iron loading in β-thalassemia intermedia (Hbbth3/+) mice.Blood Adv. 2024 Nov 26;8(22):5753-5765. doi: 10.1182/bloodadvances.2024013333. Blood Adv. 2024. PMID: 39250719 Free PMC article.
-
Systemic Iron Metabolism.Adv Exp Med Biol. 2025;1480:33-45. doi: 10.1007/978-3-031-92033-2_3. Adv Exp Med Biol. 2025. PMID: 40603782 Review.
-
Integrated metabolomic and microbiome analysis identifies Cupriavidus metallidurans as a potential therapeutic target for β-thalassemia.Ann Hematol. 2024 Dec;103(12):5169-5179. doi: 10.1007/s00277-024-06016-z. Epub 2024 Oct 1. Ann Hematol. 2024. PMID: 39349606
References
-
- Taher AT, Musallam KM, Cappellini MD, Weatherall DJ. Optimal management of beta thalassaemia intermedia. Br J Haematol. 2011;152(5):512–523. - PubMed
-
- Kearney SL, Nemeth E, Neufeld EJ, et al. Urinary hepcidin in congenital chronic anemias. Pediatr Blood Cancer. 2007;48(1):57–63. - PubMed
-
- Origa R, Galanello R, Ganz T, et al. Liver iron concentrations and urinary hepcidin in beta-thalassemia. Haematologica. 2007;92(5):583–588. - PubMed
