

Asymmetries in the discrimination of motion direction around the visual field
- PMID: 36995280
- PMCID: PMC10068874
- DOI: 10.1167/jov.23.3.19
Asymmetries in the discrimination of motion direction around the visual field
Abstract
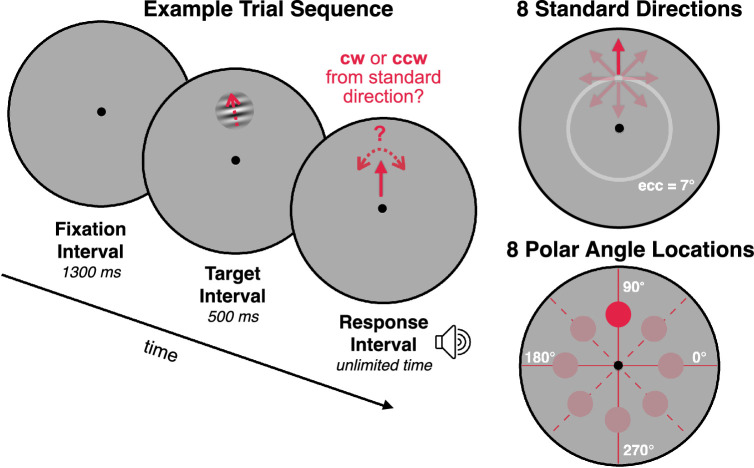
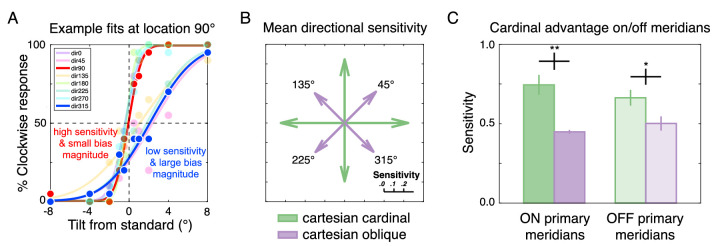
The discriminability of motion direction is asymmetric, with some motion directions that are better discriminated than others. For example, discrimination of directions near the cardinal axes (upward/downward/leftward/rightward) tends to be better than oblique directions. Here, we tested discriminability for multiple motion directions at multiple polar angle locations. We found three systematic asymmetries. First, we found a large cardinal advantage in a cartesian reference frame - better discriminability for motion near cardinal reference directions than oblique directions. Second, we found a moderate cardinal advantage in a polar reference frame - better discriminability for motion near radial (inward/outward) and tangential (clockwise/counterclockwise) reference directions than other directions. Third, we found a small advantage for discriminating motion near radial compared to tangential reference directions. The three advantages combine in an approximately linear manner, and together predict variation in motion discrimination as a function of both motion direction and location around the visual field. For example, best performance is found for radial motion on the horizontal and vertical meridians, as these directions encompass all three advantages, whereas poorest performance is found for oblique motion stimuli located on the horizontal and vertical meridians, as these directions encompass all three disadvantages. Our results constrain models of motion perception and suggest that reference frames at multiple stages of the visual processing hierarchy limit performance.
Figures


Similar articles
-
An advantage for horizontal motion direction discrimination.Vision Res. 2019 May;158:164-172. doi: 10.1016/j.visres.2019.03.005. Epub 2019 Mar 20. Vision Res. 2019. PMID: 30878277
-
Opposite asymmetry in visual perception of humans and macaques.Curr Biol. 2025 Feb 3;35(3):681-687.e4. doi: 10.1016/j.cub.2024.12.024. Epub 2025 Jan 14. Curr Biol. 2025. PMID: 39814028
-
Anisotropies in visual motion perception: a fresh look.J Opt Soc Am A Opt Image Sci Vis. 1998 Aug;15(8):2003-11. doi: 10.1364/josaa.15.002003. J Opt Soc Am A Opt Image Sci Vis. 1998. PMID: 9691484
-
Visual and vestibular cue integration for heading perception in extrastriate visual cortex.J Physiol. 2011 Feb 15;589(Pt 4):825-33. doi: 10.1113/jphysiol.2010.194720. Epub 2010 Aug 2. J Physiol. 2011. PMID: 20679353 Free PMC article. Review.
-
Visual processing of the motion of an object in three dimensions for a stationary or a moving observer.Perception. 1995;24(1):87-103. doi: 10.1068/p240087. Perception. 1995. PMID: 7617421 Review.
Cited by
-
Effort drives saccade selection.Elife. 2025 Apr 7;13:RP97760. doi: 10.7554/eLife.97760. Elife. 2025. PMID: 40193176 Free PMC article.
-
Impaired visual perceptual accuracy in the upper visual field induces asymmetric performance in position estimation for falling and rising objects.J Vis. 2025 Jan 2;25(1):1. doi: 10.1167/jov.25.1.1. J Vis. 2025. PMID: 39745716 Free PMC article.
-
Eyes on hold: motion task difficulty jointly delays microsaccade and pupil responses.Sci Rep. 2025 Jul 1;15(1):21284. doi: 10.1038/s41598-025-04748-0. Sci Rep. 2025. PMID: 40594181 Free PMC article.
-
Visual adaptation stronger at the horizontal than the vertical meridian: Linking performance with V1 cortical surface area.Proc Natl Acad Sci U S A. 2025 Jul 22;122(29):e2507810122. doi: 10.1073/pnas.2507810122. Epub 2025 Jul 14. Proc Natl Acad Sci U S A. 2025. PMID: 40658843
-
Effect of attention on human direction-discrimination thresholds at iso-eccentric locations in the visual field: A registered report protocol.PLoS One. 2023 Nov 30;18(11):e0289411. doi: 10.1371/journal.pone.0289411. eCollection 2023. PLoS One. 2023. PMID: 38032872 Free PMC article.
References
-
- Albright, T. D. (1989). Centrifugal directional bias in the middle temporal visual area (MT) of the macaque. Visual Neuroscience, 2(2), 177–188. - PubMed
-
- Baldwin, A. S., Meese, T. S., & Baker, D. H. (2012). The attenuation surface for contrast sensitivity has the form of a witch's hat within the central visual field. Journal of Vision, 12(11), 23. - PubMed
-
- Ball, K., & Sekuler, R. (1980). Human vision favors centrifugal motion. Perception, 9(3), 317–325. - PubMed
-
- Ball, K., & Sekuler, R. (1987). Direction-specific improvement in motion discrimination. Vision Research. 27(6), 953–965. - PubMed
Publication types
MeSH terms
Grants and funding
LinkOut - more resources
Full Text Sources
