. 2023 Mar 30:12:e83810.
doi: 10.7554/eLife.83810.

RNA Polymerase II transcription independent of TBP in murine embryonic stem cells

Affiliations

RNA Polymerase II transcription independent of TBP in murine embryonic stem cells

James Z J Kwan et al. Elife. .

Abstract

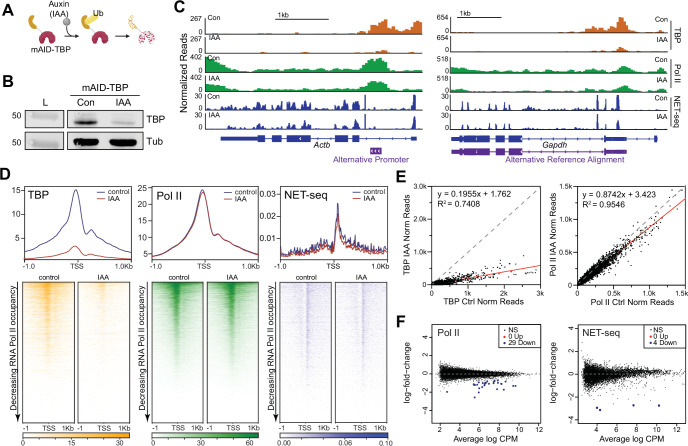
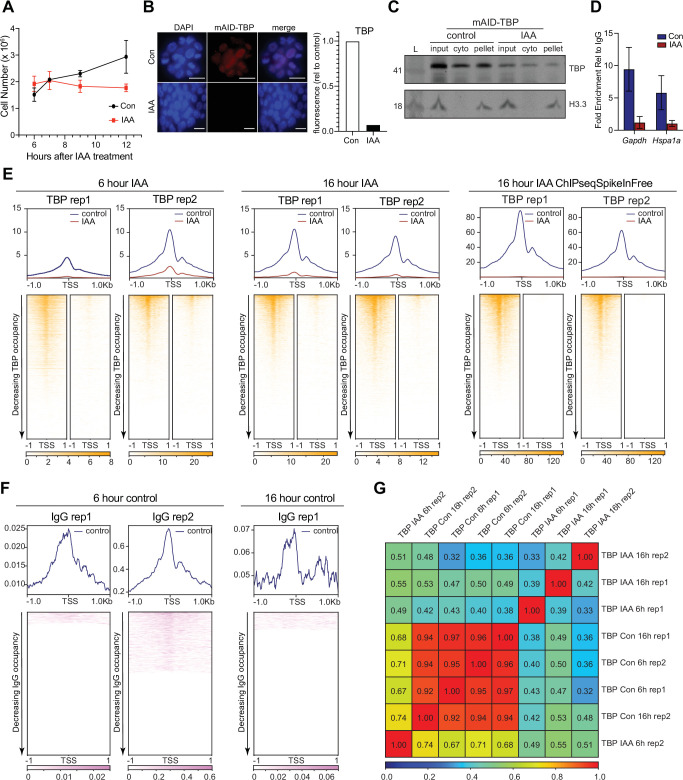
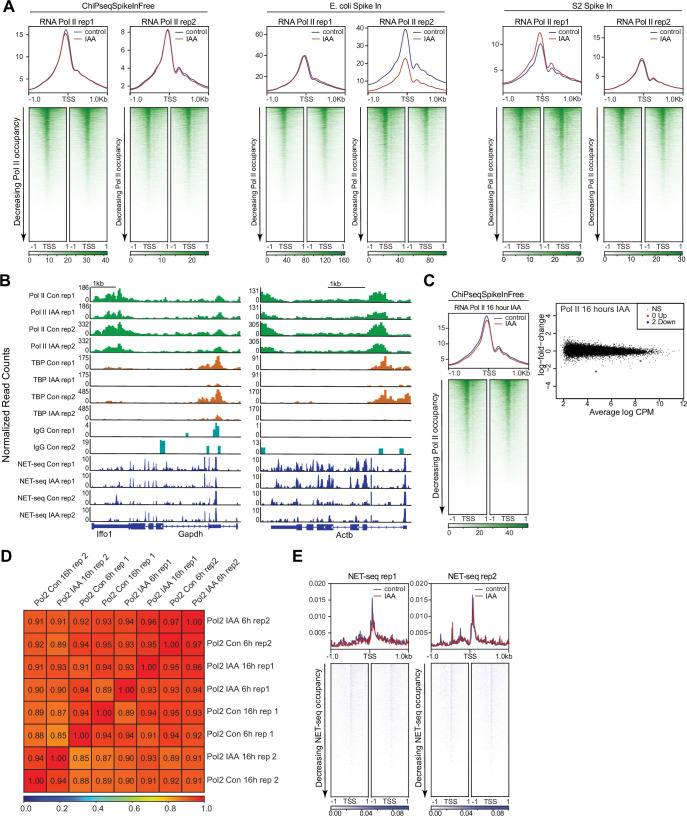
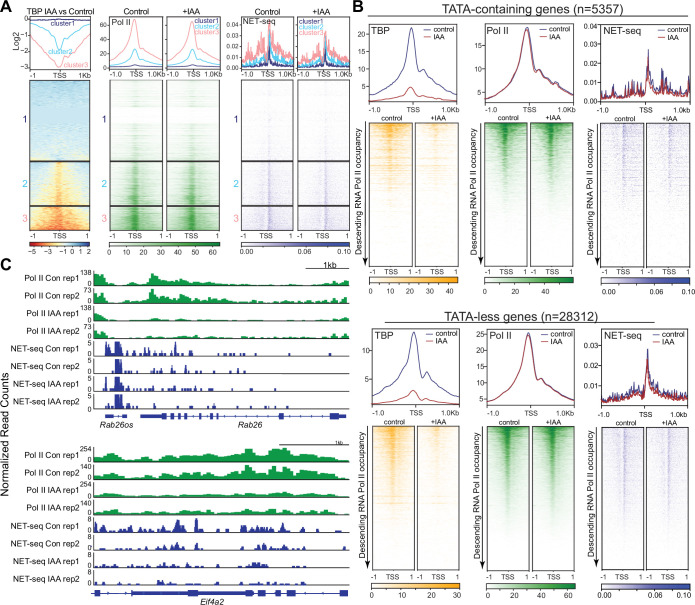
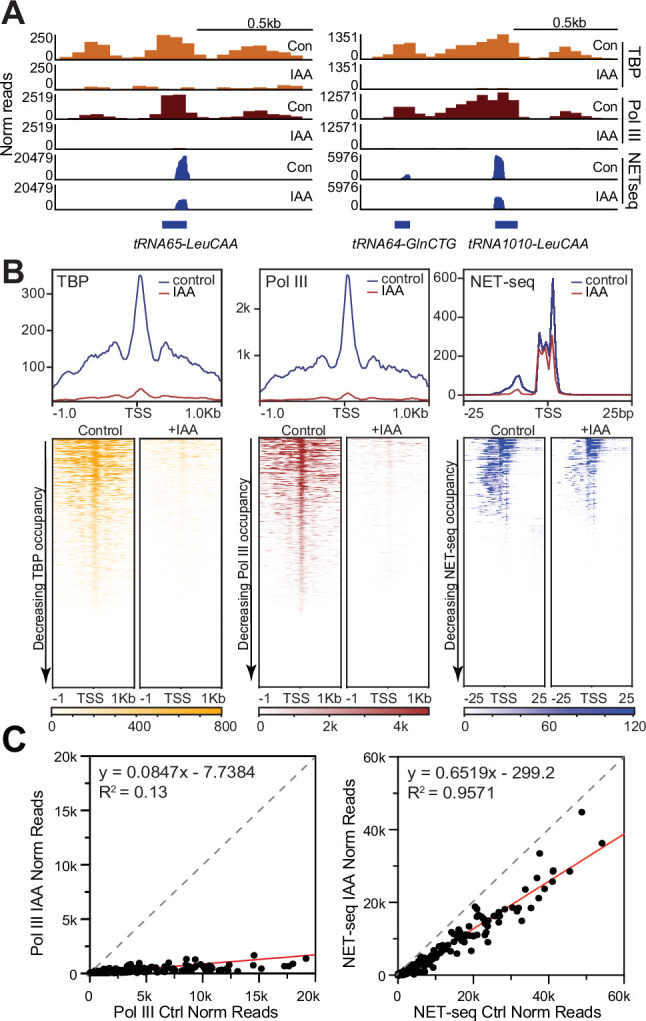
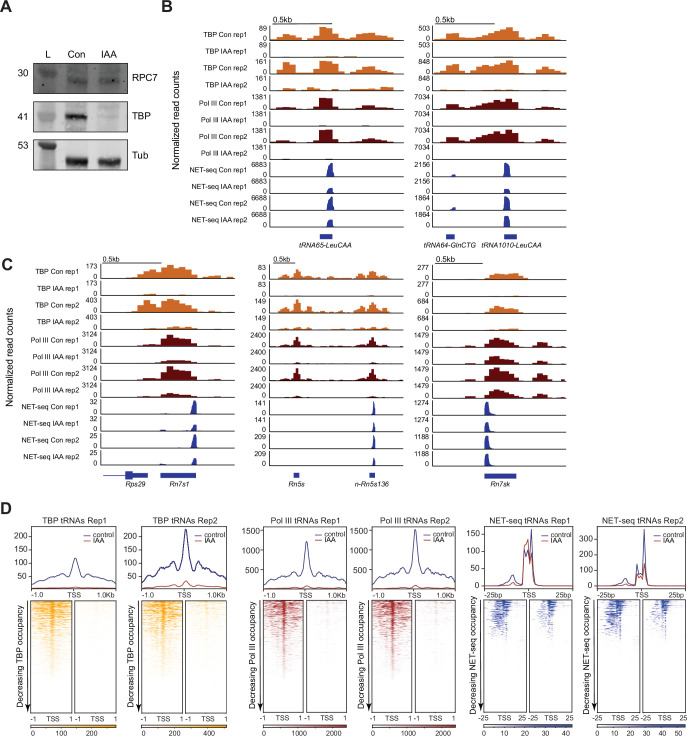
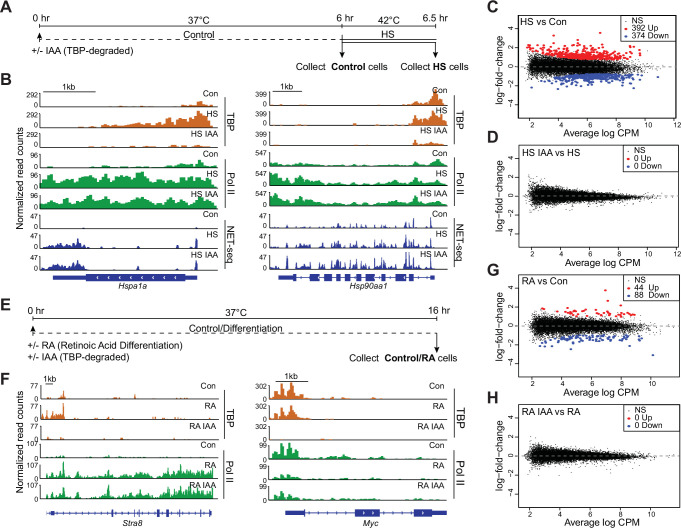
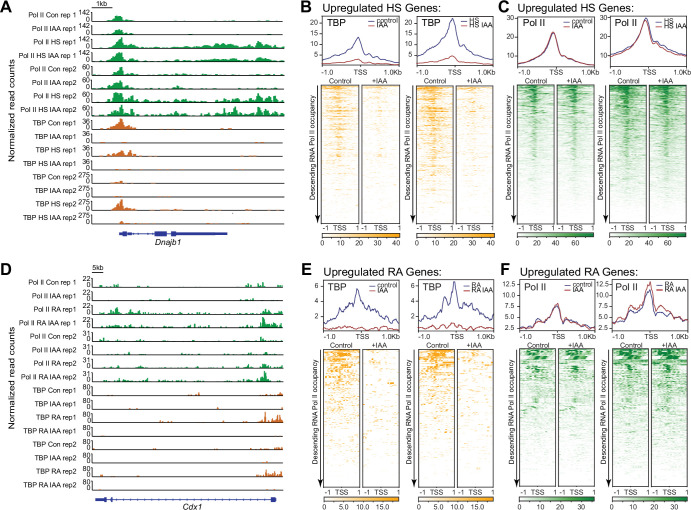
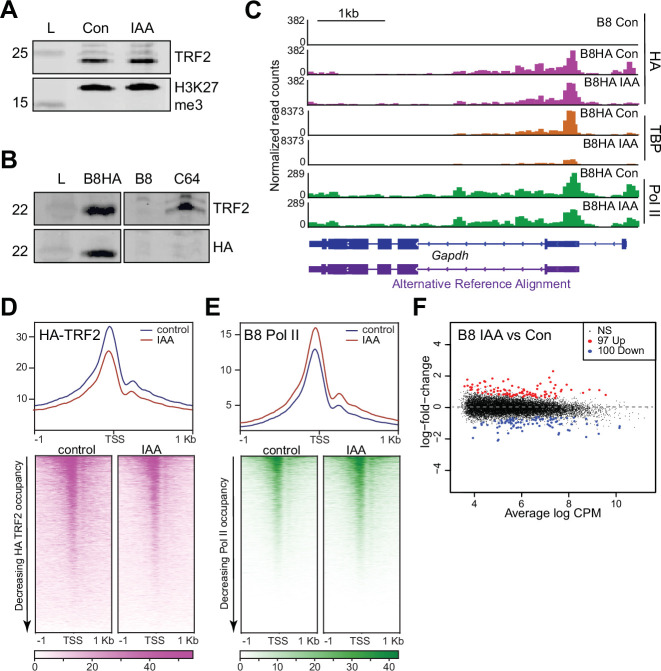
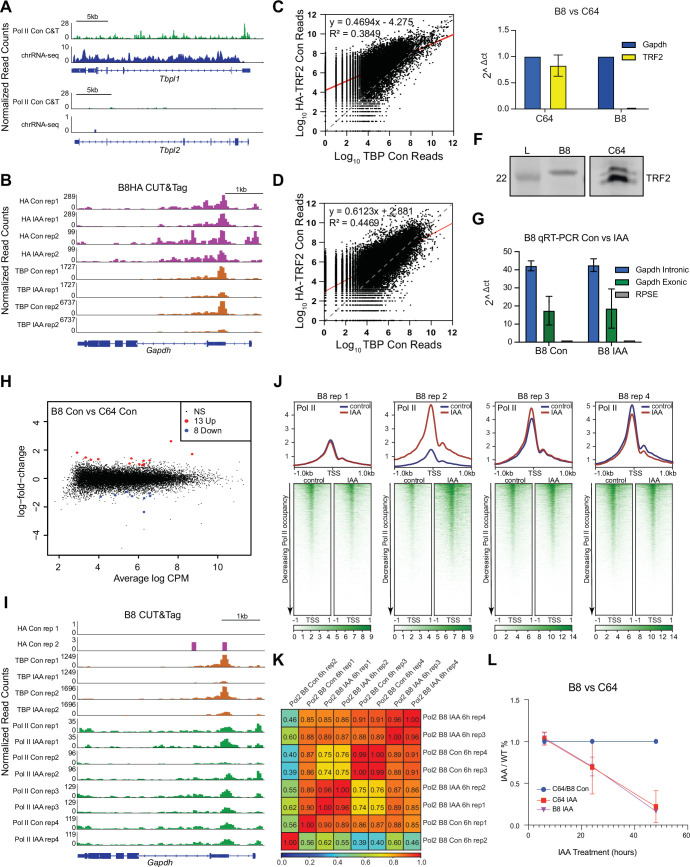
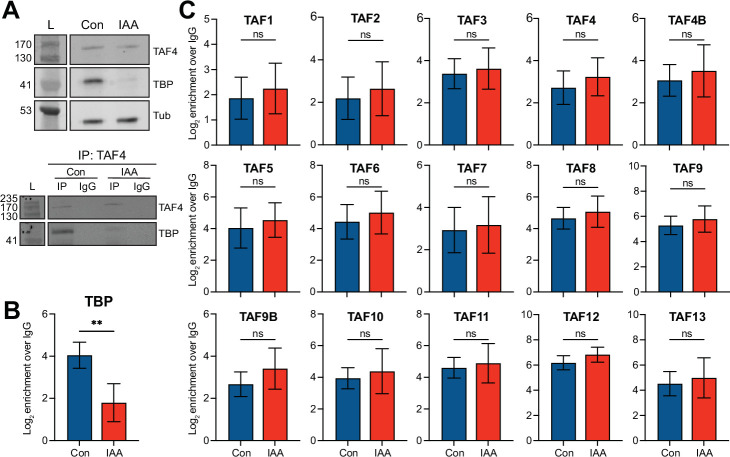
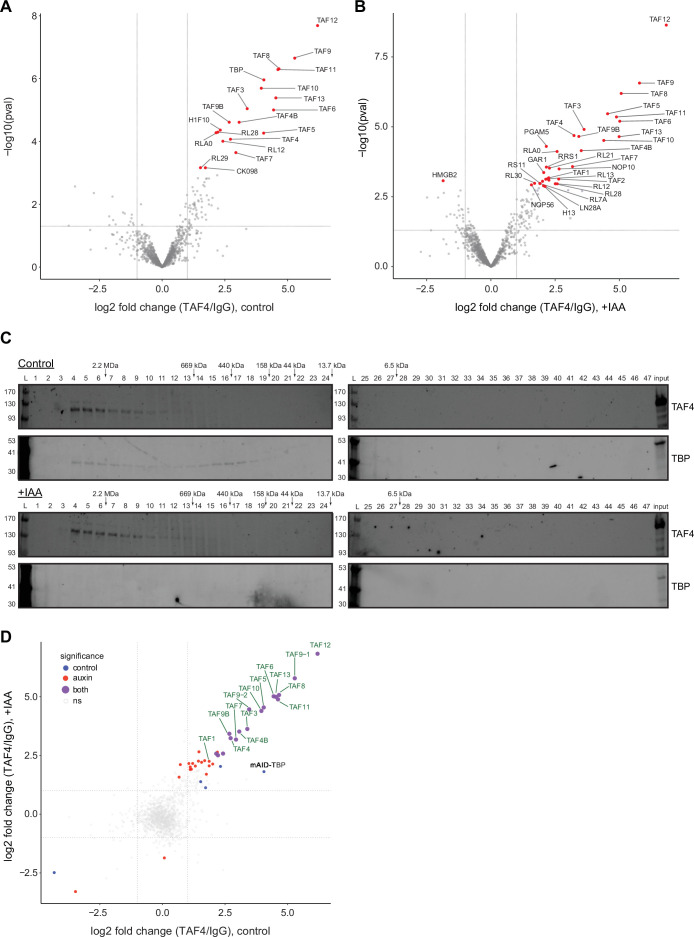
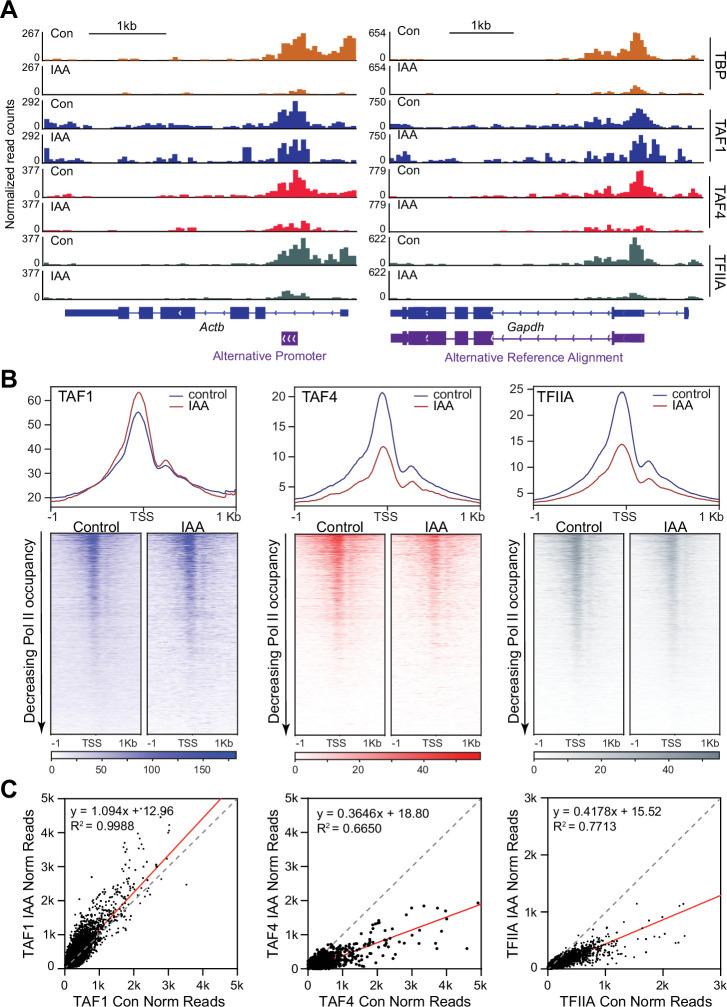
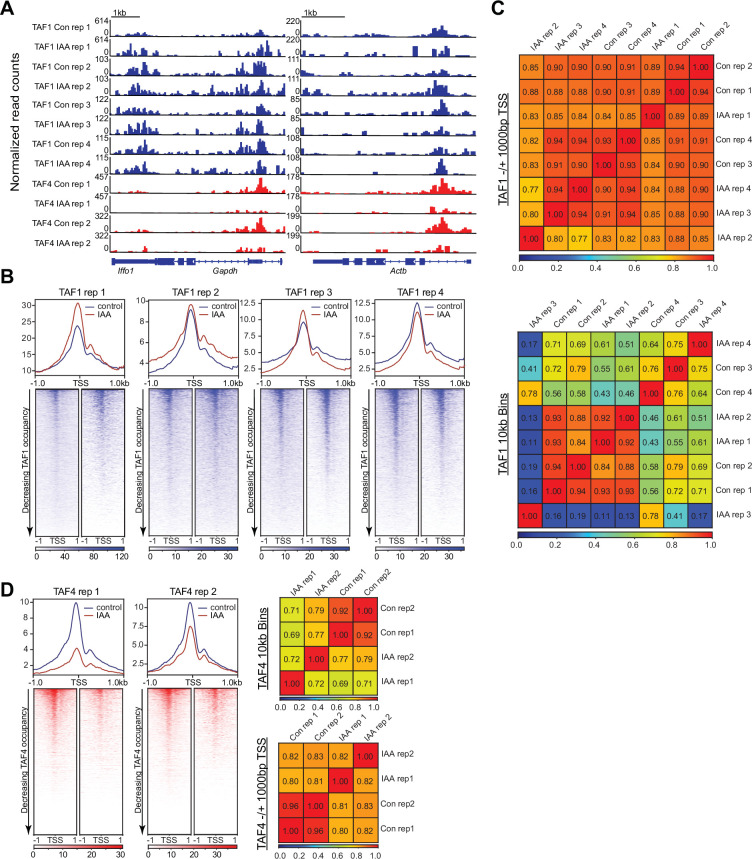
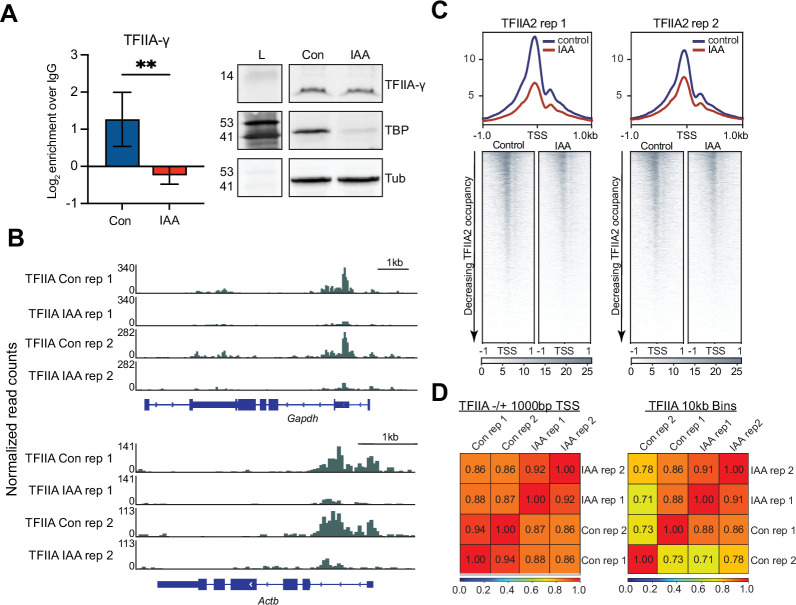
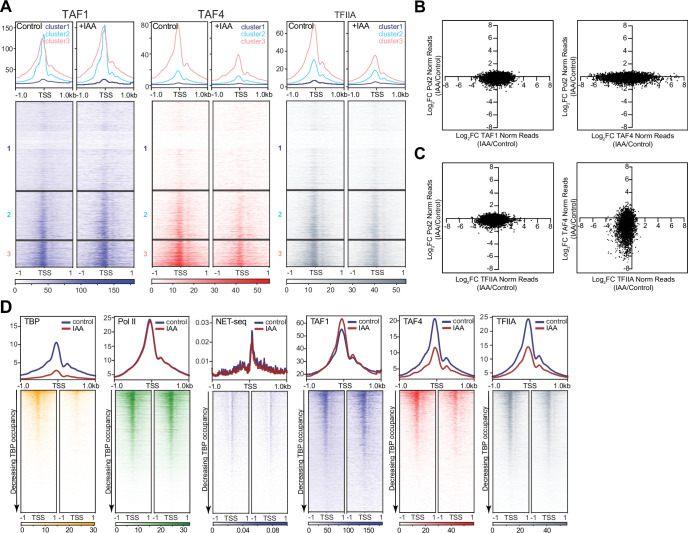
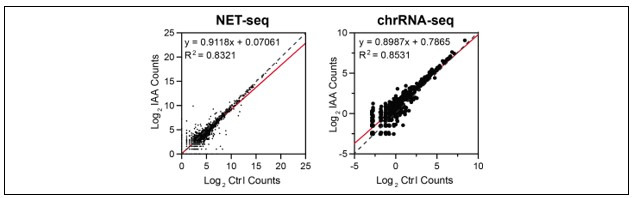
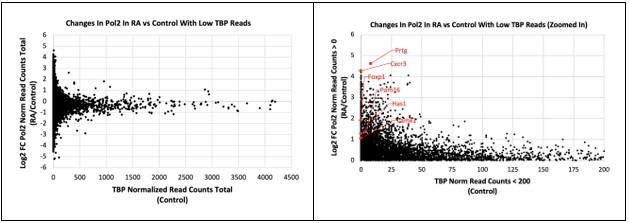
Transcription by RNA Polymerase II (Pol II) is initiated by the hierarchical assembly of the pre-initiation complex onto promoter DNA. Decades of research have shown that the TATA-box binding protein (TBP) is essential for Pol II loading and initiation. Here, we report instead that acute depletion of TBP in mouse embryonic stem cells has no global effect on ongoing Pol II transcription. In contrast, acute TBP depletion severely impairs RNA Polymerase III initiation. Furthermore, Pol II transcriptional induction occurs normally upon TBP depletion. This TBP-independent transcription mechanism is not due to a functional redundancy with the TBP paralog TRF2, though TRF2 also binds to promoters of transcribed genes. Rather, we show that the TFIID complex can form and, despite having reduced TAF4 and TFIIA binding when TBP is depleted, the Pol II machinery is sufficiently robust in sustaining TBP-independent transcription.

Keywords: chromosomes; degron; embryonic stem cells; gene expression; genomics; mouse; transcription.


Conflict of interest statement

JK, TN, AU, MB, JC, JL, FV, PL, ST No competing interests declared

Figures

Figure 1.
Figure 1.. Global Polymerase II (Pol II)-mediated transcription is TATA-box binding protein (TBP)-independent in mouse embryonic stem cells (mESCs).
(A) Schematic of indole-3-acetic acid (IAA)-mediated degradation of mAID-TBP. (B) Western blot analyses of whole cell lysates for control and IAA-treated C64 mESCs blotting for ɑ-TBP, with ɑ-Tubulin used as a loading control. Cells were incubated with DMSO (control) or 500 μM IAA for 6 hr unless otherwise stated. (C) Gene browser tracks of Actb (top) and Gapdh (bottom) for cleavage under targets and tagmentation (CUT&Tag) analyses of TBP (orange) and Pol II (green), and strand-specific reads from NET-seq data (blue) in control or IAA-treated C64 mESCs. Alternative promoters are indicated. (D) Genome-wide average plots (top) and heatmaps (bottom) arranged by decreasing Pol II occupancy of TBP CUT&Tag (left), Pol II CUT&Tag (middle), and NET-seq (right) in a 2 kb window surrounding the transcription start site (TSS) of all genes for control and IAA-treated C64 mESCs. (E) Normalized read counts of TBP (left) and Pol II (right) CUT&Tag signal for control vs. IAA-treated C64 mESCs in the promoter (–250 to TSS) region of each gene are displayed as a scatter plot. (F) Differential gene expression (DGE) analysis of Pol II CUT&Tag (left) and NET-seq analysis (right) in control vs. IAA-treated C64 mESCs.
Figure 1—figure supplement 1.
Figure 1—figure supplement 1.. Characterization of TATA-box binding protein (TBP) degradation.
(A) Cell growth curve of C64 mouse embryonic stem cells (mESCs) from 6 to 12 hr of treatment with DMSO (Con, black) or indole-3-acetic acid (IAA) (IAA, red). Error bars represent standard deviation; n=2. (B) Immunofluorescence of α-TBP in C64 mESCs in control conditions and after 6 hr of IAA treatment (left) and quantification of the fluorescence signal (right). Scale bars represent 20 μM in length. (C) Western blot analyses for α-TBP of control and IAA-treated C64 cellular fractionation extracts. The histone mark H3.3 was used to verify proper fractionation. (D) ChIP-qPCR with TBP pull-down on Gapdh and Hspa1a promoters in control vs. IAA conditions normalized to IgG signal. Primers are listed in Supplementary file 7. Error bars represent standard deviation; n=2. (E) Genome-wide average plots (top) and heatmaps (bottom) arranged by decreasing TBP occupancy for 6 and 16 hr spike-in and 16 hr ChIPseqSpikeInFree normalized TBP cleavage under targets and tagmentation (CUT&Tag) in a 2 kb window surrounding the transcription start site (TSS) of all genes with two biological replicates of control and IAA-treated C64 mESCs. (F) Genome-wide average plots (top) and heatmaps (bottom) arranged by decreasing IgG occupancy for 6 and 16 hr IgG CUT&Tag in a 2 kb window surrounding the TSS of all genes in control C64 mESCs. Note that the dynamic range of the y-axis is much smaller than the TBP CUT&Tag data. (G) Pearson correlation analysis of CUT&Tag replicates for TBP. Average score is based on equally sized 10 kb bins, which consecutively cover the entire genome.
Figure 1—figure supplement 2.
Figure 1—figure supplement 2.. Replicate analysis of Polymerase II (Pol II) cleavage under targets and tagmentation (CUT&Tag) and NET-seq data.
(A) Genome-wide average plots (top) and heatmaps (bottom) arranged by decreasing Pol II occupancy for ChIPseqSpikeInFree and Escherichia coli and S2 spike-in normalized Pol II CUT&Tag in a 2 kb window surrounding the transcription start site (TSS) of all genes with two biological replicates of control and 6 hr indole-3-acetic acid (IAA)-treated C64 mouse embryonic stem cells (mESCs). (B) Gene browser tracks of Gapdh (left) and Actb (right) for CUT&Tag analyses of Pol II (green), TATA-box binding protein (TBP) (orange), and strand-specific reads from NET-seq data (blue) with two biological replicates of control or IAA-treated C64 mESCs. (C) Genome-wide average plots (top) and heatmaps (bottom) arranged by decreasing Pol II occupancy for 16 hr Pol II ChIPseqSpikeInFree normalization (left). Differential gene expression (DGE) analysis (right) of Pol II CUT&Tag for control and 16 hr IAA-treated cells. (D) Pearson correlation analysis of CUT&Tag replicates for Pol II. Average score is based on equally sized 10 kb bins, which consecutively cover the entire genome. (E) Genome-wide average plots (top) and heatmaps (bottom) arranged by decreasing NET-seq occupancy in a 2 kb window surrounding the TSS of all genes with two biological replicates of control and IAA-treated C64 mESCs.
Figure 1—figure supplement 3.
Figure 1—figure supplement 3.. TATA-box binding protein (TBP) is not required for transcription of specific subsets of genes.
(A) Average plots and heatmaps k-means clustering with k=3 of the log2 indole-3-acetic acid (IAA)/control of TBP cleavage under targets and tagmentation (CUT&Tag) data (left). Polymerase II (Pol II) CUT&Tag (middle) and NET-seq (right) average plots and heatmaps using k=3 clustering from TBP (B) Average plots and heatmaps arranged by decreasing Pol II occupancy for TBP CUT&Tag (left), Pol II CUT&Tag (middle), and NET-seq (right) in a 2 kb window surrounding the transcription start site (TSS) of all TATA-containing and TATA-less genes for control and IAA-treated C64 mouse embryonic stem cells (mESCs) with two biological replicates. (C) Gene browser tracks of Rab26 (top) and Eif4a2 (bottom) for CUT&Tag analysis of Pol II (green), and strand-specific reads from NET-seq data (blue) of two biological replicates for control and IAA-treated C64 mESCs.
Figure 2.
Figure 2.. TATA-box binding protein (TBP) is required for Pol III transcription of tRNAs in mouse embryonic stem cells (mESCs).
(A) Gene browser tracks of tRNA65-LeuCAA (top) and tRNA64-GlnCTG/tRNA1010-LeuCAA (bottom) for cleavage under targets and tagmentation (CUT&Tag) analyses of TBP (orange), Pol III (brown), and NET-seq data (blue) in control or indole-3-acetic acid (IAA)-treated C64 mouse embryonic stem cells (mESCs). (B) Average plots (top) and heatmaps arranged by decreasing occupancy (bottom) for TBP CUT&Tag (left), Pol III CUT&Tag (middle), and NET-seq (right) in a 2 kb window (CUT&Tag) or 50 bp window (NET-seq) surrounding the transcription start site (TSS) of all tRNAs. (C) Normalized read counts of Pol III CUT&Tag (top) and NET-seq signal (bottom) for control vs. IAA-treated mESCs in either the promoter (–250 bp to TSS) region of each tRNA gene for CUT&Tag or 50 bp window surrounding the TSS of all tRNAs for NET-seq.
Figure 2—figure supplement 1.
Figure 2—figure supplement 1.. Replicate analysis of TATA-box binding protein (TBP) and Pol III cleavage under targets and tagmentation (CUT&Tag).
(A) Western blot analyses for the Pol III subunit α-RPC7 and α-TBP of control and indole-3-acetic acid (IAA)-treated C64 mESCs. Tubulin is used as a loading control. (B) Gene browser tracks of tRNA65-LeuCAA (left) and tRNA64-GlnCTG/tRNA-1010-LeuCAA (right) for CUT&Tag analyses of TBP (orange), Pol III (brown), and strand-specific reads from NET-seq data (blue) with two biological replicates of control or IAA-treated C64 mouse embryonic stem cells (mESCs). (C) Gene browser tracks of n-Rn5s136 (left), Rn7sk (middle), and Rn7s1 (right) for CUT&Tag analyses of TBP (orange), Pol III (brown) and strand-specific reads from NET-seq data (blue) with two biological replicates of control or IAA-treated C64 mESCs. (D) Average plots (top) and heatmaps (bottom) arranged by decreasing occupancy of TBP CUT&Tag (left), Pol III CUT&Tag (middle), and NET-seq (right) in a 2 kb window (CUT&Tag) or 50 bp window (NET-seq) surrounding the transcription start site (TSS) of all tRNAs with two biological replicates of control and IAA-treated C64 mESCs.
Figure 3.
Figure 3.. TATA-box binding protein (TBP) is dispensable for gene activation by heat shock and retinoic acid differentiation in mouse embryonic stem cells (mESCs).
(A) Schematic of heat shock treatments for C64 mESCs. After 6 hr of treatment with auxin (indole-3-acetic acid [IAA]) or DMSO, cells were either collected or subjected to heat shock at 42°C for 30 min before collection. (B) Gene browser tracks of Hspa1a (left) and Hsp90aa1 (right) for cleavage under targets and tagmentation (CUT&Tag) analyses of TBP (orange), Polymerase II (Pol II) (green), and NET-seq data (blue) in control or IAA-treated C64 mESCs. (C–D) Differential gene expression (DGE) analysis of Pol II CUT&Tag in heat shocked vs. control C64 mESCs (C) and in heat shocked + IAA-treated vs. heat shocked C64 mESCs (D). (E) Schematic of retinoic acid (RA) treatment for C64 mESCs. Cells were treated for 16 hr with DMSO or IAA and RA before collection. (F) Gene browser tracks of Stra8 (left) and Myc (right) for CUT&Tag analyses of TBP (orange), Pol II (green) in control or IAA-treated C64 mESCs. (G–H) DGE analysis of Pol II CUT&Tag in RA-treated vs. control C64 mESCs (G) and in RA + IAA-treated vs. RA-treated C64 mESCs (H).
Figure 3—figure supplement 1.
Figure 3—figure supplement 1.. Replicate analysis of TATA-box binding protein (TBP) and Polymerase II (Pol II) cleavage under targets and tagmentation (CUT&Tag), and NET-seq data on heat shock (HS)- and retinoic acid (RA)-induced genes.
(A) Gene browser tracks of Dnajb1 for CUT&Tag analyses of Pol II (green) and TBP (orange) in control, indole-3-acetic acid (IAA)-treated, HS and HS IAA-treated C64 mouse embryonic stem cells (mESCs) with two biological replicates. (B–C) Average plots and heatmaps arranged by decreasing Pol II occupancy for TBP and Pol II CUT&Tag in a 2 kb window surrounding the transcription start site (TSS) of the top 275 upregulated HS genes identified from edgeR differential gene expression (DGE) analysis for control, IAA, HS, and HS IAA-treated C64 mESCs. (D) Gene browser tracks of Cdx1 for Pol II (green) and TBP (orange) CUT&Tag in control, IAA-treated, RA, and RA IAA-treated C64 mESCs with two biological replicates. (E–F) Average plots and heatmaps arranged by decreasing Pol II occupancy for TBP and Pol II CUT&Tag in a 2 kb window surrounding the TSS of the top 44 upregulated RA genes identified from edgeR DGE analysis for control, IAA, RA, and RA IAA-treated C64 mESCs.
Figure 4.
Figure 4.. TATA-box binding protein (TBP) paralog TBP-related factor 2 (TRF2) is expressed in mouse embryonic stem cells (mESCs), but does not functionally replace TBP.
(A) Western blot analyses of whole cell lysates for α-TRF2 and α-H3K27me3 in control and indole-3-acetic acid (IAA)-treated C64 mESCs. (B) Western blot analyses of whole cell lysates for α-TRF2 and α-HA in the TRF2 knock-out cells overexpressing HA-TRF2 (B8HA), TRF2 knock-out cell line (B8), and C64. α-HA shows the TRF2 band in only the B8HA cell line, indicating proper and specific expression of HA-TRF2. (C) Gene browser tracks of Gapdh for cleavage under targets and tagmentation (CUT&Tag) analyses of α-HA (magenta), TBP (orange), and Polymerase II (Pol II) (green), in control or IAA-treated B8HA cell line. (D) Genome-wide average plot (top) and heatmap (bottom) arranged by decreasing HA-TRF2 occupancy of α-HA CUT&Tag in a 2 kb window surrounding the transcription start site (TSS) of all genes for control and IAA-treated B8HA mESCs. (E) Genome-wide average plot (top) and heatmap (bottom) arranged by decreasing Pol II occupancy of α-Pol II CUT&Tag in a 2 kb window surrounding the TSS of all genes for control and IAA-treated B8 mESCs. (F) Differential gene expression (DGE) analysis of Pol II CUT&Tag in control vs. IAA-treated B8 mESCs.
Figure 4—figure supplement 1.
Figure 4—figure supplement 1.. Characterization of TRF2 knock-out B8 cells.
(A) Gene browser tracks of Tbpl1 (top) and Tbpl2 (bottom) for Polymerase II (Pol II) cleavage under targets and tagmentation (CUT&Tag) (green) and chrRNA-seq (blue) in C64 mouse embryonic stem cells (mESCs). Data for chrRNA-seq was previously published (Teves et al., 2018). (B) Gene browser tracks of Gapdh for CUT&Tag analyses of HA (magenta) and TATA-box binding protein (TBP) (orange) in control and indole-3-acetic acid (IAA)-treated B8HA mESCs with two biological replicates. (C–D) Read counts of HA control B8HA mESCs vs. TBP control C64 mESCs were summed for replicates at the promoter (–250 bp to the transcription start site [TSS]) for all genes, log2 transformed and displayed as a scatter plot (top). Same analysis was done for HA control B8HA vs. Pol II C64 control CUT&Tag data. Linear regression was done to determine slope and R2 value for each plot. (E) qRT-PCR analysis of Tbpl1 (TRF2) in C64 mESCs compared to B8 mESCs normalized to Gapdh expression levels to confirm TRF2 knock-out. Error bars represent standard deviation of n=2. (F) Western blot analyses of whole cell lysates for B8 and C64 cell lines confirming TRF2 knock-out. (G) qRT-PCR analysis of intronic and exonic Gapdh signal normalized to RPSE Drosophila spike-in signal in control (Con) and IAA-treated (IAA) B8 mESCs. Error bars represent standard deviation of n=2. (H) Differential gene expression (DGE) analysis of Pol II CUT&Tag in control B8 mESCs vs. control C64 mESCs. (I) Gene browser tracks of Gapdh for CUT&Tag analyses of HA (magenta), TBP (orange), and Pol II (green) in control and IAA-treated B8 mESCs with two biological replicates for HA and TBP and four biological replicates for Pol II. (J) Genome-wide average plots and heatmaps arranged by decreasing Pol II occupancy for Pol II CUT&Tag in a 2 kb window surrounding the TSS of all genes for control and IAA-treated B8 mESCs. (K) Pearson correlation analysis of Pol II control and 6 hr of IAA in B8 mESCs. Average score is based on equally sized 10 kb bins, which consecutively cover the entire genome. (L) Cell death curve of C64 and B8 mESCs with 6–48 hr of DMSO (Con, blue) or IAA (IAA, red/magenta). Treatments were normalized to control cells. Error bars represent standard deviation; n=2.
Figure 5.
Figure 5.. The TFIID complex forms upon TATA-box binding protein (TBP) depletion.
(A) Top: Western blot analyses for α-TAF4, α-TBP, and α-Tubulin of control and indole-3-acetic acid (IAA)-treated C64 whole cell extracts used in the TAF4 IP-MS analyses. Input represents 5% of the protein samples used in the TAF4 IPs. Bottom: Western blot analyses for α-TAF4 and α-TBP of TAF4 IPs from control and IAA-treated C64 whole cell extracts. (B–C) Boxplots showing abundance of TBP (B) and the TBP-associated factors (TAFs) (C) from α-TAF4 IP-MS analyses of control (blue) and IAA-treated (red) C64 mouse embryonic stem cells (mESCs). Protein levels were normalized to levels in α-IgG pull-downs from the same cells. Two asterisks represent p≤0.01 using standard two-tailed t-test. Error bars represent standard deviation of n=4.
Figure 5—figure supplement 1.
Figure 5—figure supplement 1.. TAF4 IP-MS analyses in control and TATA-box binding protein (TBP)-depleted cells.
(A) Volcano plot of the log2 fold change of proteins enriched in α-TAF4 IPover mouse IgG from control C64 mESCs, versus the -log10 transformed t-test p-value in control C64 mouse embryonic stem cells (mESCs). Red dots: Significant proteins at adjusted p<0.05, gray dots: non-significant proteins. (B) Same as (A), but for indole-3-acetic acid (IAA)-treated C64 mESCs. (C) Western blot analyses of gel filtration fractions from control and IAA-treated C64 cells with α-TAF4 and α-TBP. Fraction numbers are shown above each lane and known molecular mass markers are also shown. Nucleic acid contamination in the nuclear lysates could be contributing to a shift toward earlier elutions (fraction 4–17, >2 MDa) containing TAF4 and TBP. (D) Scatter plot of the log2 fold change of proteins enriched in α-TAF4 IP over mouse IgG from control C64 mESCs versus the log2 fold change of proteins enriched in α-TAF4 IP over mouse IgG from IAA-treated C64 mESCs. Significant proteins at adjusted p<0.05 for control (blue dots), IAA-treated mESCs (red dots) and both (purple dots). Gray dots: non-significant proteins.
Figure 6.
Figure 6.. Effects of TATA-box binding protein (TBP) depletion on the DNA binding of TAF1, TAF4, and TFIIA.
(A) Gene browser tracks of Actb (top) and Gapdh (bottom) for cleavage under targets and tagmentation (CUT&Tag) analyses of TAF1 (blue), TAF4 (red), and TFIIA (gray). TBP signal (orange) from Figure 1 is replotted for comparison. (B) Genome-wide average plots (top) and heatmaps (bottom) arranged by decreasing Polymerase II (Pol II) occupancy for TAF1 (left), TAF4 (middle), and TFIIA (right) CUT&Tag in a 2 kb window surrounding the transcription start site (TSS) of all genes for control and indole-3-acetic acid (IAA)-treated C64 mouse embryonic stem cells (mESCs). (C) Normalized read counts of TAF1 (left), TAF4 (middle), and TFIIA (right) CUT&Tag for control vs. IAA-treated C64 mESCs at the promoter (–250 bp to the TSS) region for all genes.
Figure 6—figure supplement 1.
Figure 6—figure supplement 1.. Replicate analysis of Taf1 and Taf4 cleavage under targets and tagmentation (CUT&Tag), and NET-seq data.
(A) Gene browser tracks of Gapdh (left) and Actb (right) for CUT&Tag analyses of TAF1 (blue) and TAF4 (red) with four biological replicates of TAF1 and two biological replicates of TAF4 in control or indole-3-acetic acid (IAA)-treated C64 mESCs. (B) Genome-wide average plots (top) and heatmaps (bottom) arranged by decreasing occupancy for TAF1 (blue) in a 2 kb window surrounding the transcription start site (TSS) of all genes with four biological replicates of control and IAA-treated C64 mESCs. (C) Pearson correlation analysis of TAF1. Average score is based on equally sized 10 kb bins, which consecutively cover the entire genome or surrounding the TSS of genes (-/+1000 bp of the TSS). (D) Genome-wide average plots (top) and heatmaps (bottom) arranged by decreasing occupancy for TAF4 (red) in a 2 kb window surrounding the TSS of all genes with two biological replicates of control and IAA-treated C64 mESCs. Pearson correlation is also shown (right). Average score is based on equally sized 10 kb bins, which consecutively cover the entire genome or surrounding the TSS of genes (-/+1000 bp of the TSS).
Figure 6—figure supplement 2.
Figure 6—figure supplement 2.. Replicate analysis of TFIIA cleavage under targets and tagmentation (CUT&Tag).
(A) Left: Boxplots showing abundance of TFIIA-γ from α-TAF4 IP-MS analyses of control (blue) and indole-3-acetic acid (IAA)-treated (red) C64 mouse embryonic stem cells (mESCs). Protein levels were normalized to levels in α-IgG pull-downs from the same cells. Two asterisks represent p≤0.01 using standard two-tailed t-test. Error bars represent standard deviation of n=4. Right: Western blot analyses for α-TFIIA-γ, α-TBP, and α-Tubulin of control and IAA-treated C64 whole cell lysates. (B) Gene browser tracks of Gapdh (top) and Actb (bottom) for CUT&Tag analyses of TFIIA (gray) with two biological replicates of control and IAA-treated (IAA). (C) Genome-wide average plots (top) and heatmaps (bottom) of TFIIA CUT&Tag arranged by decreasing occupancy for TFIIA (gray) in a 2 kb window surrounding the transcription start site (TSS) of all genes with two biological replicates of control and IAA-treated C64 mESCs. (D) Pearson correlation analysis of TFIIA. Average score is based on equally sized 10 kb bins, which consecutively cover the entire genome or surrounding the TSS of genes (-/+1000 bp of the TSS).
Figure 6—figure supplement 3.
Figure 6—figure supplement 3.. Comparisons between Polymerase II (Pol II) TAF1, TAF4, and TFIIA.
(A) Genome-wide average plots and heatmaps of TAF1 (left), TAF4 (middle), and TFIIA (right) cleavage under targets and tagmentation (CUT&Tag) arranged by k-means k=3 log2 indole-3-acetic acid (IAA)/control from TATA-box binding protein (TBP) CUT&Tag data clustering from S3A. (B) Log2 read counts of TAF1 (left) and TAF4 (right) IAA/control vs. log2 read counts of Pol II IAA/control C64 mouse embryonic stem cells (mESCs) at the promoter (–250 bp to the transcription start site [TSS]) region for all genes. (C) Left: Log2 read counts of TFIIA IAA/control vs. log2 read counts of Pol II IAA/control C64 mESCs at the promoter (–250 bp to the TSS) region for all genes. Right: Log2 read counts of TAF4 IAA/control vs. log2 read counts of TFIIA IAA/control C64 mESCs at the promoter of all genes (–250 bp to TSS). (D) Genome-wide average plots (top) and heatmaps (bottom) arranged by decreasing TBP occupancy for TBP (orange), Pol II (green), NET-seq (light-blue) TAF1(blue), TAF4 (red), and TFIIA (gray) in a 2 kb window surrounding the TSS of all genes.
Author response image 1.
Author response image 2.

Update of

Comment in

References

    1. Akhtar W, Veenstra GJC. TBP2 is a substitute for TBP in Xenopus oocyte transcription. BMC Biology. 2009;7:45. doi: 10.1186/1741-7007-7-45. - DOI - PMC - PubMed
    1. Akhtar W, Veenstra GJC. TBP-related factors: a paradigm of diversity in transcription initiation. Cell & Bioscience. 2011;1:23. doi: 10.1186/2045-3701-1-23. - DOI - PMC - PubMed
    1. Antonova SV, Haffke M, Corradini E, Mikuciunas M, Low TY, Signor L, van Es RM, Gupta K, Scheer E, Vos HR, Tora L, Heck AJR, Timmers HTM, Berger I. Chaperonin CCT checkpoint function in basal transcription factor TFIID assembly. Nature Structural & Molecular Biology. 2018;25:1119–1127. doi: 10.1038/s41594-018-0156-z. - DOI - PMC - PubMed
    1. Buratowski S, Hahn S, Sharp PA, Guarente L. Function of a yeast TATA element-binding protein in a mammalian transcription system. Nature. 1988;334:37–42. doi: 10.1038/334037a0. - DOI - PubMed
    1. Buratowski S, Hahn S, Guarente L, Sharp PA. Five intermediate complexes in transcription initiation by RNA polymerase II. Cell. 1989;56:549–561. doi: 10.1016/0092-8674(89)90578-3. - DOI - PubMed

Publication types

MeSH terms

Associated data

Grants and funding